

Analyzing factors affecting positivity in drive-through COVID-19 testing: a cross-sectional study
- PMID: 38745200
- PMCID: PMC11094999
- DOI: 10.1186/s12985-024-02388-w
Analyzing factors affecting positivity in drive-through COVID-19 testing: a cross-sectional study
Abstract
Background: Demand for COVID-19 testing prompted the implementation of drive-through testing systems. However, limited research has examined factors influencing testing positivity in this setting.
Methods: From October 2020 to March 2023, a total of 1,341 patients, along with their clinical information, were referred from local clinics to the Sasebo City COVID-19 drive-through PCR center for testing. Association between clinical information or factors related to the drive-through center and testing results was analyzed by Fisher's exact test and logistic regression models.
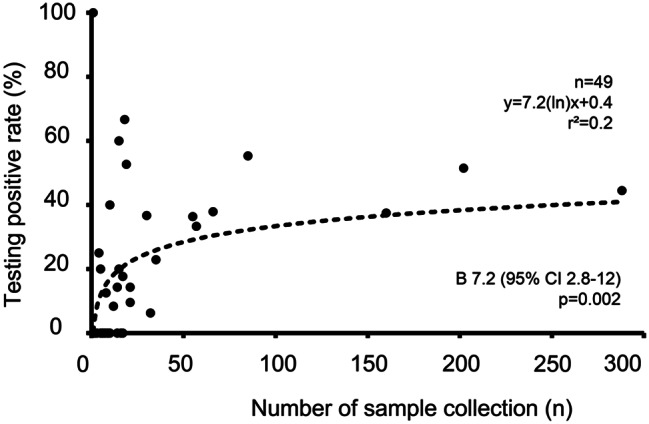
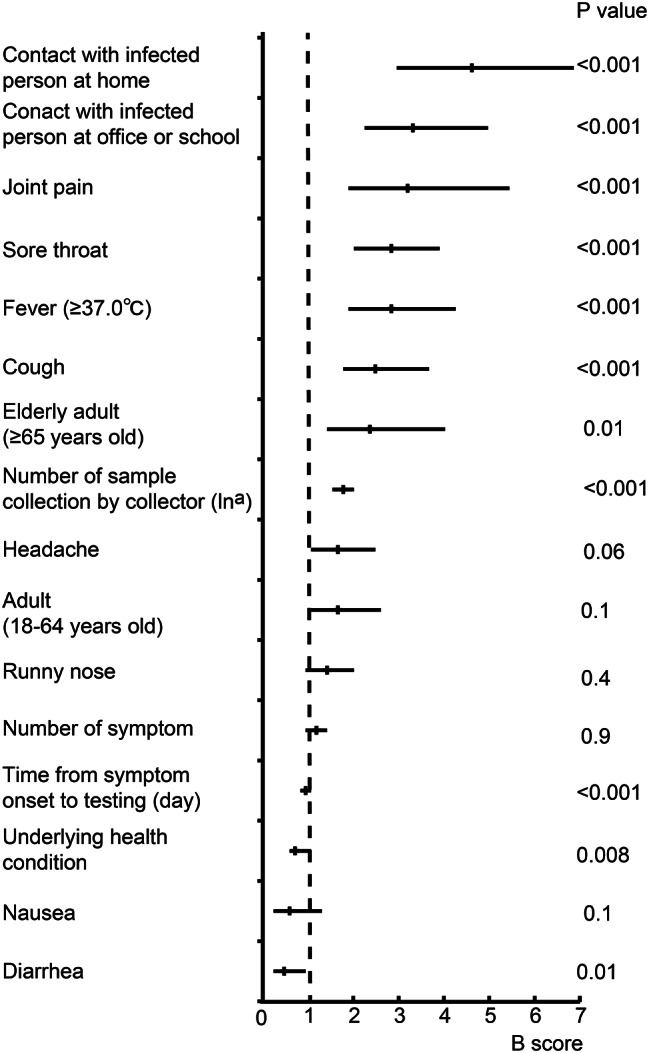
Results: Individuals testing positive exhibited higher frequencies of upper respiratory symptoms; cough (OR 1.5 (95% CI 1.2-1.8), p < 0.001, q = 0.005), sore throat (OR 2.4 (95% CI 1.9-3.0), p < 0.001, q < 0.001), runny nose (OR 1.4 (95% CI 1.1-1.8), p = 0.002, q = 0.009), and systemic symptoms; fever (OR 1.5 (95% CI 1.1-2.0), p = 0.006, q = 0.02), headache (OR 1.9 (95% CI 1.4-2.5), p < 0.001, q < 0.001), and joint pain (OR 2.7 (95% CI 1.8-4.1), p < 0.001, q < 0.001). Conversely, gastrointestinal symptoms; diarrhea (OR 0.2 (95% CI 0.1-0.4), p < 0.001, q < 0.001) and nausea (OR 0.3 (95% CI 0.1-0.6), p < 0.001, q < 0.001) were less prevalent among positives. During omicron strain predominant period, higher testing positivity rate (OR 20 (95% CI 13-31), p < 0.001) and shorter period from symptom onset to testing (3.2 vs. 6.0 days, p < 0.001) were observed compared to pre-omicron period. Besides symptoms, contact history with infected persons at home (OR 4.5 (95% CI 3.1-6.5), p < 0.001, q < 0.001) and in office or school (OR 2.9 (95% CI 2.1-4.1), p < 0.001, q < 0.001), as well as the number of sample collection experiences by collectors (B 7.2 (95% CI 2.8-12), p = 0.002) were also associated with testing results.
Conclusions: These findings underscore the importance of factors related to drive-through centers, especially contact history interviews and sample collection skills, for achieving higher rates of COVID-19 testing positivity. They also contribute to enhanced preparedness for next infectious disease pandemics.
Keywords: COVID-19; Contact history; Drive-through testing; Omicron; Sample collection technique; Symptoms.
© 2024. The Author(s).
Conflict of interest statement
The authors declare that they have no competing interests.
Figures
Similar articles
-
COVID-19 Symptoms and Duration of Rapid Antigen Test Positivity at a Community Testing and Surveillance Site During Pre-Delta, Delta, and Omicron BA.1 Periods.JAMA Netw Open. 2022 Oct 3;5(10):e2235844. doi: 10.1001/jamanetworkopen.2022.35844. JAMA Netw Open. 2022. PMID: 36215069 Free PMC article.
-
COVID-19 symptoms at time of testing and association with positivity among outpatients tested for SARS-CoV-2.PLoS One. 2021 Dec 10;16(12):e0260879. doi: 10.1371/journal.pone.0260879. eCollection 2021. PLoS One. 2021. PMID: 34890441 Free PMC article.
-
SARS-CoV-2 infection following booster vaccination: Illness and symptom profile in a prospective, observational community-based case-control study.J Infect. 2023 Dec;87(6):506-515. doi: 10.1016/j.jinf.2023.08.009. Epub 2023 Sep 28. J Infect. 2023. PMID: 37777159
-
Signs and symptoms to determine if a patient presenting in primary care or hospital outpatient settings has COVID-19.Cochrane Database Syst Rev. 2021 Feb 23;2(2):CD013665. doi: 10.1002/14651858.CD013665.pub2. Cochrane Database Syst Rev. 2021. Update in: Cochrane Database Syst Rev. 2022 May 20;5:CD013665. doi: 10.1002/14651858.CD013665.pub3. PMID: 33620086 Free PMC article. Updated.
-
Universal screening for SARS-CoV-2 infection: a rapid review.Cochrane Database Syst Rev. 2020 Sep 15;9(9):CD013718. doi: 10.1002/14651858.CD013718. Cochrane Database Syst Rev. 2020. PMID: 33502003 Free PMC article.
Cited by
-
Coronavirus-two infection among adults: A scoping review of literature published in 2023-24.Pak J Med Sci. 2025 Jun;41(6):1788-1798. doi: 10.12669/pjms.41.6.12201. Pak J Med Sci. 2025. PMID: 40621515 Free PMC article. Review.
References
-
- Ministry of Health, Labour and Welfare. 2023. Visualizing the data: information on COVID-19 infections. Ministry of Health, Labour and Welfare, Tokyo, Japan. https://covid19.mhlw.go.jp/en/. 2023. Accessed 31 Oct 2023.
-
- Our World in Data. https://ourworldindata.org/. 2023. Accessed 31 Oct 2023.
Publication types
MeSH terms
LinkOut - more resources
Full Text Sources
Medical
