

Predicting outcome after aneurysmal subarachnoid hemorrhage by exploitation of signal complexity: a prospective two-center cohort study
- PMID: 38745319
- PMCID: PMC11092006
- DOI: 10.1186/s13054-024-04939-7
Predicting outcome after aneurysmal subarachnoid hemorrhage by exploitation of signal complexity: a prospective two-center cohort study
Abstract
Background: Signal complexity (i.e. entropy) describes the level of order within a system. Low physiological signal complexity predicts unfavorable outcome in a variety of diseases and is assumed to reflect increased rigidity of the cardio/cerebrovascular system leading to (or reflecting) autoregulation failure. Aneurysmal subarachnoid hemorrhage (aSAH) is followed by a cascade of complex systemic and cerebral sequelae. In aSAH, the value of entropy has not been established yet.
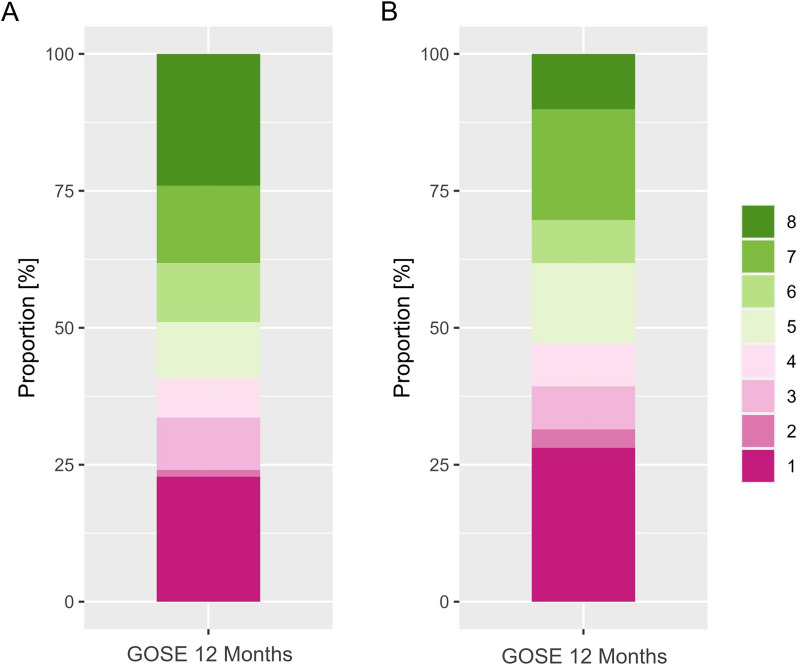
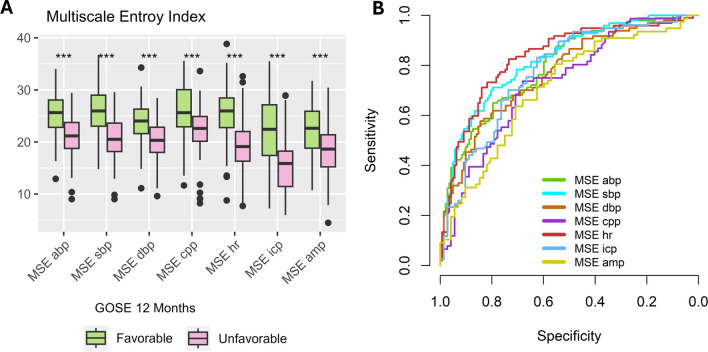
Methods: aSAH patients from 2 prospective cohorts (Zurich-derivation cohort, Aachen-validation cohort) were included. Multiscale Entropy (MSE) was estimated for arterial blood pressure, intracranial pressure, heart rate, and their derivatives, and compared to dichotomized (1-4 vs. 5-8) or ordinal outcome (GOSE-extended Glasgow Outcome Scale) at 12 months using uni- and multivariable (adjusted for age, World Federation of Neurological Surgeons grade, modified Fisher (mFisher) grade, delayed cerebral infarction), and ordinal methods (proportional odds logistic regression/sliding dichotomy). The multivariable logistic regression models were validated internally using bootstrapping and externally by assessing the calibration and discrimination.
Results: A total of 330 (derivation: 241, validation: 89) aSAH patients were analyzed. Decreasing MSE was associated with a higher likelihood of unfavorable outcome independent of covariates and analysis method. The multivariable adjusted logistic regression models were well calibrated and only showed a slight decrease in discrimination when assessed in the validation cohort. The ordinal analysis revealed its effect to be linear. MSE remained valid when adjusting the outcome definition against the initial severity.
Conclusions: MSE metrics and thereby complexity of physiological signals are independent, internally and externally valid predictors of 12-month outcome. Incorporating high-frequency physiological data as part of clinical outcome prediction may enable precise, individualized outcome prediction. The results of this study warrant further investigation into the cause of the resulting complexity as well as its association to important and potentially preventable complications including vasospasm and delayed cerebral ischemia.
Keywords: Complexity; Multiscale entropy; Outcome; Subarachnoid hemorrhage.
© 2024. The Author(s).
Conflict of interest statement
PS declares financial interest in part of the licensing fees for ICM + , used in this study for data analysis. The other authors declare no financial or non-financial conflicts of interest.
Figures

References
-
- Muroi C, Hugelshofer M, Seule M, Tastan I, Fujioka M, Mishima K, Keller EJN. Correlation among systemic inflammatory parameter, occurrence of delayed neurological deficits, and outcome after aneurysmal subarachnoid hemorrhage. Neurosurgery. 2013;72(3):367–375. doi: 10.1227/NEU.0b013e31828048ce. - DOI - PubMed
Publication types
MeSH terms
Grants and funding
LinkOut - more resources
Full Text Sources
