. 2024 May 14;21(1):129.
doi: 10.1186/s12974-024-03080-0.

Western diet increases brain metabolism and adaptive immune responses in a mouse model of amyloidosis

Affiliations

Western diet increases brain metabolism and adaptive immune responses in a mouse model of amyloidosis

Marilena Poxleitner et al. J Neuroinflammation. .

Abstract

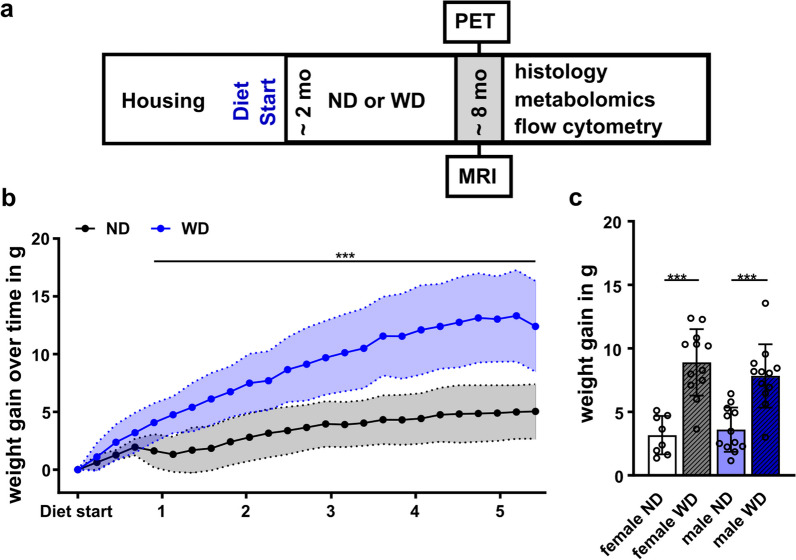
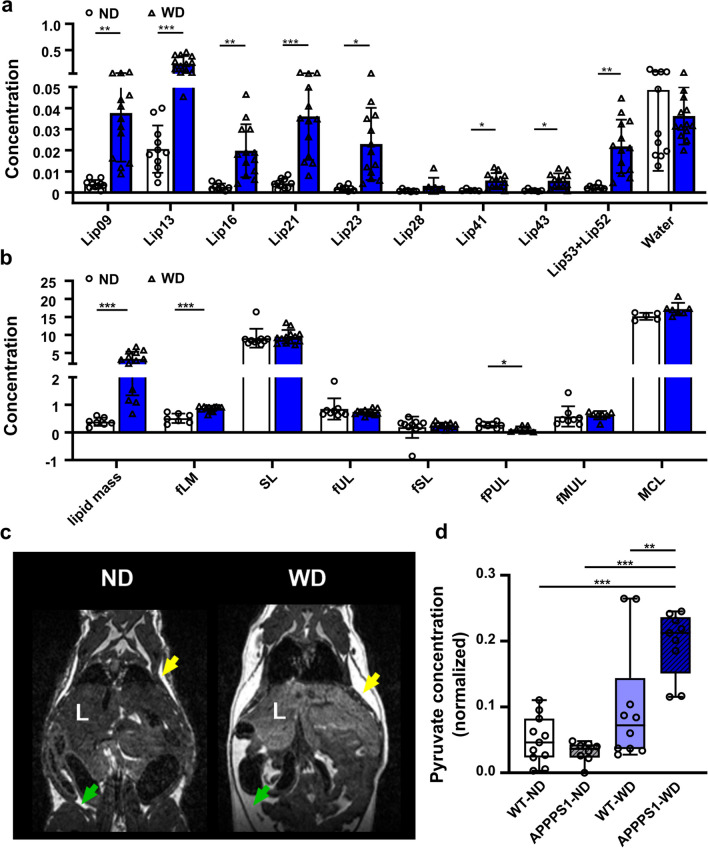
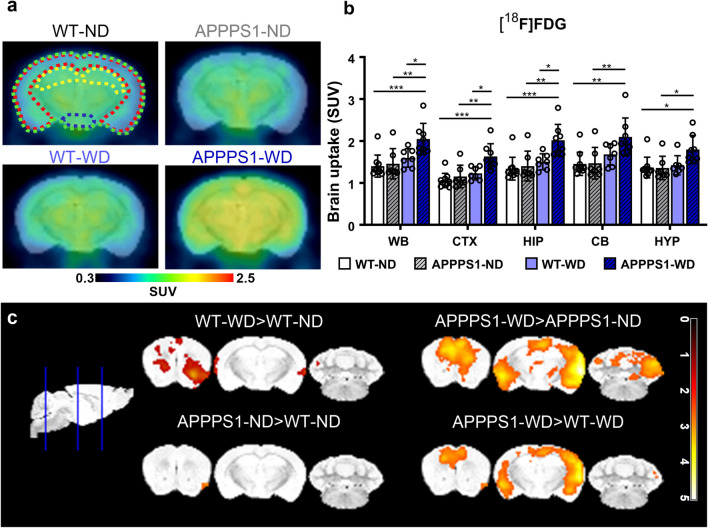
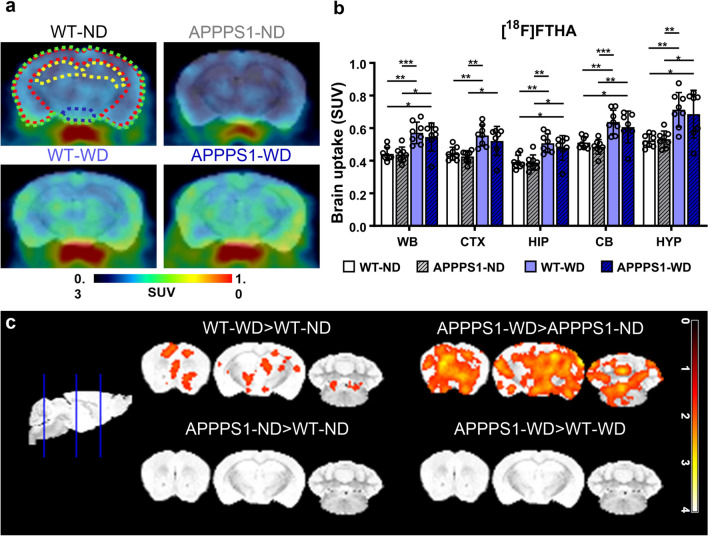
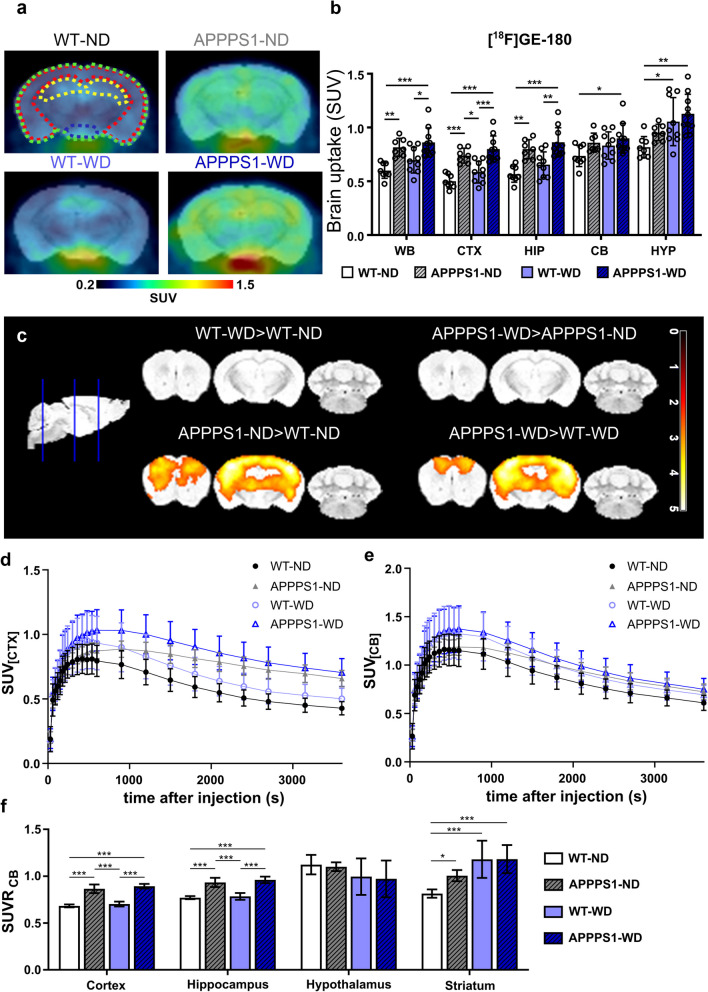
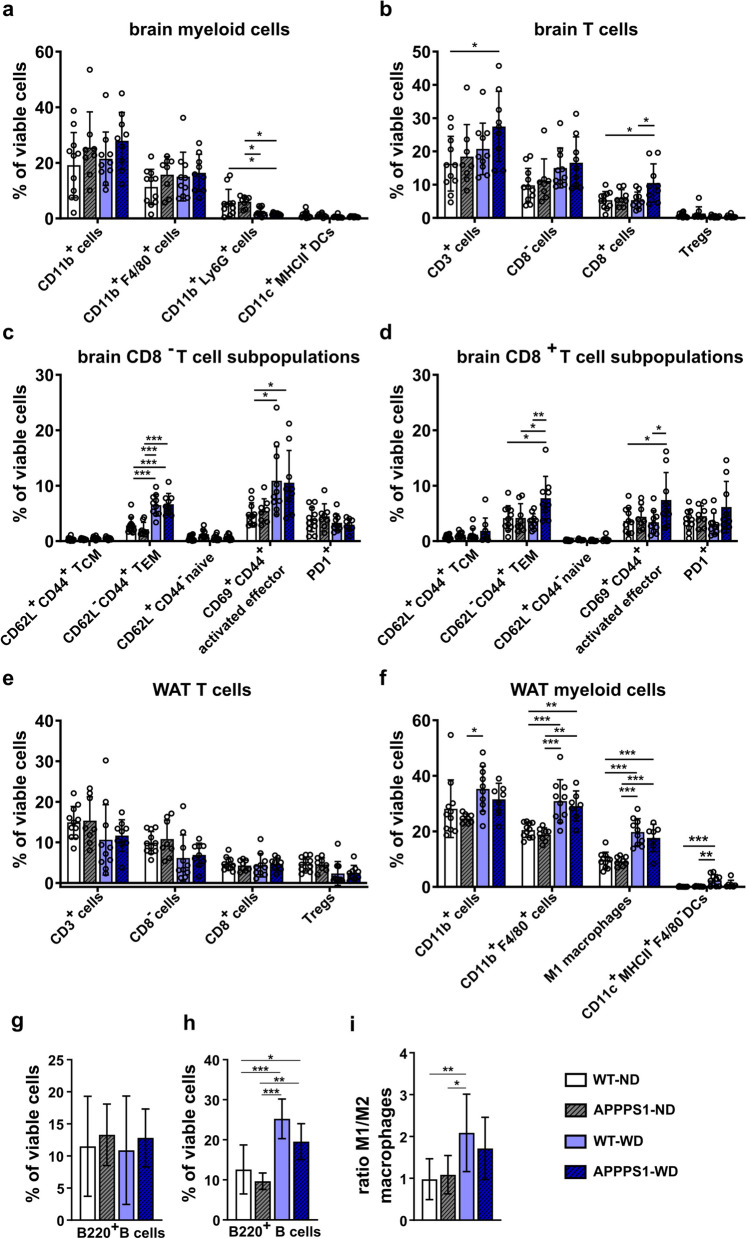
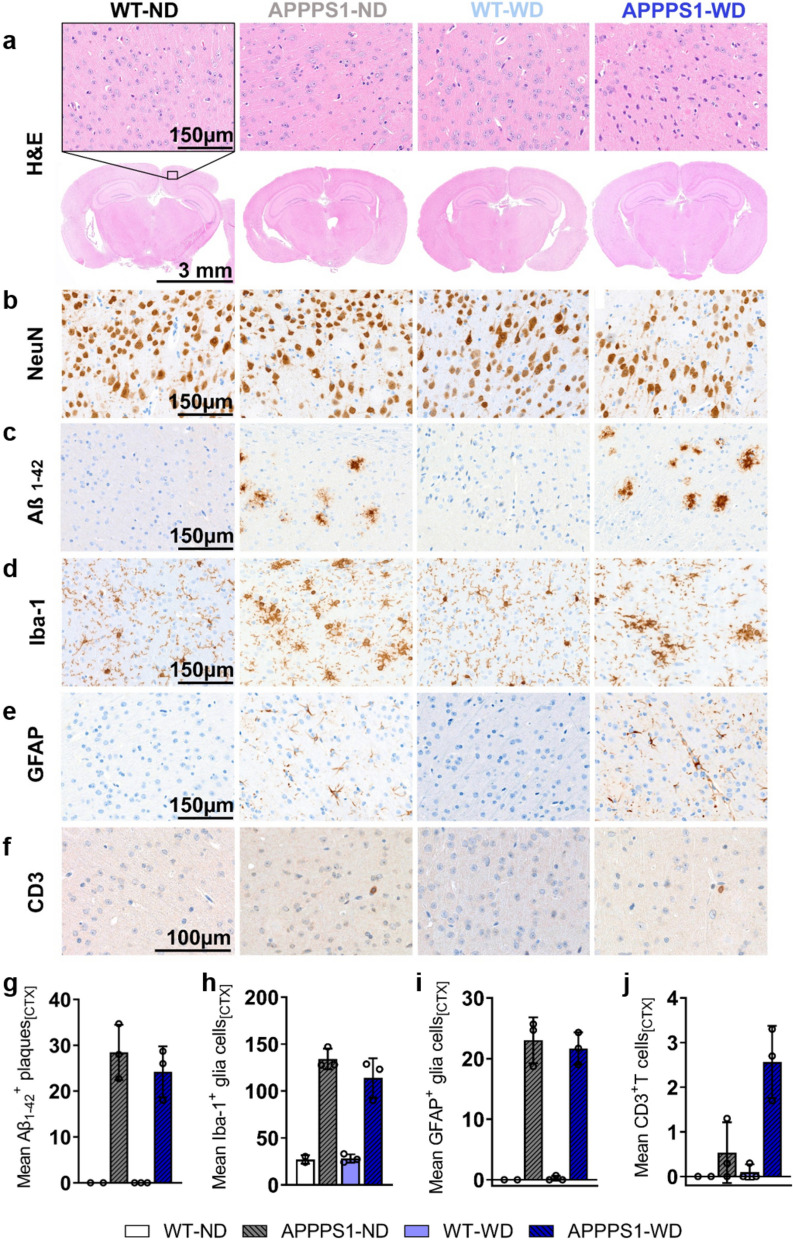
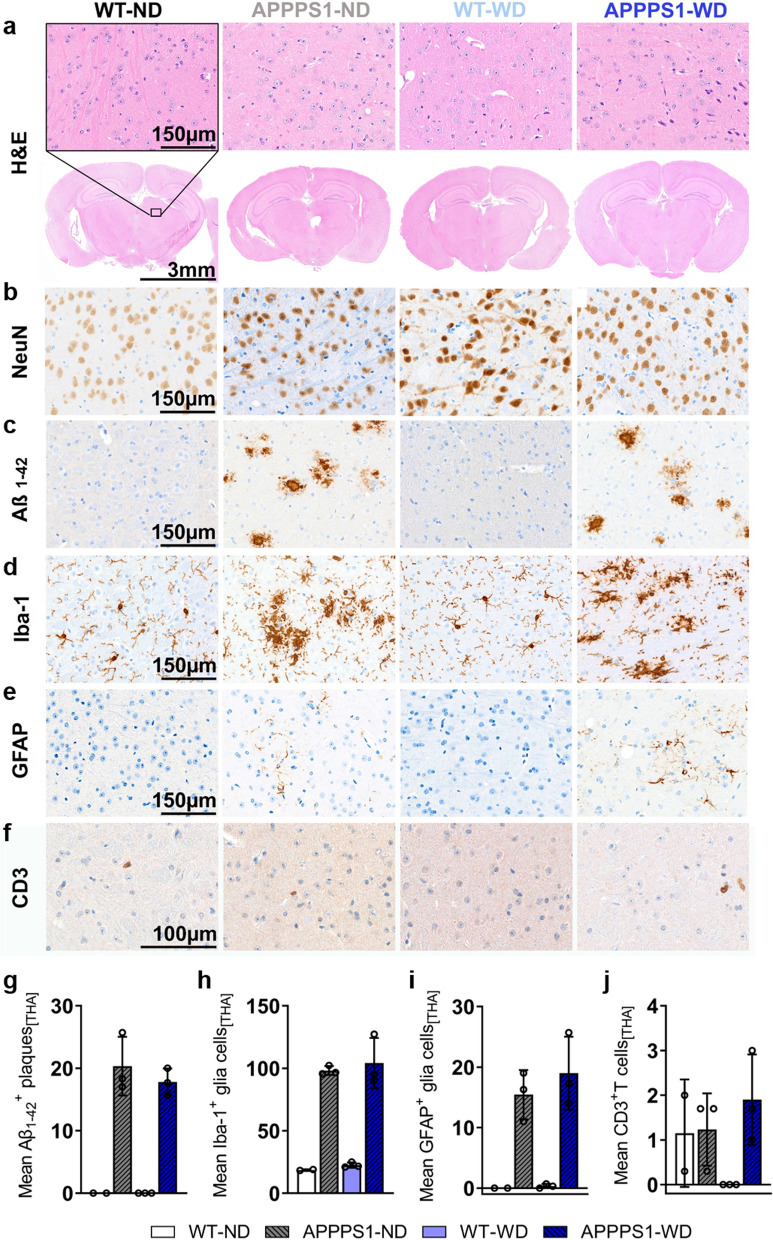
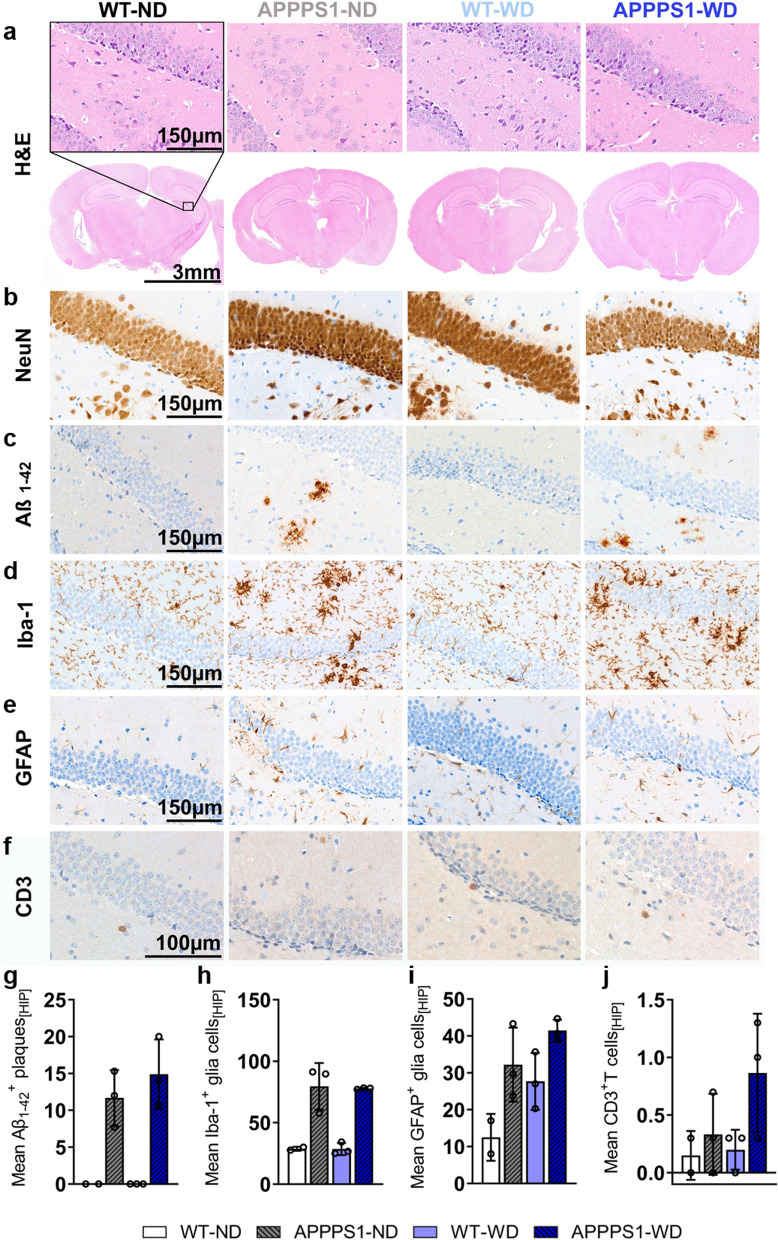
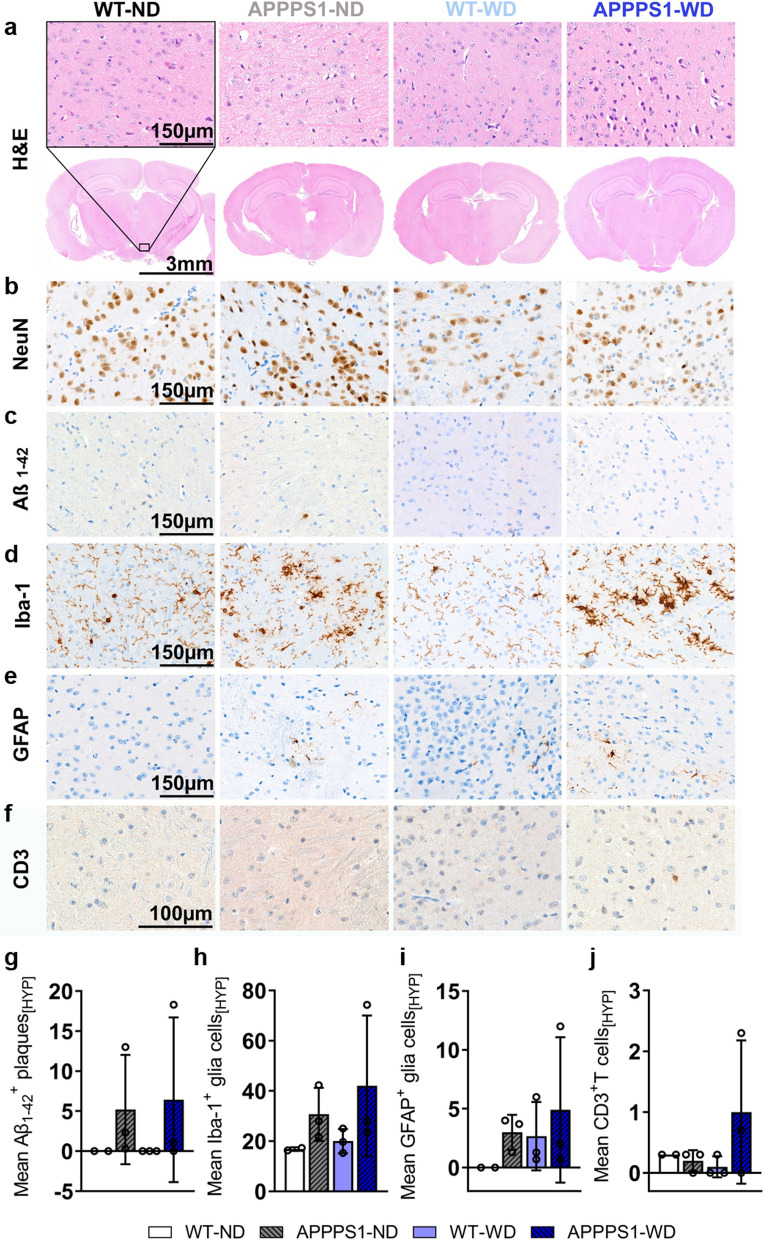
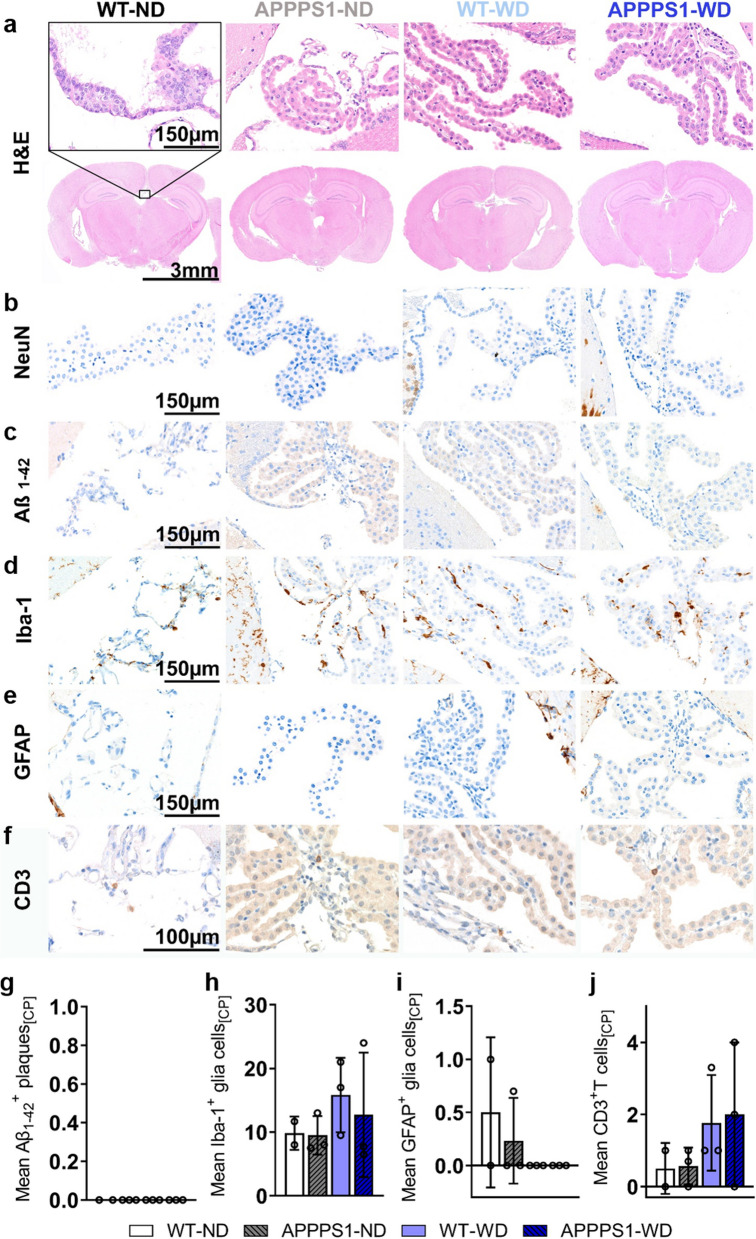
Diet-induced increase in body weight is a growing health concern worldwide. Often accompanied by a low-grade metabolic inflammation that changes systemic functions, diet-induced alterations may contribute to neurodegenerative disorder progression as well. This study aims to non-invasively investigate diet-induced metabolic and inflammatory effects in the brain of an APPPS1 mouse model of Alzheimer's disease. [18F]FDG, [18F]FTHA, and [18F]GE-180 were used for in vivo PET imaging in wild-type and APPPS1 mice. Ex vivo flow cytometry and histology in brains complemented the in vivo findings. 1H- magnetic resonance spectroscopy in the liver, plasma metabolomics and flow cytometry of the white adipose tissue were used to confirm metaflammatory condition in the periphery. We found disrupted glucose and fatty acid metabolism after Western diet consumption, with only small regional changes in glial-dependent neuroinflammation in the brains of APPPS1 mice. Further ex vivo investigations revealed cytotoxic T cell involvement in the brains of Western diet-fed mice and a disrupted plasma metabolome. 1H-magentic resonance spectroscopy and immunological results revealed diet-dependent inflammatory-like misbalance in livers and fatty tissue. Our multimodal imaging study highlights the role of the brain-liver-fat axis and the adaptive immune system in the disruption of brain homeostasis in amyloid models of Alzheimer's disease.

Keywords: 1H spectroscopy; APPPS1; Alzheimer’s disease; Flow cytometry; Metabolomics; PET imaging; Western diet; [18F]FDG; [18F]FTHA; [18F]GE-180.


Conflict of interest statement

C.T. and G. B. report a research grant by Bruker BioSpin GmbH, Ettlingen, Germany.

Figures

Fig. 1
Fig. 1
Study design and weight. a General study design of in vivo and ex vivo experiments. Western diet (WD) or the normal rodent diet (ND) feeding period started at 2 months of age and continued over 24 weeks. At ~ 8 months, imaging (PET, MRI), flow cytometry, metabolomics, and histology were performed. b Mean weight gain ± SD between ND-fed (black) and WD-fed (blue) animals over 24 weeks starting on the day of the diet change. c Mean weight gain between females and males fed an ND (blank white, blue) or WD (striped grey, blue). ***p < 0.001. Weight gain over time using student's t-test. Comparison of sex and diet with two-way ANOVA, post hoc Tukey corrected for multiple comparisons. ND, normal rodent diet; WD, western diet; WD (n = 24, male = 12, female = 12), ND (n = 20, male = 11, female = 9)
Fig. 2
Fig. 2
MR-based lipid analysis and metabolomics. 1H MRS of hepatic lipid composition and metabolomic results between ND and WD-fed animals. a single lipids are depicted according to their chemical shift, indicating changes between ND (white, circles)- and WD-fed animals (blue, triangles). b Calculated lipid compositions using the single lipid peaks. c Exemplary contrast-normalized T2-weighted images illustrating fat depots in ND- and WD-fed mice. Subcutaneous fat is marked with yellow arrows; abdominal fat is marked with green arrows. d Box plot of pyruvate changes between the four mice groups. where the following components are defined: center line, median; box limits, 25–75 percentiles; whiskers, minimum to maximum; and all points are shown. WT-ND n = 11 (male = 7, female = 4), APPPS1-ND n = 8 (male = 4, female = 4), WT-WD n = 10 (male = 4, female = 6), APPPS1-WD n = 9 (male = 4, female = 5). 1H MRS results were analyzed using multiple unpaired t-tests with post hoc multiple comparison corrections using the Holm-Sidak method (p-value threshold set to α = 0.05). Metabolomics with two-way ANOVA, post hoc Holm-Sidak correction for multiple comparisons. fLM, fractional lipid mass; SL, saturated lipid component; fUL,  fraction of unsaturated lipids; fSL,  fraction of saturated lipids; fPUL,  fraction of polyunsaturated lipids; fMUL,  fraction of monounsaturated lipids; L,  liver; Statistical significance: *p < 0.05, **p < 0.01, ***p < 0.001
Fig. 3
Fig. 3
[18F]FDG-PET imaging. a Comparison of axial brain images of [18F]FDG uptake in all four groups indicates a higher uptake in APPPS1-WD mice. Regions are indicated as follows: green = WB; red = CTX; yellow = HIP; blue = HYP. b mean SUV (30–60 min p.i.) in WB, CTX, HIP, CB, and HYP between all groups. c T-maps comparing SUVs are shown with threshold p < 0.01. Individual data points are shown and displayed with mean and SD. WT-ND n = 10 (male = 6, female = 4), APPPS1-ND n = 7 (male = 3, female = 4), WT-WD n = 7 (male = 4, female = 3), APPPS1-WD n = 8 (male = 5, female = 3). *p < 0.05, **p < 0.01, ***p < 0.001, post hoc Holm-Sidak corrected for multiple comparisons; WB, whole brain; CTX, cortex; HIP, hippocampus; CB, cerebellum; HYP, hypothalamus
Fig. 4
Fig. 4
[18F]FTHA-PET imaging. a Exemplary axial brain images of [18F]FTHA uptake display higher uptake in WD-fed mice irrespective of genotype. Regions are indicated as follows: green = WB; red = CTX; yellow = HIP; blue = HYP. b Mean SUVs (30–60 min p.i.) in WB, CTX, HIP, CB, and HYP for [18F]FTHA. c Comparison of voxel-wise analysis. The threshold was set to p < 0.05. Individual data points are shown and displayed with mean and SD. WT-ND n = 8 (male = 5, female = 3), APPPS1-ND n = 8 (male = 4, female = 4), WT-WD n = 8 (male = 5, female = 3), APPPS1-WD n = 7 (male = 4, female = 3). *p < 0.05, **p < 0.01, ***p < 0.001, post hoc Holm-Sidak corrected for multiple comparisons; WB, whole brain; CTX, cortex; HIP, hippocampus; CB, cerebellum; HYP , hypothalamus
Fig. 5
Fig. 5
[18F]GE-180-PET imaging. a Higher uptake of [18F]GE-180 in APPPS1 mice compared to WT shown in representative axial brain images. Colored outlines illustrate the analyzed brain regions green = WB; red = CTX; yellow = HIP; blue = HYP. b Mean SUVs (30–60 min p.i.) in WB, CTX, HIP, CB, and HYP for [18F]GE-180 in all groups. c Representative images of voxel-wise analyzed SUVs are shown with threshold p < 0.01. Individual data points are shown and displayed with mean and SD. WT-ND n = 8 (male = 5, female = 3), APPPS1-ND n = 7 (male = 3, female = 4), WT-WD n = 9 (male = 5, female = 4), APPPS1-WD n = 10 (male = 5, female = 5). *p < 0.05, **p < 0.01, ***p < 0.001; post hoc Holm-Sidak corrected for multiple comparisons; WB,   whole brain; CTX, cortex; HIP, hippocampus; CB, cerebellum; HYP, hypothalamus
Fig. 6
Fig. 6
Immune cell analysis of brain and WAT. Brain and WAT immune cell population displayed as the % of viable cells. a Brain myeloid cells show only minor changes. b CD3+ T cells and CD8+ T cells are significantly higher in APPPS1-WD mice compared to non-treated WT animals. c CD8 T cell subpopulations reveal higher effector memory T cells (TEM) and higher activated effector T cells in WD groups. d CD8+ T cell populations show higher effector memory and activated effector T cell phenotype, but only in APPPS-WD animals. e WAT myeloid cell population displays significantly higher CD11b+F4/80+ macrophages, inflammatory M1 macrophages (CD11b+F4/80+CD11c+), and CD11c+MHCII+ DCs in WD-fed groups. f T cell populations in WAT reveal no differences between groups. g Flow cytometry results show no changed B cell populations in the brain, but h significantly elevated in WAT of WD-fed mice. M1/M2 ratio is higher in WD-WAT (i). Results in mean ± SD; *p < 0.05, **p < 0.01, ***p < 0.001, post hoc Holm-Sidak corrected for multiple comparisons; Brain (a-d; g): WT-ND n = 11 (male = 7, female = 4), APPPS1-ND n = 8 (male = 4, female = 4), WT-WD n = 10 (male = 6, female = 4), APPPS1-WD n = 9 (male = 5, female = 4). WAT (e; f; i): WT-ND n = 11 (male = 7, female = 4), APPPS1-ND n = 8 (male = 4, female = 4), WT-WD n = 10 (male = 6, female = 4), APPPS1-WD n = 7 (male = 3, female = 4). *p < 0.05, **p < 0.01, ***p < 0.001. DC,  dendritic cells; TCM,  central memory T cells; TEM = effector memory T cells; Tregs = regulatory T cells
Fig. 7
Fig. 7
Histological analysis—cortex. Histological staining results are depicted in representative images per group per staining staining for cortices of all groups. a H&E staining between groups as overview (Scale bar 3 mm) and magnification (Scale bar 150 µm). The black rectangular depicts magnification area. b NeuN staining reveals no differences between groups. c Amyloid plaques stained specifically with Aβ1-42 antibody were visible in APPPS1 animals (Scale bar 150 µm). d Microglia staining using Iba-1 as a marker shows a ramified/resting phenotype in WT brains, whereas activated amoeboid phenotype of microglia in transgenic AD animals was observed (Scale bar 150 µm). e GFAP staining shows reactive astrocytes in APPPS1 animals in CTX. No GFAP + cells were found in WT animals (Scale bar 150 µm). f CD3+ staining revealed T cells in APPPS1 cortices (Scale bar 100 µm). g Mean ± SD Aβ1-42 positive plaques in cortices show plaque load in transgenic mice but no difference between diets. h Mean ± SD Iba-1+ cells are elevated in APPPS1 cortices independent of the diet. i No mean ± SD GFAP+ cells in WT mice, but elevated diet-independently in APPPS1 mice. j Higher mean ± SD CD3 positive T cells in APPPS1-WD group compared to the other groups. CTX = cortex; HIP = hippocampus; HYP = hypothalamus. WT-ND n = 2; APPPS1-ND n = 3; WT-WD n = 3; APPPS1-WD n = 3
Fig. 8
Fig. 8
Histological analysis—Thalamus. Histological staining results are depicted in representative images per group per staining for the thalamus (THA) in all groups. a H&E staining between groups as overview (Scale bar 3 mm) and magnification (Scale bar 150 µm). The black rectangular depicts magnification area. b No difference in NeuN+ cells between groups. c1-42 positive plaques were visible in APPPS1 animals (Scale bar 150 µm). d Microglia staining using Iba-1. Ramified/resting phenotype in WT brains and activated amoeboid phenotype of microglia in transgenic AD animals was observed. (Scale bar 150 µm). e GFAP+ cells in APPPS1 animals in THA. No GFAP + cells were found in WT animals. (Scale bar 150 µm). f CD3+ T cells observed in WT-ND and APPPS1 ND and WD (Scale bar 100 µm). g Mean ± SD Aβ1-42 positive plaques load in THA in transgenic mice. h Mean ± SD Iba-1+ cells are elevated in APPPS1 animals. i No mean ± SD GFAP+ cells in WT mice, but elevated in APPPS1 mice. j Similar mean ± SD CD3 positive T cells in WT-ND, APPPS1-ND and APPPS1-WD group. THA = thalamus. WT-ND n = 2; APPPS1-ND n = 3; WT-WD n = 3; APPPS1-WD n = 3
Fig. 9
Fig. 9
Histological analysis—Hippocampus. Histological staining results are depicted in representative images per group per staining for the hippocampus (HIP) in all groups. a H&E staining between groups as overview (Scale bar 3 mm) and magnification (Scale bar 150 µm). The black rectangular depicts magnification area. b No difference in NeuN+ cells between groups. c1-42 positive plaques were visible in APPPS1 animals (Scale bar 150 µm). d Microglia staining using Iba-1. Ramified/resting phenotype in WT brains and activated amoeboid phenotype of microglia in transgenic AD animals was observed. (Scale bar 150 µm). e GFAP+ cells in HIP of APPPS1 animals and WT-WD. (Scale bar 150 µm). f CD3+ T cells observed mainly in APPPS1 hippocampi (Scale bar 100 µm). g Mean ± SD Aβ1-42 positive plaques load in HIP in transgenic mice. h Mean ± SD Iba-1+ cells were elevated in APPPS1 animals. i Mean ± SD GFAP+ cells elevated in WT-WD and in APPPS1 mice. j S Higher mean ± SD CD3 positive T cells in APPPS1-WD group compared to the other groups. HIP = hippocampus. WT-ND n = 2; APPPS1-ND n = 3; WT-WD n = 3; APPPS1-WD n = 3
Fig. 10
Fig. 10
Histological analysis – Hypothalamus. Histological staining results are depicted in representative images per group per staining for the hypothalamus (HYP) in all groups. a H&E staining between groups as overview (Scale bar 3 mm) and magnification (Scale bar 150 µm). The black rectangular depicts magnification area. b No difference in NeuN+ cells between groups. c Only a few Aβ1-42 positive plaques were visible in APPPS1 animals with high variance between specimens (Scale bar 150 µm). d Microglia staining using Iba-1. Ramified/resting phenotype in WT brains and activated amoeboid phenotype of microglia in transgenic AD animals was observed. (Scale bar 150 µm) e GFAP+ cells in HYP of APPPS1 animals and WT-WD. (Scale bar 150 µm). f CD3+ T cells observed mainly in APPPS1-WD (Scale bar 100 µm). (g) Mean ± SD Aβ1-42 positive plaques load in HYP in transgenic mice. (h) Mean ± SD Iba-1+ cells were elevated in APPPS1 animals. i Mean ± SD GFAP+ cells elevated in WT-WD and in APPPS1 mice, however with high variance between animals. j S Higher mean ± SD CD3 positive T cells in APPPS1-WD group compared to the other groups. HYP = hypothalamus. WT-ND n = 2; APPPS1-ND n = 3; WT-WD n = 3; APPPS1-WD n = 3
Fig. 11
Fig. 11
Histological analysis—Choroid plexus. Histological staining results are depicted in representative images per group per staining for the choroid plexus (CP) in all groups. a H&E staining between groups as overview (Scale bar 3 mm) and magnification (Scale bar 150 µm). The black rectangular depicts magnification area. b No NeuN+ cells were observed. c No Aβ1-42 positive plaques were visible in all animals (Scale bar 150 µm). d Microglia staining using Iba-1 (Scale bar 150 µm). e GFAP+ cells in CP (Scale bar 150 µm). f CD3+ T cells observed in all groups (Scale bar 100 µm). g No Aβ1-42 positive plaques were detected in CP. h Mean ± SD Iba-1+ cells were elevated in APPPS1 animals. i Mean ± SD GFAP+ cells elevated in ND groups. j Tendencies of higher mean ± SD CD3 positive T cells in WD group compared to the other groups. CP = choroid plexus. WT-ND n = 2; APPPS1-ND n = 3; WT-WD n = 3; APPPS1-WD n = 3

References

    1. Obesity and overweight fact sheets. 2021.
    1. Whitmer RA, Gunderson EP, Barrett-Connor E, Quesenberry CP, Jr, Yaffe K. Obesity in middle age and future risk of dementia: a 27 year longitudinal population based study. BMJ. 2005;330(7504):1360. doi: 10.1136/bmj.38446.466238.E0. - DOI - PMC - PubMed
    1. Hassing LB, Dahl AK, Pedersen NL, Johansson B. Overweight in midlife is related to lower cognitive function 30 years later: a prospective study with longitudinal assessments. Dement Geriatr Cogn Disord. 2010;29(6):543–552. doi: 10.1159/000314874. - DOI - PMC - PubMed
    1. Hassing LB, Dahl AK, Thorvaldsson V, Berg S, Gatz M, Pedersen NL, et al. Overweight in midlife and risk of dementia: a 40-year follow-up study. Int J Obes (Lond) 2009;33(8):893–898. doi: 10.1038/ijo.2009.104. - DOI - PMC - PubMed
    1. Xu WL, Atti AR, Gatz M, Pedersen NL, Johansson B, Fratiglioni L. Midlife overweight and obesity increase late-life dementia risk: a population-based twin study. Neurology. 2011;76(18):1568–1574. doi: 10.1212/WNL.0b013e3182190d09. - DOI - PMC - PubMed

LinkOut - more resources