. 2024 Apr 29:15:1388361.
doi: 10.3389/fendo.2024.1388361. eCollection 2024.

Induction of diabetes by Tacrolimus in a phenotypic model of obesity and metabolic syndrome

Affiliations

Induction of diabetes by Tacrolimus in a phenotypic model of obesity and metabolic syndrome

Silvia Teixidó-Trujillo et al. Front Endocrinol (Lausanne). .

Abstract

Introduction: The pathogenesis of Post-Transplant Diabetes Mellitus (PTDM) is complex and multifactorial and it resembles that of Type-2 Diabetes Mellitus (T2DM). One risk factor specific to PTDM differentiates both entities: the use of immunosuppressive therapy. Specifically, Tacrolimus interacts with obesity and insulin resistance (IR) in accelerating the onset of PTDM. In a genotypic model of IR, the obese Zucker rats, Tacrolimus is highly diabetogenic by promoting the same changes in beta-cell already modified by IR. Nevertheless, genotypic animal models have their limitations and may not resemble the real pathophysiology of diabetes. In this study, we have evaluated the interaction between beta-cell damage and Tacrolimus in a non-genotypic animal model of obesity and metabolic syndrome.

Methods: Sprague Dawley rats were fed a high-fat enriched diet during 45 days to induce obesity and metabolic dysregulation. On top of this established obesity, the administration of Tacrolimus (1mg/kg/day) during 15 days induced severe hyperglycaemia and changes in morphological and structural characteristics of the pancreas.

Results: Obese animals administered with Tacrolimus showed increased size of islets of Langerhans and reduced beta-cell proliferation without changes in apoptosis. There were also changes in beta-cell nuclear factors such as a decrease in nuclear expression of MafA and a nuclear overexpression of FoxO1A, PDX-1 and NeuroD1. These animals also showed increased levels of pancreatic insulin and glucagon.

Discussion: This model could be evidence of the relationship between the T2DM and PTDM physiopathology and, eventually, the model may be instrumental to study the pathogenesis of T2DM.

Keywords: Tacrolimus; animal model; metabolic syndrome; obesity; post-transplant diabetes; type 2 diabetes.


Conflict of interest statement

The authors declare that the research was conducted in the absence of any commercial or financial relationships that could be construed as a potential conflict of interest.

Figures

Figure 1
Figure 1
Metabolic characteristic of Sprague Dawley rats after 45 days of HFD or SD feeding. (A) Animal weight increased during all of the experiment (a – HFD animal vs. SD animal p ≤ 0.0081). (B) Intra-peritoneal glucose tolerance test (IPGTT) after 45 days on HFD or SD (C) Insulin tolerance test (ITT) after 45 days on HFD or SD.
Figure 2
Figure 2
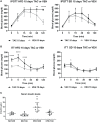
Metabolic characteristic of Sprague Dawley rats after 45 days on HFD or SD feeding and 15 days on TAC or VEH administration. (A) Intra-peritoneal glucose tolerance test of HFD and SD group at 15 days of TAC or VEH treatment (120 min glycaemia HFD+TAC vs. HFD+VEH p ≤ 0.0001). (B) Insulin tolerance test of HFD and SD group at 15 days of TAC or VEH treatment (0 min glycaemia HFD+TAC vs. HFD+VEH p ≤ 0.0001). (C) Serum insulin levels at endpoint (HFD+VEH vs. HFD+TAC, SD+TAC, SD+VEH p ≤ 0.0026).* - HFD+TAC vs. HFD+VEH (p≤ 0.005), ** - HFD+TAC vs. HFD+VEH (p≤ 0.0026), **** - HFD+TAC vs. HFD+VEH (p≤ 0.0001).
Figure 3
Figure 3
Forkhead box protein O1 (FoxO1) expression by immunofluorescence staining of Langerhans islets of pancreatic tissue and quantitative analysis. There was a marked increase in the expression of nuclear forkhead box protein O1 (FoxO1) of beta cells in pancreas of both HFD+TAC and HFD+VEH group. Data are expressed as mean plus or minus standard deviation. White arrows point the lack of expression of nuclear FoxO1 in SD+TAC and the overexpression in HFD+TAC (a - HFD+TAC vs. HFD+VEH p ≤ 0.0001; HFD+TAC vs. SD+TAC p ≤ 0.0001; HFD+TAC vs. SD+VEH p ≤ 0.0001; b - HFD+VEH vs. SD+VEH p ≤ 0.0045).
Figure 4
Figure 4
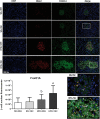
Pancreatic and duodenal homeobox (PDX-1) expression by immunofluorescence staining of Langerhans islets of pancreatic tissue and quantitative analysis. There was a marked increase in the expression of nuclear pancreatic and duodenal homeobox 1 (PDX-1) of beta cells in pancreas of both HFD+TAC and HFD+VEH group. Data are expressed as mean plus or minus standard deviation. White arrows point the lack of expression of nuclear PDX-1 in SD+TAC and the overexpression in HFD+TAC (a - HFD+TAC vs. HFD+VEH p ≤ 0.0066; HFD+TAC vs. SD+TAC p ≤ 0.0001; HFD+TAC vs. SD+VEH p ≤ 0.0001; b - HFD+VEH vs. SD+VEH p ≤ 0.0001; HFD+VEH vs. SD+TAC p ≤ 0.0001).
Figure 5
Figure 5
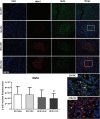
Neuronal differentiation 1 (NeuroD1) expression by immunofluorescence staining of Langerhans islets of pancreatic tissue and quantitative analysis. There was a marked increase in the expression of nuclear neuronal differentiation 1 (NeuroD1) of beta cells in pancreas of both HFD+TAC and HFD+VEH group. Data are expressed as mean plus or minus standard deviation. White arrows point the lack of expression of nuclear NeuroD1 in SD+TAC and the overexpression in HFD+TAC (a - HFD+TAC vs. HFD+VEH p ≤ 0.01; HFD+TAC vs. SD+TAC p ≤ 0.0001; HFD+TAC vs. SD+VEH p ≤ 0.0001; b - HFD+VEH vs. SD+VEH p ≤ 0.0042).
Figure 6
Figure 6
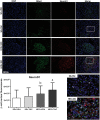
V-maf musculoaponeurotic fibrosarcoma oncogene homolog A (MafA) nuclear expression by immunofluorescence staining of Langerhans islets of pancreatic tissue and quantitative analysis. There was a clear decrease in nuclear v-maf musculoaponeurotic fibrosarcoma oncogene homolog A (MafA) of beta cells in pancreas of HFD+TAC group. Data are expressed as mean plus or minus standard deviation (a – HFD+TAC vs. SD+TAC p ≤ 0.04; HFD+TAC vs. SD+VEH p ≤ 0.02).
Figure 7
Figure 7
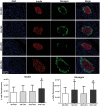
Immunofluorescence staining of insulin and glucagon in Langerhans islets of Sprague Dawley rat pancreatic tissue and quantitative analysis. There was an increase in insulin staining in HFD+TAC group. There was also an increase in glucagon staining related to an augment in alpha cells in the HFD+TAC and SD+TAC group. Data are expressed as mean plus or minus standard deviation (a – HFD+TAC vs. HFD+VEH p ≤ 0.0032; HFD+TAC vs. SD+TAC p ≤ 0.01; HFD+TAC vs. SD+VEH p ≤ 0.012; c – SD+TAC vs. SD+VEH p ≤ 0.04; SD+TAC vs. HFD+VEH p ≤ 0.0053; d – HFD+TAC vs. HFD+VEH p ≤ 0.0038; HFD+TAC vs. SD+VEH p ≤ 0.035).
Figure 8
Figure 8
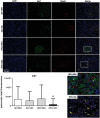
Ki67 expression by immunofluorescence staining of Langerhans islets of pancreatic tissue and quantitative analysis. There was a marked increase in the expression of ki67 in the HFD+VEH animals and a decrease in proliferation in islet of animals in HFD+TAC group. Data are expressed as mean plus or minus standard deviation. White arrows point the overexpression of Ki67 in HFD+VEH and the decreased expression in HFD+TAC (a – HFD+TAC vs. HFD+VEH p ≤ 0.0001; HFD+TAC vs. SD+TAC p ≤ 0.0072; HFD+TAC vs. SD+VEH p ≤ 0.0005).

References

    1. Rodriguez-Rodriguez AE, Triñanes J, Velazquez-Garcia S, Porrini E, Vega Prieto MJ, Diez Fuentes ML, et al. . The higher diabetogenic risk of tacrolimus depends on pre-existing insulin resistance. A study in obese and lean zucker rats. Am J Transplant. (2013) 13:1665–75. doi: 10.1111/ajt.12236 - DOI - PubMed
    1. Chowdhury TA. Post-transplant diabetes mellitus. Clin Med (Lond). (2019) 19:392–5. doi: 10.7861/clinmed.2019-0195 - DOI - PMC - PubMed
    1. Pham PT, Sarkar M, Pham PM, Pham PC. Diabetes mellitus after solid organ transplantation. (2000) South Dartmouth (MA): MDText.com. Available at: https://www.ncbi.nlm.nih.gov/books/NBK378977/.
    1. Quintana-Pérez J, García-Dolores F, Valdez-Guerrero A, Alemán-González-Duhart D, Arellano-Mendoza M, Rojas Hernández S, et al. . Modeling type 2 diabetes in rats by administering tacrolimus. Islets. (2022) 14:114–27. doi: 10.1080/19382014.2022.2051991 - DOI - PMC - PubMed
    1. Porrini EL, Díaz JM, Moreso F, Delgado Mallén PI, Silva Torres I, Ibernon M, et al. . Clinical evolution of post-transplant diabetes mellitus. Nephrol Dial Transplant. (2016) 31:495–505. doi: 10.1093/ndt/gfv368 - DOI - PubMed

MeSH terms