

Home Monitoring for Fever: An Inexpensive Screening Method to Prevent Household Spread of COVID-19
- PMID: 38745997
- PMCID: PMC11093523
- DOI: 10.26502/jbb.2642-91280101
Home Monitoring for Fever: An Inexpensive Screening Method to Prevent Household Spread of COVID-19
Abstract
The COVID-19 pandemic surge has exceeded testing capacities in many parts of the world. We investigated the effectiveness of home temperature monitoring for early identification of COVID-19 patients.
Study design –: We compared home temperature measurements from a convenience sample of 1180 individuals who reported being test positive for SARS-CoV-2 to an age, sex, and location matched control group of 1249 individuals who had not tested positive.
Methods –: All individuals monitored their temperature at home using an electronic smartphone thermometer that relayed temperature measurements and symptoms to a centralized cloud based, de-identified data bank.
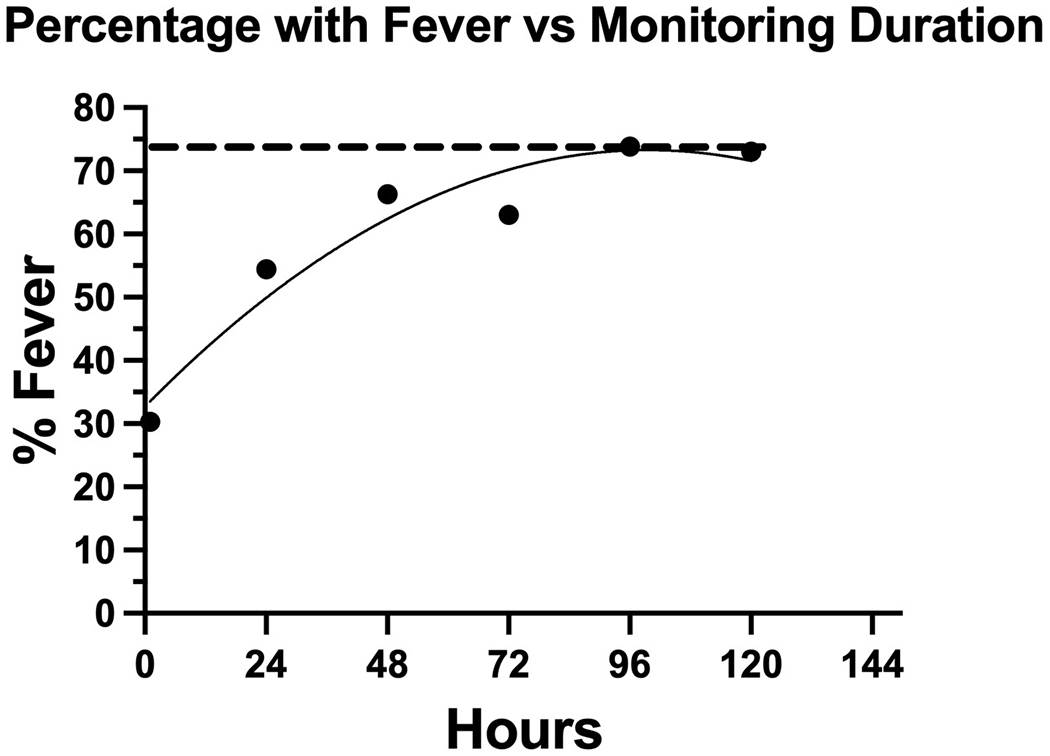
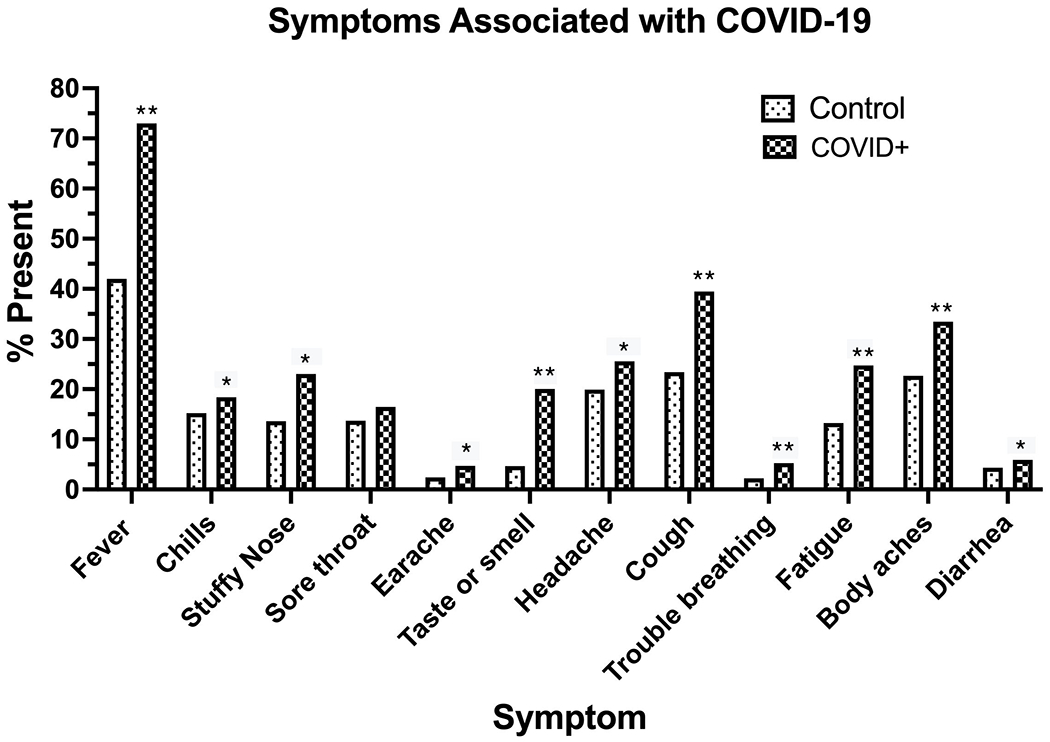
Results -: Individuals varied in the number of times they monitored their temperature. When temperature was monitored for over 72 hours fever (≥ 37.6°C or 99.7°F or a change in temperature of ≥ 1°C or 1.8°F) was detected in 73% of test positive individuals, a sensitivity comparable to rapid SARS-CoV-2 antigen tests. When compared to our control group the specificity of fever for COVID-19 was 0.70. However, when fever was combined with complaints of loss of taste and smell, difficulty breathing, fatigue, chills, diarrhea, or stuffy nose the odds ratio of having COVID-19 was sufficiently high as to obviate the need to employ RTPCR or antigen testing to screen for and isolate coronavirus infected cases.
Conclusions -: Our findings suggest that home temperature monitoring could serve as an inexpensive convenient screen for the onset of COVID-19, encourage earlier isolation of potentially infected individuals, and more effectively reduce the spread of infection in closed spaces.
Conflict of interest statement
Conflict of interest statements - The authors declare no conflicts of interest.
Figures

Similar articles
-
Effectiveness and cost-effectiveness of four different strategies for SARS-CoV-2 surveillance in the general population (CoV-Surv Study): a structured summary of a study protocol for a cluster-randomised, two-factorial controlled trial.Trials. 2021 Jan 8;22(1):39. doi: 10.1186/s13063-020-04982-z. Trials. 2021. PMID: 33419461 Free PMC article.
-
Virtualized clinical studies to assess the natural history and impact of gut microbiome modulation in non-hospitalized patients with mild to moderate COVID-19 a randomized, open-label, prospective study with a parallel group study evaluating the physiologic effects of KB109 on gut microbiota structure and function: a structured summary of a study protocol for a randomized controlled study.Trials. 2021 Apr 2;22(1):245. doi: 10.1186/s13063-021-05157-0. Trials. 2021. PMID: 33810796 Free PMC article.
-
Universal screening for SARS-CoV-2 infection: a rapid review.Cochrane Database Syst Rev. 2020 Sep 15;9(9):CD013718. doi: 10.1002/14651858.CD013718. Cochrane Database Syst Rev. 2020. PMID: 33502003 Free PMC article.
-
Evaluation of the Rapid Antigen Detection Test for Diagnosing SARS-CoV-2 during the COVID-19 Pandemic: Experience from a Centralized Isolation Site in Shanghai, China.Microbiol Spectr. 2023 Feb 14;11(1):e0454222. doi: 10.1128/spectrum.04542-22. Epub 2023 Jan 19. Microbiol Spectr. 2023. PMID: 36655994 Free PMC article.
-
Signs and symptoms to determine if a patient presenting in primary care or hospital outpatient settings has COVID-19.Cochrane Database Syst Rev. 2021 Feb 23;2(2):CD013665. doi: 10.1002/14651858.CD013665.pub2. Cochrane Database Syst Rev. 2021. Update in: Cochrane Database Syst Rev. 2022 May 20;5:CD013665. doi: 10.1002/14651858.CD013665.pub3. PMID: 33620086 Free PMC article. Updated.
References
-
- News N. Covid-19 testing capacity strained by surge in demand. In: Marx W, ed. On line 2020.
-
- Fernandez SMaM. ‘It’s Like Having No Testing’: Coronavirus Test Results Are Still Delayed. New York Times. Aug. 4, 2020, 2020.
Grants and funding
LinkOut - more resources
Full Text Sources
Miscellaneous