[Preprint]. 2024 May 5:2024.05.02.592271.
doi: 10.1101/2024.05.02.592271.

Cortical circuit principles predict patterns of trauma induced tauopathy in humans

Affiliations

Cortical circuit principles predict patterns of trauma induced tauopathy in humans

Helen Barbas et al. bioRxiv. .

Update in

Abstract

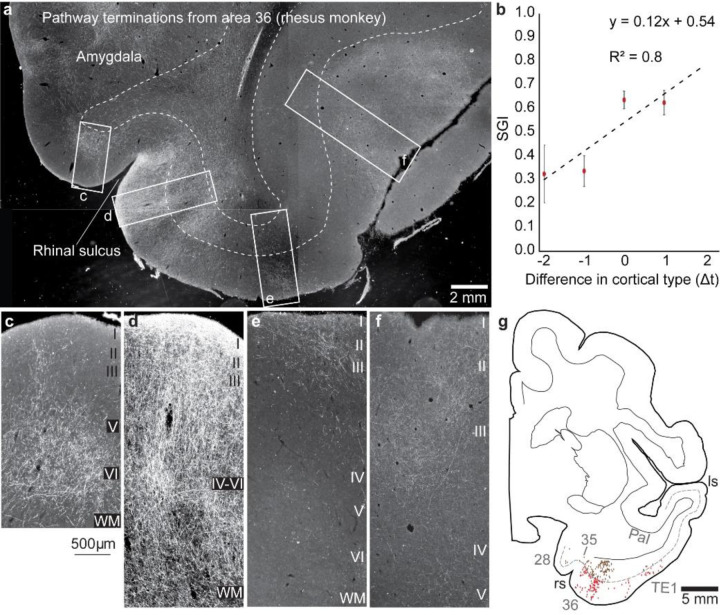
Connections in the cortex of diverse mammalian species are predicted reliably by the Structural Model for direction of pathways and signal processing (reviewed in 1,2). The model is rooted in the universal principle of cortical systematic variation in laminar structure and has been supported widely for connection patterns in animals but has not yet been tested for humans. Here, in postmortem brains of individuals neuropathologically diagnosed with chronic traumatic encephalopathy (CTE) we studied whether the hyperphosphorylated tau (p-tau) pathology parallels connection sequence in time by circuit mechanisms. CTE is a progressive p-tau pathology that begins focally in perivascular sites in sulcal depths of the neocortex (stages I-II) and later involves the medial temporal lobe (MTL) in stages III-IV. We provide novel quantitative evidence that the p-tau pathology in MTL A28 and nearby sites in CTE stage III closely follows the graded laminar patterns seen in homologous cortico-cortical connections in non-human primates. The Structural Model successfully predicted the laminar distribution of the p-tau neurofibrillary tangles and neurites and their density, based on the relative laminar (dis)similarity between the cortical origin (seed) and each connection site. The findings were validated for generalizability by a computational progression model. By contrast, the early focal perivascular pathology in the sulcal depths followed local columnar connectivity rules. These findings support the general applicability of a theoretical model to unravel the direction and progression of p-tau pathology in human neurodegeneration via a cortico-cortical mechanism. Cortical pathways converging on medial MTL help explain the progressive spread of p-tau pathology from focal cortical sites in early CTE to widespread lateral MTL areas and beyond in later disease stages.


Conflict of interest statement

Conflict of interest statement Dr. McKee is a member of the Mackey-White Committee of the National Football League Players Association. The remaining authors declare no competing interests.

Figures

Fig. 1:
Fig. 1:. P-tau pathology in temporal cortices in late stage III CTE.
a, Cross section through the medial temporal lobe (case K128) at the level of the amygdala immunostained against hyperphosphorylated tau (box b shows the densest p-tau pathology in A28). b-k, At high magnification, regions (outlined in a) show a graded pattern in the laminar distribution of neurons with p-tau pathology that parallels the laminar connectivity between the agranular A28 (b) through adjacent dysgranular and progressively with eulaminate (six-layer) lateral temporal areas. l, Quantitative analysis shows a monotonic increase of neurons with p-tau pathology in the upper layers (SGI) from medial to lateral parts of MTL for three cases with late stage III CTE. m, Quantitative analysis of the density of neurons with p-tau pathology in the supragranular layers of three cases with late stage III CTE, gradually decreasing from A28 (b) to progressively adjacent lateral sites within MTL.
Fig. 2:
Fig. 2:. P-tau pathology in MTL cortices in early stage III CTE.
a, Overview of cross section through the medial temporal lobe at the level of the amygdala (case AT8-CV-SLI-67) immunostained against hyperphosphorylated tau. b-h, Sites shown at high magnification (boxes outlined in a) show a graded pattern in the laminar distribution of neurons with p-tau pathology that parallels patterns of laminar connectivity between A28 and areas with increasing laminar differentiation in the MTL. l, Quantitative analysis shows monotonic increase of neurons with p-tau pathology in the upper layers (SGI) from medial to lateral parts of MTL for a case with early stage III CTE. m, Quantitative analysis of the density of neurons with p-tau pathology in the supragranular layers of a case with early stage III CTE, gradually decreasing from A28 to progressively adjacent lateral sites within MTL.
Fig. 3:
Fig. 3:. Laminar distribution of p-tau pathology in processes (excluding neuron bodies) as a proxy for anterograde pathways in stage III CTE.
Early stage III CTE (blue circles); late stage III CTE (red squares).
Fig. 4:
Fig. 4:. Interconnections of MTL areas in rhesus monkeys.
a, Overview of representative coronal section through the temporal lobe at the level of the amygdala shows pathway terminations and projection neurons (white label) connected with medial temporal A36 (neural tracer was biotinylated dextran amine neural tracer (BDA)) injected in area 36. Magnified boxes (from a) c-f, Medial A28 is connected with A36 via the deep layers, d, shows connections in all layers and progressively in the upper layers of more lateral MTL sites. b, Quantitative analysis shows monotonic increase of projection neurons in the upper layers (SGI) from medial to lateral parts of MTL. Connection data were combined from 5 cases and expressed as a function of the difference in laminar type with respect to the injection site in each case. g, Projection neurons in the supragranular layers (red dots) and infragranular layers (brown dots) mapped in a cross section through MTL show a shift of projection neurons from the deep layers in A28, to both superficial and deep layers in adjacent MTL A36, and mostly in the upper layers of visual association area TE. The dotted line shows the upper part of layer V. ls, lateral sulcus; rs, rhinal sulcus. (a-f, darkfield photomicrographs)
Fig. 5:
Fig. 5:. Simulation of propagation of p-tau across cortical types.
Five cortical types were simulated, with the most limbic cortex (Type 1, agranular) being the seed area from which p-tau initially spreads. The disease advanced in stages, moving from left to right. Subplots a depict the relative uptake of p-tau in supragranular layers (L2/3) and infragranular layers (L5/6). Uptake is quantified as a proportion varying between 0 and 1: a, value of 1 means that all the neurons in the corresponding layer have p-tau. b, Subplots depict the corresponding supragranular gray index (SGI), which captures the extent to which the supragranular layers are preferentially stained with p-tau. Red dashed lines indicate SGI of 0.5, which corresponds to equal staining in supragranular and infragranular layers. c, Subplots depict the total amount of p-tau in the entire cortical area, which takes a maximum value of 2 when both supragranular and infragranular layers are fully stained (a.u.: arbitrary units). As the disease progresses, p-tau expression becomes increasingly uniform across L2/3 and L5/6, and also across cortices (subplots a-4, b-4, and b-4).
Fig. 6:
Fig. 6:. Expression of p-tau pathology in dorsal and lateral cortices in early CTE stages.
a, Cross section through the temporal lobe at the level of the anterior hippocampus immunostained against p-tau in stage I CTE. Outlined region shows initial area of injury in the depths of a sulcus, magnified below to highlight labeled neurons in all layers, including layer 4. a1, a2, Outlined regions are shown at higher magnification on the right side of panel a. In the depths of the sulcus in a1 there are labeled neurons in all layers, a pattern that resembles a different type of circuitry, namely connections within a cortical column. Columns in nearby areas (a2) do not include neurons in layer 4, a pattern that resembles cortico-cortical connections. b, Overview of cross section through the temporal lobe at the level of the temporal pole immunostained against hyperphosphorylated tau in stage II CTE. Outlined region (box) shows early p-tau pathology at higher magnification shows labeled neurons in all layers, including layer 4. b1, Outlined region is shown at higher magnification on the right side of panel b.

Similar articles

References

    1. Barbas H. General cortical and special prefrontal connections: Principles from structure to function. Annu Rev Neurosci 38, 269–289 (2015). - PubMed
    1. Aparicio-Rodriguez G. & Garcia-Cabezas M. A. Comparison of the predictive power of two models of cortico-cortical connections in primates: the distance rule model and the structural model. Cereb Cortex, doi: 10.1093/cercor/bhad104 (2023). - DOI - PubMed
    1. Tucker D. M. & Luu P. Adaptive control of functional connectivity: dorsal and ventral limbic divisions regulate the dorsal and ventral neocortical networks. Cereb Cortex 33, 7870–7895, doi: 10.1093/cercor/bhad085 (2023). - DOI - PubMed
    1. Pandya D., Seltzer B., Petrides M. & Cipolloni P. B. Cerebral Cortex: Architecture, Connections, and the Dual Origin Concept. (Oxford University Press, 2015).
    1. Hanisch B. et al. Cerebral chemoarchitecture shares organizational traits with brain structure and function. eLife 12, doi: 10.7554/eLife.83843 (2023). - DOI - PMC - PubMed

Publication types