[Preprint]. 2024 Apr 22:rs.3.rs-4255086.
doi: 10.21203/rs.3.rs-4255086/v1.

Peroxisome proliferator-activated receptor alpha is essential factor in enhanced macrophage immune function induced by angiotensin converting enzyme

Affiliations

Peroxisome proliferator-activated receptor alpha is essential factor in enhanced macrophage immune function induced by angiotensin converting enzyme

Suguru Saito et al. Res Sq. .

Update in

Abstract

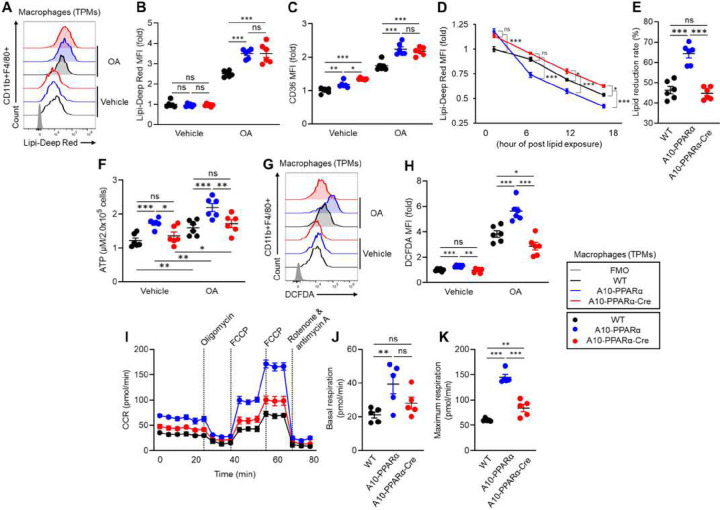
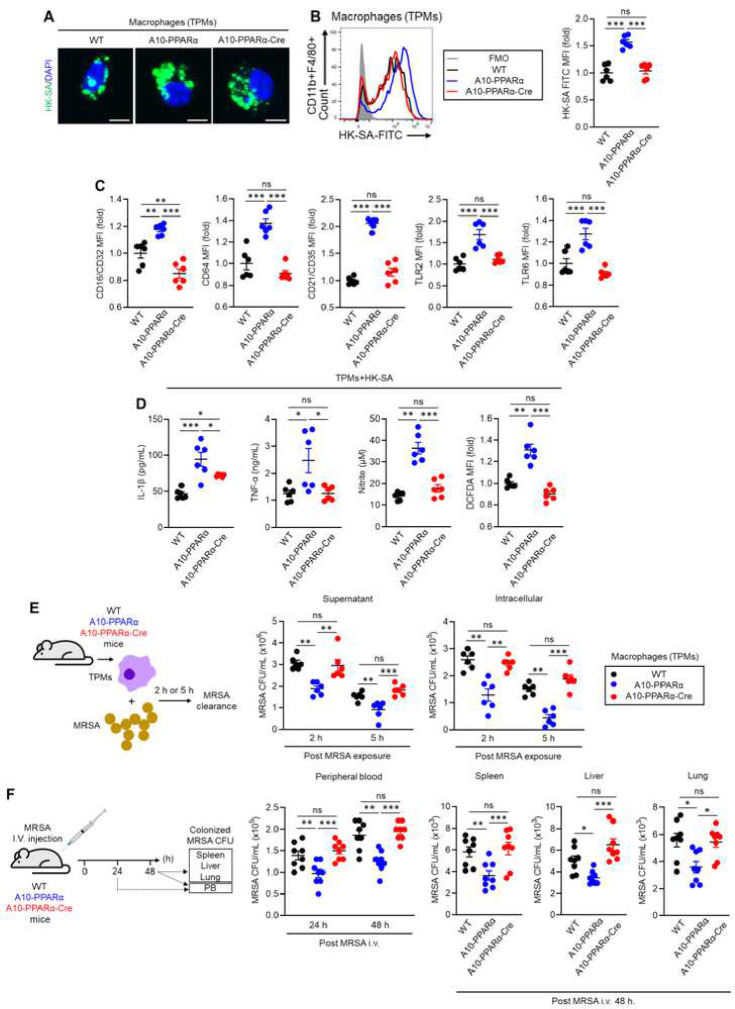
An upregulation of angiotensin-converting enzyme (ACE) expression strengthens the immune activity of myeloid lineage cells as a natural functional regulation mechanism in our immunity. ACE10/10 mice, possessing increased ACE expression in macrophages, exhibit enhanced anti-tumor immunity and anti-bactericidal effects compared to those of wild type (WT) mice, while the detailed molecular mechanism has not been elucidated yet. In this report, we demonstrate that peroxisome proliferator-activated receptor alpha (PPARα) is a key molecule in the functional upregulation of macrophages induced by ACE. The expression of PPARα, a transcription factor regulating fatty acid metabolism-associated gene expressions, was upregulated in ACE-overexpressing macrophages. To pinpoint the role of PPARα in the enhanced immune function of ACE-overexpressing macrophages, we established a line with myeloid lineage-selective PPARα depletion employing the Lysozyme 2 (LysM)-Cre system based on ACE 10/10 mice (named A10-PPARα-Cre). Interestingly, A10-PPARα-Cre mice exhibited larger B16-F10-originated tumors than original ACE 10/10 mice. PPARα depletion impaired cytokine production and antigen-presenting activity in ACE-overexpressing macrophages, resulting in reduced tumor antigen-specific CD8+ T cell activity. Additionally, the anti-bactericidal effect was also impaired in A10-PPARα-Cre mice, resulting in similar bacterial colonization to WT mice in Methicillin-Resistant Staphylococcus aureus (MRSA) infection. PPARα depletion downregulated phagocytic activity and bacteria killing in ACE-overexpressing macrophages. Moreover, THP-1-ACE-derived macrophages, as a human model, expressing upregulated PPARα exhibited enhanced cytotoxicity against B16-F10 cells and MRSA killing. These activities were further enhanced by the PPARα agonist, WY 14643, while abolished by the antagonist, GW6471, in THP-1-ACE cells. Thus, PPARα is an indispensable molecule in ACE-dependent functional upregulation of macrophages in both mice and humans.

Keywords: PPARα; angiotensin converting enzyme; anti-tumor immunity; bacterial clearance; macrophages.


Conflict of interest statement

Conflict of Interest The authors have declared that no conflict of interest exists.

Figures

Figure 1.
Figure 1.. Genetic design of macrophage specific PPARα deletion in ACE10/10 mice.
A) A10-PPRAα mice (floxed) were crossed with LysM-Cre mice to obtain A10-PPRAα-Cre mice (conditional KO). PPARα exon 4 was excised by the Cre-loxP system. To measure the depletion of exon 4, PCR was performed by using the primers Lf and Er (Supplement Table 1). B) Representative gel images of genotyping PCR for determination of WT, A10-PPARα and A10-PPRAα-Cre mice. C) PPARα expression in thioglycolate-elicited peritoneal macrophages (TPMs) and hepatocytes measured by Western blot. D, E) Representative histogram (D) and MFI values (fold change) (E) of PPARα expression in TPMs measured by flow cytometry. F-H) Representative histogram (F) and PPARα MFI values (fold change) in spleen (G) and liver (H) resident macrophages measured by flow cytometry. The cumulative data are shown as mean ± SEM values of six samples from two independent experiments. All MFI values are represented as fold changes (the average value of WT was used for a value equal to 1). One-way ANOVA was used to analyze data for significance. *p < 0.05 and **p < 0.001, ns is not significant.
Figure 2.
Figure 2.. PPARα depletion alters the expression of immune response and lipid metabolism associated genes in macrophages.
A, B) The number and percent difference in number of genes with ≥ 2-fold increased RNA expression in the comparison of A10-PPARα (red) and A10-PPRAα-Cre (orange) TPM vs. WT TPM. The classifications of gene categories (A: Immune system; B: Lipid metabolism) were determined using KEGG Term level 1. (C-I) Gene expression heat maps of individual PPARα target genes (C), PPAR signaling (D), Lipid metabolism (E), Antigen processing and presentation (F), Cytokine and chemokine production (G), Pathogen recognition (H), and Bacteria killing and inflammasome (I).
Figure 3.
Figure 3.. PPARα depletion alters lipid metabolism in ACE-overexpressing macrophages.
TPMs were incubated with vehicle (ethanol) or OA (200 μM) at 37°C for 16 h. The intracellular lipid was stained with Lipi-Deep Red (LDR) and quantified by flow cytometry. A, B) Representative histograms and MFI values (fold change) of LDR signals in TPMs. C) MFI values (fold change) of CD36 expressions in TPMs measured by flow cytometry. D-E) TPMs were treated with OA for 16 h, washed and then placed in media for 6, 12 and 18 h. Intracellular lipid was stained with LDR and quantified by flow cytometry at each time point. D) Time dependent lipid reduction. E) Lipid reduction rate at 18 h. F-H) ATP and ROS production in TPMs. TPMs were incubated with control (ethanol) or OA (200 μM) at 37°C for 16 h. The ATP concentration in TPMs was measured by luminescence (F). The intracellular ROS levels of TPMs were assessed by DCFDA staining and flow cytometry. G, H) Representative histograms and MFI values (fold change) of DCFDA signals for ROS quantification. I-K) Real-time metabolic analysis of TPM by Seahorse. I) Transition of oxygen consumption rate (OCR) in TPMs during analysis. J, K) Basal respiration and maximal respiration of TPMs. The cumulative data are shown as mean ± SEM values of five to six samples from two independent experiments. All MFI values are represented as fold changes (the average value of WT was set as equal to 1). One-way ANOVA was used to analyze data for significance. *p < 0.05, **p < 0.01 and ***p < 0.01. ns is not significant.
Figure 4.
Figure 4.. PPARα depletion impairs anti-tumor activity of A10-PPARα-Cre mice.
A) Experimental design of murine B16-F10 tumor model. The mice received a subcutaneous (s.c.) injection of B16-F10 cells (100 μL of 1.0×10⁷/mL in PBS). The tumor volumes were measured and immunological activities of intratumor (IT) macrophages and CD8+ T cells were analyzed by flow cytometry at day 14 post tumor inoculation. B) Representative pictures of tumors. C) Tumor volumes. D) Number of macrophages infiltrating the tumors. E-H) Functional marker expression by IT macrophages. MFI values (fold change) of M1 markers (TNF-α, IL-6, IL-12/IL-23p40 and iNOS) (E), M2 markers (arginase 1 (Arg 1), IL-10, and CD206) (F), co-inhibitory molecules (PD-L1 and PD-L2) (G), and antigen presentation related molecules (CD80, H-2Kb and I-Ab) (H). I-N) Functional characterization of IT CD8+ T cells. I) Representative plots of TRP-2/Tetramer (Tet)+CD8+ T cells. J, K) Percentages and cell numbers of TRP-2/Tet+CD8+ T cells. L-N) Percentages of TNF-α+, IFN-γ+, or GzmB+TRP-2/Tet+CD8+ T cells. The cumulative data are shown as mean ± SEM values of six to ten samples from two or three independent experiments. All MFI values are represented as fold changes (the average value of WT was used for base=1). One-way ANOVA was used to analyze data for significant differences. *p < 0.05, **p < 0.01, and ***p < 0.001. ns is not significant.
Figure 5.
Figure 5.. PPARα depletion attenuates tumor killing and antigen presenting ability of ACEover expressing macrophages.
A) In vitro tumor killing assay. B16-F10 cells and TPMs prepared from WT, A10-PPARα or A10-PPARα-Cre naive mice (no tumor) were mixed at a 1:1 ratio and incubated at 37°C for 24 h. The LDH concentrations in the cultures were measured to calculate the percentages of tumor cells killed by TPMs. B) In vitro antigen re-stimulation assay. Inguinal lymph node (iLN) cells were isolated from tumor bearing mice 11 days after tumor inoculation and were re-stimulated with TRP-2 peptide (100 μg/mL) at 37°C for 72 h. IFN-γ concentrations in the cultured medium were measured by ELISA. C) In vitro antigen presentation assay. CD8+ T cells were isolated from the iLNs of tumor bearing WT mice 11 days after tumor inoculation. TPMs were also prepared from naive WT, A10-PPARα or A10-PPARα-Cre mice and co-cultured with the CD8+ T cells in the presence of TRP-2 peptide (100 μg/mL) at 37°C for 24 h. The expression (MFI) of CD69 by CD8+ T cells and the percentages of IFN-γ+CD8+ T cells were measured by flow cytometry. The cumulative data are shown as mean ± SEM of six samples from two independent experiments. All MFI values are represented as fold changes (the average value of WT was set equal to 1). One-way ANOVA was used to analyze data for significant differences. *p < 0.05 and **p < 0.01. ns is not significant.
Figure 6.
Figure 6.. PPARα depletion impairs anti-bacterial immune response of A10-PPARα-Cre mice.
A, B) In vitro phagocytosis assay. TPMs were incubated with FITC labeled heat killed S. aureus (HK-SA-FITC) at 37°C for 2 h. Bacterial phagocytosis was analyzed by fluorescence microscope and flow cytometry. Representative images of the incorporated HK-SA-FITC (green spots) in TPMs (bar=10 μm) (A), representative histograms and MFI values (fold change) of incorporated HK-SA-FITC signals in TPMs (B). C) TPM receptor expression. Representative histograms and MFI values (fold change) of CD16/CD32, CD64, CR1/2, TLR2 and TLR6 are shown. D) In vitro TPMs stimulation assay. TPMs were stimulated with HK-SA at 37°C for 24 h and the concentrations of IL-1β, TNF-α and nitrite in the cultured medium were measured by ELISA and Griess assay. The ROS productions in TPMs were measured by flow cytometry with DCFDA staining. E) In vitro MRSA killing assay. TPMs (1.0×10⁶/mL) were incubated with MRSA (1.0×10⁷ CFU/mL, MOI=1:10) for 2 h or 5 h, and the number of live MRSA in the supernatant and within the TPM were quantitated as colony forming units (CFUs). F) In vivo MRSA infection. Mice received an i.v. injection of live MRSA (100 μL of 1.0×10⁹ CFU/mL in PBS). After 24 h or 48 h, MRSA CFUs were measured for peripheral blood (PB). The CFUs were also measured for spleen, liver, and lung at 48 h (per 100 mg of tissue). The cumulative data are shown as mean ± SEM values of six or eight samples from two or three independent experiments. All MFI values are presented as fold changes (the average value of WT was set as 1). One-way ANOVA was used to analyze data for significant differences. *p < 0.05, **p < 0.01 and ***p < 0.01. ns is not significant.
Figure 7.
Figure 7.. PPARα regulates ACE-mediated functional behavior of human macrophage-like cells.
THP-1 and THP-1-ACE cells were differentiated to macrophage-like cells by treating with PMA (20 ng/mL) for 72 h. A) In vitro tumor killing assay. BT549 cells and macrophage-like cells were mixed at a 1:1 ratio and incubated at 37°C for 24 h. The LDH concentrations in the culture media were measured to calculate killing of tumor cells. B) In vitro phagocytosis assay. Macrophage-like cells were incubated with FITC labeled S. aureus (SA-FITC) for 2 h at 37°C at which point bacterial phagocytosis was quantified by flow cytometry. MFI values are presented as fold change where the average value of WT cells was set as 1. C) In vitro MRSA killing assay. Macrophage-like cells were incubated with MRSA (MOI=1:30) at 37°C for 5 h. The number of live intracellular MRSA was then determined by CFU analysis. The cumulative data are shown as mean ± SEM values of nine samples from three independent experiments. One-way ANOVA was used to analyze data for significant differences. *p < 0.05, **p < 0.01 and ***p < 0.01. ns is not significant.

References

    1. Russell DG, et al. Immunometabolism at the interface between macrophages and pathogens. Nat Rev Immunol. 2019; 19(5):291–304. - PMC - PubMed
    1. Christofides A, et al. The complex role of tumor-infiltrating macrophages. Nat Immunol. 2022; 23(8):1148–1156. - PMC - PubMed
    1. Barrett TJ. Macrophages in Atherosclerosis Regression. Arterioscler Thromb Vasc Biol. 2020; 40(1):20–33. - PMC - PubMed
    1. Bernstein KE, et al. Angiotensin-converting enzyme in innate and adaptive immunity. Nat Rev Nephrol. 2018;14(5):325–336. - PMC - PubMed
    1. Okwan-Duodu D, et al. Angiotensin-converting enzyme overexpression in mouse myelomonocytic cells augments resistance to Listeria and methicillin-resistant Staphylococcus aureus. J Biol Chem. 2010;285(50):39051–60. - PMC - PubMed

Publication types