[Preprint]. 2024 Apr 30:2024.04.29.591792.
doi: 10.1101/2024.04.29.591792.

MmpL3, Wag31 and PlrA are involved in coordinating polar growth with peptidoglycan metabolism and nutrient availability

Affiliations

MmpL3, Wag31 and PlrA are involved in coordinating polar growth with peptidoglycan metabolism and nutrient availability

Neda Habibi Arejan et al. bioRxiv. .

Update in

Abstract

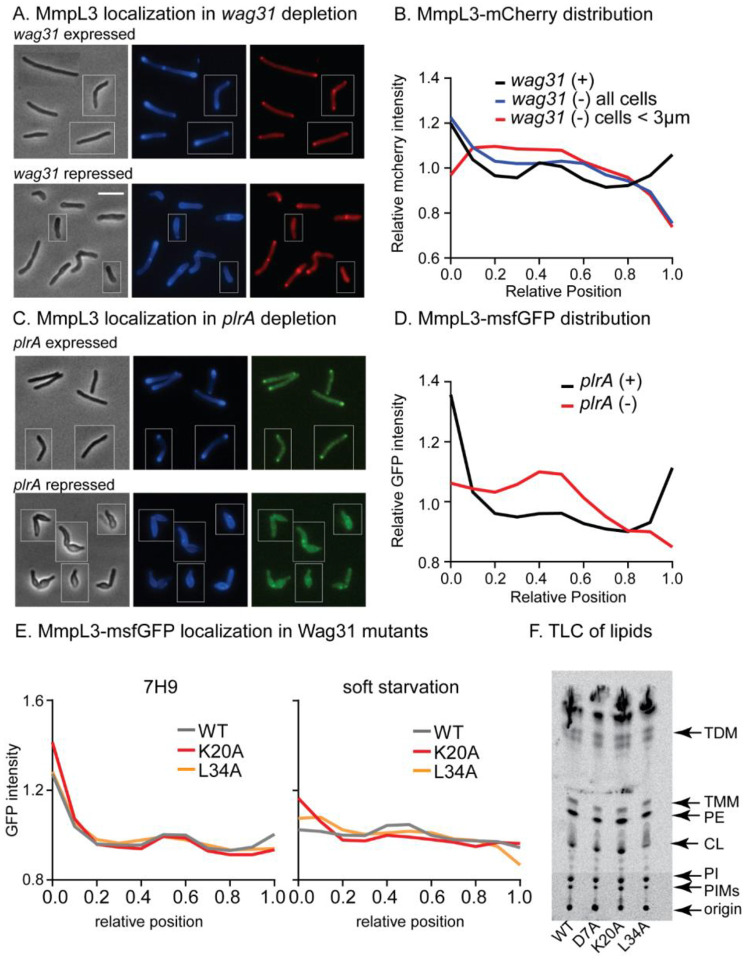
Cell growth in mycobacteria involves cell wall expansion that is restricted to the cell poles. The DivIVA homolog Wag31 is required for this process, but the molecular mechanism and protein partners of Wag31 have not been described. In this study of Mycobacterium smegmatis, we identify a connection between wag31 and trehalose monomycolate (TMM) transporter mmpl3 in a suppressor screen, and show that Wag31 and polar regulator PlrA are required for MmpL3's polar localization. In addition, the localization of PlrA and MmpL3 are responsive to nutrient and energy deprivation and inhibition of peptidoglycan metabolism. We show that inhibition of MmpL3 causes delocalized cell wall metabolism, but does not delocalize MmpL3 itself. We found that cells with an MmpL3 C-terminal truncation, which is defective for localization, have only minor defects in polar growth, but are impaired in their ability to downregulate cell wall metabolism under stress. Our work suggests that, in addition to its established function in TMM transport, MmpL3 has a second function in regulating global cell wall metabolism in response to stress. Our data are consistent with a model in which the presence of TMMs in the periplasm stimulates polar elongation, and in which the connection between Wag31, PlrA and the C-terminus of MmpL3 is involved in detecting and responding to stress in order to coordinate synthesis of the different layers of the mycobacterial cell wall in changing conditions.

Keywords: DivIVA; MmpL3; Murj; Mycobacterium; Mycolic acid; PlrA; TMMs; peptidoglycan; polar growth regulation; stress condition.


Figures

Figure 1.
Figure 1.. wag31 and mmpL3 are genetically connected.
(A) Diagram of mmpl3 operon with positions of wag31 suppressor mutations indicated. TSS = transcriptional start sites, from (Martini et. al., 2019). (B) Doubling times of Msmeg cells expressing the suppressor #6 allele of the MSMEG_0251-mmpl3 operon in wag31 WT and wag31 L34A backgrounds. Each bar graph represents an average of three biological replicates. Error bars represent standard deviation. (C) Q-RT-PCR of mmpl3 transcript levels in wag31 WT, wag31 D7A, wag31 K20A, and wag31 L34A strains. The graph represents relative expression of mmpl3 normalized to the housekeeping gene sigA. (D) Doubling time of Msmeg cells suppressing mmpl3 transcription by CRISPRi in wag31 WT and wag31 L34A backgrounds. Three biological replicates of each strain were used for calculating the doubling time. Error bars represent standard deviation. *, P = < 0.05, **, P=< 0.005, ****, P = <0.0001. All P-values are calculated by one-way ANOVA, Dunnett’s multiple comparisons test.
Figure 2.
Figure 2.. Wag31, PlrA and MmpL3 work in the same pathway to regulate polar growth.
(A) Colony Form Units (CFU) of Msmeg carrying the mmpl3 CRISPRi transcriptional repression construct in uninduced (blue, mmpl3 expressed) and induced (red, mmpl3 repressed) conditions. (B) Fluorescent micrographs of HADA stained cells in WT (control), and during depletion of mmpl3, wag31 or plrA. Fluorescent signal shows the incorporation of the fluorescent D-amino acid HADA, which reports on peptidoglycan metabolism. The scale bar is 5 microns. (C) Relative averaged HADA intensity across the length of 300+ cells from experiments in B. Data from each cell is oriented so signal from the pole that is brighter by HADA, presumed to the old pole, is at position 0 on the X axis, and the new pole is at position 1. Data are normalized such that the mean of each trace is set to 1, to call attention to differences in distribution of signal. (D) Maximum intensity of MmpL3-msfGFP signal per cell pole in 300+ cells is plotted against the maximum intensity of HADA signal the same pole. Data are separated by pole; the pole of each cell that is brighter by HADA is presumed to be the old pole, and the dimmer pole is presumed to be the new pole. (E) Maximum intensity of PlrA-GFPmut3 signal per cell pole in 300+ cells is plotted against the maximum intensity of HADA signal the same pole, as in D. R2 values in (D) and (E) were calculated by linear regression analysis. The linear fit (gray line) is only shown where there is a correlation.
Figure 3.
Figure 3.. Both Wag31 and PlrA are required for MmpL3’s polar localization.
(A) Phase (left) and HADA (middle), Mmpl3-Mcherry (right) images of Msmeg expressing MmpL3-mcherry in untreated (top) and CRISPRi repression of wag31 transcription. Scale bar is 5 microns and applies to all images in figure. (B) Relative averaged MmpL3-mCherry intensity across the length of 300+ cells from experiments in A. Data from each cell is oriented so signal from the pole that is brighter by HADA, presumed to the old pole, is at position 0 on the X axis, and the new pole is at position 1. Data are normalized such that the mean of each trace is set to 1, to call attention to differences in distribution of signal. Relative intensity of alongside of the cell in wag31 depletion. Traces are the average of n=353 wag31 expressed cells or n=572 wag31 repressed cells. (C) Phase (left), HADA (middle), MmpL3- msfGFP (right) images of Msmeg expressing MmpL3-msfGFP during transcriptional depletion of plrA. (D) Relative averaged MmpL3-msfGFP intensity across the length of 300+ cells from experiments in B, as in C. Traces are the average of n=319 plrA expressed cells or n=347 plrA repressed cells. (E) MmpL3- msfGFP intensity across the length of 300+ cells from strains with the indicated wag31 alleles. (F) Thin-layer chromatography of C14 labeled lipids extracted from strains with the indicated wag31 alleles. Lipid species that could be identified are labeled.
Figure 4.
Figure 4.. Localization of MmpL3, PlrA and Wag31 responds to energy stresses.
(A) Averaged HADA intensity (reporting on peptidoglycan) and DMN-tre intensity (reporting on mycolic acids), in both hard and soft starvation, across the length of 300+ cells, representative micrographs are on the right. Data from each cell is oriented so signal from the pole that is brighter by HADA, presumed to the old pole, is at position 0 on the X axis, and the new pole is at position 1. Analysis was performed on the indicated number of cells, split evenly between three biological replicate cultures: 3 hour hard starvation, n=334; 5 hour soft starvation, n=345; 24 hour soft starvation, n=335; 7H9 control, n=458. (B) Relative, averaged MmpL3-msfGFP intensity in both hard and soft starvation, across the length of 300+ cells, representative micrographs are on the right. Data are oriented as in A. The data analysis was done on three biological replicates of MmpL3-msfGFP strain. Analysis was performed on the indicated number of cells, split evenly between three biological replicate cultures: 1 hour hard starvation, n=328; 3 hour hard starvation, n=314; 1 hour soft starvation, n=369; 3 hour soft starvation, n=366; 24 hour soft starvation, n=420; 7H9 control, n=358. (C) Relative, averaged PlrA-GFPmut3 intensity in both hard and soft starvation, across the length of 300+ cells, representative micrographs are on the right, as in B. Analysis was performed on the indicated number of cells, split evenly between three biological replicate cultures: 1 hour hard starvation, n=382; 3 hour hard starvation, n=355; 1 hour soft starvation, n=351; 3 hour soft starvation, n=423; 24 hour soft starvation, n=906; 7H9 control, n=364. (D) Relative, averaged Wag31-GFPmut3 intensity in both hard and soft starvation, across the length of 300+ cells, representative micrographs are on the right, as in B. Analysis was performed on the indicated number of cells, split evenly between three biological replicate cultures: 1 hour hard starvation, n=333; 24 hour hard starvation, n=428; 1 hour soft starvation, n=352; 3 hour soft starvation, n=349; 24 hour soft starvation, n=967; 7H9 control, n=334. (E) Relative, averaged MmpL3-mCherry intensity across the length of 300+ cells treated or untreated with 5μg/ml of SQ109 for 1hour, data arranged as in B, representative images to the right. (F) Relative, averaged PlrA- GFPmut3 intensity across the length of 300+ cells treated or untreated with 5μg/ml of SQ109 for 1hour, data arranged as in B, representative images to the right.
Figure 5.
Figure 5.. MmpL3 connects regulation of peptidoglycan and mycolic acid metabolism.
(A) Relative, averaged HADA and MmpL3-msfGFP intensity across the length of 300+ cells treated or untreated with moenomycin at 100 μg/ml for one hour. Representative micrographs are below. Data from each cell is oriented so signal from the pole that is brighter by HADA, presumed to the old pole, is at position 0 on the X axis, and the new pole is at position 1. (B) Relative, averaged PlrA-GFPmut3 intensity across the length of 300+ cells treated or untreated with moenomycin at 100 μg/ml for one hour. Data are oriented as in A, representative micrographs are to the right. (C) Relative, averaged MmpL3-mCherry intensity across the length of 300+ cells expressing murJ (control, black) or repressing murJ through CRISPRi for 16 hours (red). Data are oriented as in A, representative micrographs to the right. (D) Relative, averaged MmpL3-mCherry intensity across the length of 300+ cells treated or untreated with NITD-349 at 5 or 10 μg/ml for one hour. Data are oriented as in A, representative micrographs are below E. (E) Averaged HADA and DMN-tre intensity across the length of 300+ cells treated or untreated with NITD-349 at 5 or 10 μg/ml for one hour. Data are oriented as in A, representative micrographs are below.
Figure 6.
Figure 6.. The MmpL3 C-terminal domain regulates polar elongation and starvation response.
(A) Doubling time of Msmeg with mmpl3 WT or mmpl3-ΔCT alleles. Data represent an average of three biological replicates, error bars represent standard deviation. (B) and (C) The length and width of cells in A. Black bar is the mean. (D) Length of polar elongation in the mmpl3 WT and mmpl3-ΔCT strains during 1.5 hours of log. phase growth between initial HADA stain and later NADA stain. The length between the pole tip and the end of the HADA signal was measured for each cell pole. Black bar is at the mean, colored balls represent the means of ~100+ cells from each biological replicate culture. The representative images show the double stained cell, HADA (false colored yellow) and NADA (false colored red). (E) Averaged HADA and DMN-tre intensity across the length of 300+ cells of each strain in log. phase. Data from each cell is oriented so signal from the pole that is brighter by HADA, presumed to the old pole, is at position 0 on the X axis, and the new pole is at position 1. Representative images are below. The scale bar is 5 microns and applies to all images. (F) Averaged HADA and DMN-tre intensity across the length of 300+ cells of each strain after 5 hours of soft starvation, data are oriented as in E, representative images are below. (G) Minimum inhibitory concentrations (MICs) of indicated strains were measured using spot assay on an LB Lennox plates. Three biological replicate cultures of each strain were measured, error bars are not shown when the values were identical between the replicates. Error bars represent standard deviation. NITD-349 is an MmpL3 inhibitor; RIF= rifampin; TMP= trimethoprim; MOEN= moenomycin; MEM= meropenem. (H) CFU of indicated strains during soft starvation and treatment with 100 μg/ml of moenomycin. Error bars represent the standard error of the mean. ns, p >0.05, **, P=< 0.005, ****, P = <0.0001

References

    1. Minnikin DE. 1991. Chemical principles in the organization of lipid components in the mycobacterial cell envelope. Research in Microbiology 142:423–427. - PubMed
    1. Thanky NR, Young DB, Robertson BD. 2007. Unusual features of the cell cycle in mycobacteria: Polar-restricted growth and the snapping-model of cell division. Tuberculosis 87:231–236. - PubMed
    1. Aldridge BB, Fernandez-Suarez M, Heller D, Ambravaneswaran V, Irimia D, Toner M, Fortune SM. 2012. Asymmetry and Aging of Mycobacterial Cells Lead to Variable Growth and Antibiotic Susceptibility. Science 335:100–104. - PMC - PubMed
    1. Daffé M, Draper P. 1997. The Envelope Layers of Mycobacteria with Reference to their Pathogenicity, p. 131–203. In Advances in Microbial Physiology. Elsevier. - PubMed
    1. McNeil M, Wallner SJ, Hunter SW, Brennan PJ. 1987. Demonstration that the galactosyl and arabinosyl residues in the cell-wall arabinogalactan of Mycobacterium leprae and Myobacterium tuberculosis are furanoid. Carbohydrate Research 166:299–308. - PubMed

Publication types