[Preprint]. 2024 Nov 5:2024.04.29.591666.
doi: 10.1101/2024.04.29.591666.

Addressing pandemic-wide systematic errors in the SARS-CoV-2 phylogeny

Martin Hunt  1   2   3   4 Angie S Hinrichs  5 Daniel Anderson  1 Lily Karim  5   6 Bethany L Dearlove  7 Jeff Knaggs  1   2   3   4 Bede Constantinides  2   4 Philip W Fowler  2   3   4 Gillian Rodger  2   4 Teresa Street  2   3 Sheila Lumley  2   8 Hermione Webster  2 Theo Sanderson  9 Christopher Ruis  10   11 Benjamin Kotzen  12 Nicola de Maio  1 Lucas N Amenga-Etego  13 Dominic S Y Amuzu  13 Martin Avaro  14 Gordon A Awandare  13 Reuben Ayivor-Djanie  15   16 Timothy Barkham  17 Matthew Bashton  18 Elizabeth M Batty  19   20 Yaw Bediako  13 Denise De Belder  21 Estefania Benedetti  14 Andreas Bergthaler  7 Stefan A Boers  22 Josefina Campos  21 Rosina Afua Ampomah Carr  16   23 Yuan Yi Constance Chen  17 Facundo Cuba  21 Maria Elena Dattero  14 Wanwisa Dejnirattisai  24 Alexander Dilthey  25 Kwabena Obeng Duedu  16   26 Lukas Endler  7 Ilka Engelmann  27 Ngiambudulu M Francisco  28 Jonas Fuchs  29 Etienne Z Gnimpieba  30 Soraya Groc  31 Jones Gyamfi  16   32 Dennis Heemskerk  22 Torsten Houwaart  25 Nei-Yuan Hsiao  33 Matthew Huska  34 Martin Hölzer  34 Arash Iranzadeh  35 Hanna Jarva  36 Chandima Jeewandara  37 Bani Jolly  38   39 Rageema Joseph  35 Ravi Kant  40   41   42 Karrie Ko Kwan Ki  43 Satu Kurkela  36 Maija Lappalainen  36 Marie Lataretu  34 Jacob Lemieux  12 Chang Liu  44   45 Gathsaurie Neelika Malavige  37 Tapfumanei Mashe  46 Juthathip Mongkolsapaya  20   44   45 Brigitte Montes  31 Jose Arturo Molina Mora  47 Collins M Morang'a  13 Bernard Mvula  48 Niranjan Nagarajan  49   50 Andrew Nelson  51 Joyce M Ngoi  13 Joana Paula da Paixão  28 Marcus Panning  29 Tomas Poklepovich  21 Peter K Quashie  13 Diyanath Ranasinghe  37 Mara Russo  14 James Emmanuel San  52   53 Nicholas D Sanderson  2   3 Vinod Scaria  39   54 Gavin Screaton  2 October Michael Sessions  55 Tarja Sironen  40   41 Abay Sisay  56 Darren Smith  18 Teemu Smura  40   41 Piyada Supasa  44   45 Chayaporn Suphavilai  49 Jeremy Swann  2 Houriiyah Tegally  57 Bryan Tegomoh  58   59   60 Olli Vapalahti  40   41 Andreas Walker  61 Robert J Wilkinson  9   62   63 Carolyn Williamson  35 Xavier Zair  55 IMSSC2 Laboratory Network ConsortiumTulio de Oliveira  57   64 Timothy Ea Peto  2 Derrick Crook  2 Russell Corbett-Detig  5   6 Zamin Iqbal  1   65
Affiliations

Addressing pandemic-wide systematic errors in the SARS-CoV-2 phylogeny

Martin Hunt et al. bioRxiv. .

Abstract

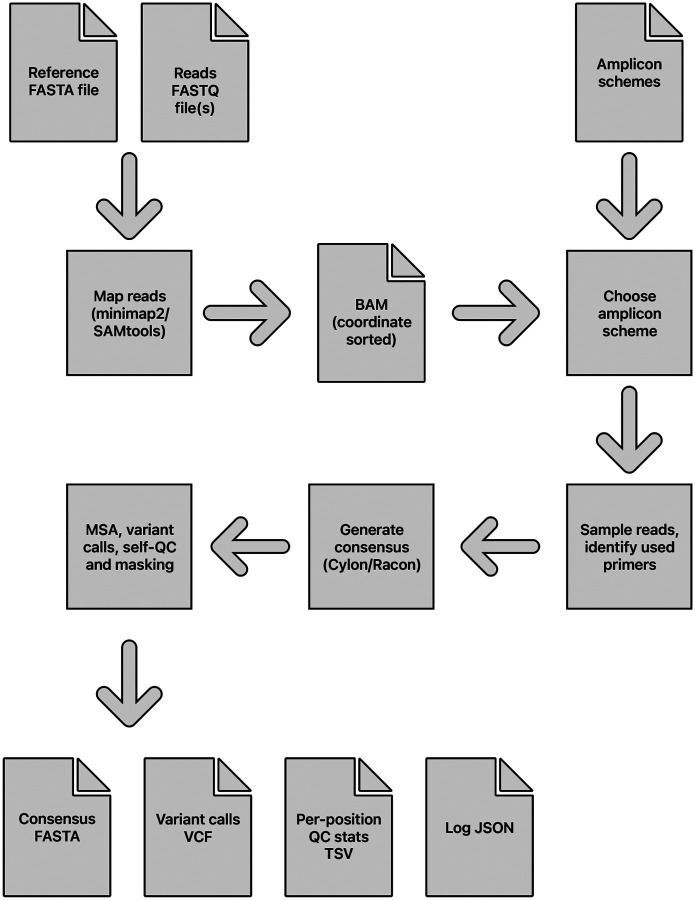
The SARS-CoV-2 genome occupies a unique place in infection biology - it is the most highly sequenced genome on earth (making up over 20% of public sequencing datasets) with fine scale information on sampling date and geography, and has been subject to unprecedented intense analysis. As a result, these phylogenetic data are an incredibly valuable resource for science and public health. However, the vast majority of the data was sequenced by tiling amplicons across the full genome, with amplicon schemes that changed over the pandemic as mutations in the viral genome interacted with primer binding sites. In combination with the disparate set of genome assembly workflows and lack of consistent quality control (QC) processes, the current genomes have many systematic errors that have evolved with the virus and amplicon schemes. These errors have significant impacts on the phylogeny, and therefore over the last few years, many thousands of hours of researchers time has been spent in "eyeballing" trees, looking for artefacts, and then patching the tree. Given the huge value of this dataset, we therefore set out to reprocess the complete set of public raw sequence data in a rigorous amplicon-aware manner, and build a cleaner phylogeny. Here we provide a global tree of 4,471,579 samples, built from a consistently assembled set of high quality consensus sequences from all available public data as of June 2024, viewable at https://viridian.taxonium.org. Each genome was constructed using a novel assembly tool called Viridian (https://github.com/iqbal-lab-org/viridian), developed specifically to process amplicon sequence data, eliminating artefactual errors and mask the genome at low quality positions. We provide simulation and empirical validation of the methodology, and quantify the improvement in the phylogeny. We hope the tree, consensus sequences and Viridian will be a valuable resource for researchers.


Conflict of interest statement

Conflict of Interest Gavin Screaton sits on the GSK Vaccines Scientific Advisory Board, consults for AstraZeneca, and is a founding member of RQ Biotechnology.

Figures

Figure 1:
Figure 1:. Assemblers which wrongly default to the reference base in the absence of data cause reversions in the phylogeny.
a) Cartoon phylogeny built from perfect genomes, with leaves coloured by genotype at a specific position X (purple - ancestral base, green - derived base). Just one mutation at this site, shown as a white star, is needed to explain the data. b) Cartoon showing the effect of assembly software assuming that a genome is identical to the reference genome when there is no data - here the amplicon containing position X is dropped in the lowest-but-one genome on the tree, creating one lone purple leaf. The tool which infers the phylogeny looks for a parsimonious explanation for this colour distribution, and concludes it was caused by a mutation (white star) followed by a “reversion” back to the ancestral base (red star). Errors in assembly caused by reference-bias tend to create enrichments of reversions. c) Part of the current UShER SARS-CoV-2 phylogeny, coloured by genotype at genome position 22813 (spike codon 417). Blow-up shows multiple reversions back to the ancestral purple. A non-exhaustive set of artefactual mutations (reversions, unreversions, re-reversions etc) are shown with red stars, where there is a flip back and forth from green to/from purple.
Figure 2:
Figure 2:
Timeline of the SARS-CoV-2 pandemic from December 2019 to July 2023, with selected events relating to problems with sequencing and consensus calling labelled a-e. Releases of ARTIC primers schemes (versions 1, 2, 3, 4, 4.1, 5.3.2) are marked with green triangles. a) Primer dimers cause amplicon dropouts [10] and 28% of GISAID [11] sequences deposited in September 2020 have at least one gap of length at least 200bp [12]. b) A 9bp deletion in the primer binding region of ARTIC V3 amplicon 73 causes missing data [13]. c) Dropouts causing artefacts at Spike 95 and 142 [14]. d) ARTIC v4 roll out triggers artifactual mutations in some pipelines [15]. e) Omicron samples cause ARTIC v4 amplicon dropout, triggering the update to ARTIC v4.1 [16].
Figure 3:
Figure 3:. Errors across the genome in consensus sequences from the “Early Omicron” African dataset, split by sequencing technology and amplicon scheme.
Plots show the percent of consensus sequences with an error (y-axis), taking the maximum value in windows of length 50bp (x-axis). Error here is defined as where the consensus sequence has an A/C/G/T call, the read depth passes Viridian’s default filters (see methods), and the reads support a different A/C/G/T call. Results are shown for Viridian, the original assemblies, and for the ARTIC-ILM and ARTIC-ONT assembly workflows.
Figure 4:
Figure 4:. Most variable sites cause fewer reversions in the Viridian tree than the GenBank tree.
a) Plot showing how many positions in the genome (y axis) have at least N reversions (x axis) in each tree (Viridian in blue, GenBank in red). Viridian curve drops faster, having fewer positions that create many reversions. b) Scatterplot comparing count of reversion mutations found in GenBank Dataset (y axis) and Viridian dataset (x axis). Note (0,0) is slightly indented from the origin of the plot. Each point represents a position of the SARS-CoV-2 genome. Three points below the line y=x are highlighted (labelled by genomic coordinates: 22786, 8835, 15521) where Viridian has particularly high numbers of reversions, and one (labelled 21987) for GenBank. c) Blow up of dotted square from panel b) showing vast majority of variable sites in the genome lie above the line y=x.
Figure 5:
Figure 5:. Comparison of uncertainty in growth estimates for different lineages when based on either the Viridian or Genbank tree.
Panels a) (left) and b) (right) plot the same data in two ways; each point represents one lineage. Panel a) plots the difference in standard deviation of posterior density of relative growth rate estimate ΔlogR (i.e. standard deviation using the Viridian tree minus standard deviation using the Genbank tree). Negative values here show that on average, the Viridian tree yields lower uncertainty than the Genbank tree. Panel b) shows the standard deviation of the posterior density of relative growth rate estimate ΔlogR based on the GenBank tree (left) and Viridian tree (right). The median standard deviation of strain growth rate using the Genbank tree is 2.967, while the median standard deviation using the Viridian tree is 0.859. This difference is statistically significant (p < 0.01, paired t-test). Box-plots show first and third quartiles (lower and upper boundaries of box), and whiskers are set to the farthest point that is within 1.5 times the inter-quartile range from the box. Legend labels denote parent lineage.
Figure 6:
Figure 6:
Overview of the Viridian pipeline, from input sequencing reads to output files.
Figure 7:
Figure 7:
Method to score an amplicon scheme, using mapped fragments. a) Example of one mapped fragment, where its left end is 3bp from the start of the primer, and its right end is 0bp from the end of the right primer. b) The plot generated from the fragment in a). The right end of the fragment increments the counter for zero distance from a primer, and the left end of the fragment increments the counter for 3bp distance from a primer. The information from all fragments in the sample is added in this way, to make the distribution of distances from nearest primer ends. c) The cumulative plot from b) after adding all fragments. d) Plot c) is normalised by taking distance to primer end as a percentage of the mean amplicon length (x axis), and fragment counts as percent of total fragments (y axis). The red line indicates a typical curve where the reads match the scheme, whereas the blue line shows a scheme that does not match. The scheme’s score is the sum of differences between the calculated line and the y = x line (shown as a dashed line).
Figure 8:
Figure 8:
Example scheme identification score plot from Viridian. Made from run accession ERR8959196, which is Nanopore reads sequenced using ARTIC-V4.1 primers.
Figure 9:
Figure 9:
Consensus sequence construction methods. See main text for details. a) The starting point is primer and amplicon positions, and reads mapped to the consensus sequence. b) The consensus sequence of each amplicon is generated independently, using Racon. c) The amplicon sequences are overlapped using perfect matches (if they exist), making contigs. d) The contigs are scaffolded against the reference genome, adding gaps where needed.
Figure 10:
Figure 10:
Consensus sequence pileup/masking methods. Two amplicons are shown with fragments (either illumina read pairs, or unpaired nanopore reads) mapped to the consensus. The fragments from amplicon 1 contribute to pileup at B-E, and do not count towards the primer regions A-B or E-F. Similarly, the fragments from amplicon 2 contribute to coverage at D-G (but not to C-D or G-H).

References

    1. Turakhia Yatish, De Maio Nicola, Thornlow Bryan, Gozashti Landen, Lanfear Robert, Walker Conor R., Hinrichs Angie S., Fernandes Jason D., Borges Rui, Slodkowicz Greg, Weilguny Lukas, Haussler David, Goldman Nick, and Russell Corbett-Detig. Stability of SARS-CoV-2 phylogenies. PLOS Genetics, 16(11):e1009175, November 2020. - PMC - PubMed
    1. De Maio Nicola, Walker Conor, Borges Rui, Weilguny Lukas, Slodkowicz Greg, and Goldman Nick. Issues with sars-cov-2 sequencing data, https://virological.org/t/issues-with-sars-cov-2-sequencing-data/473. May 2020.
    1. Henn Matthew R., Boutwell Christian L., Charlebois Patrick, Lennon Niall J., Power Karen A., Macalalad Alexander R., Berlin Aaron M., Malboeuf Christine M., Ryan Elizabeth M., Gnerre Sante, Zody Michael C., Erlich Rachel L., Green Lisa M., Berical Andrew, Wang Yaoyu, Casali Monica, Streeck Hendrik, Bloom Allyson K., Dudek Tim, Tully Damien, Newman Ruchi, Axten Karen L., Gladden Adrianne D., Battis Laura, Kemper Michael, Zeng Qiandong, Shea Terrance P., Gujja Sharvari, Zedlack Carmen, Gasser Olivier, Brander Christian, Hess Christoph, Günthard Huldrych F., Brumme Zabrina L., Brumme Chanson J., Bazner Suzane, Rychert Jenna, Tinsley Jake P., Mayer Ken H., Rosenberg Eric, Pereyra Florencia, Levin Joshua Z., Young Sarah K., Jessen Heiko, Altfeld Marcus, Birren Bruce W., Walker Bruce D., and Allen Todd M.. Whole Genome Deep Sequencing of HIV-1 Reveals the Impact of Early Minor Variants Upon Immune Recognition During Acute Infection. PLOS Pathogens, 8(3):e1002529, March 2012. - PMC - PubMed
    1. Holmes Edward. Novel 2019 coronavirus genome, https://virological.org/t/novel-2019-coronavirus-genome/319/1. January 2020.
    1. Wu Fan, Zhao Su, Yu Bin, Chen Yan-Mei, Wang Wen, Song Zhi-Gang, Hu Yi, Tao Zhao-Wu, Tian Jun-Hua, Pei Yuan-Yuan, Yuan Ming-Li, Zhang Yu-Ling, Dai Fa-Hui, Liu Yi, Wang Qi-Min, Zheng Jiao-Jiao, Xu Lin, Holmes Edward C., and Zhang Yong-Zhen. A new coronavirus associated with human respiratory disease in China. Nature, 579(7798):265–269, March 2020. - PMC - PubMed

Publication types