[Preprint]. 2024 Apr 25:rs.3.rs-4164522.
doi: 10.21203/rs.3.rs-4164522/v1.

STRUCTURE-FUNCTION RELATIONSHIPS OF MUCOCILIARY CLEARANCE IN HUMAN AIRWAYS

Affiliations

STRUCTURE-FUNCTION RELATIONSHIPS OF MUCOCILIARY CLEARANCE IN HUMAN AIRWAYS

Doris Roth et al. Res Sq. .

Update in

Abstract

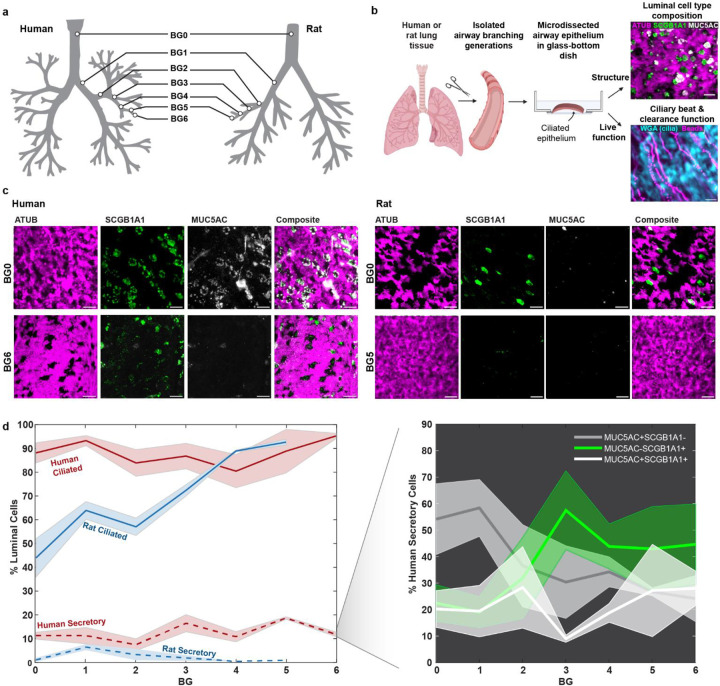
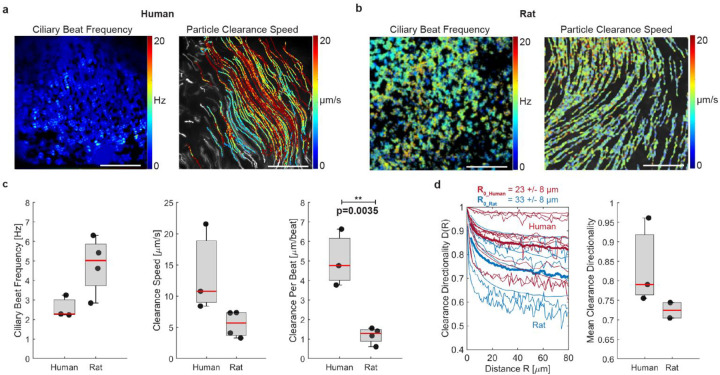
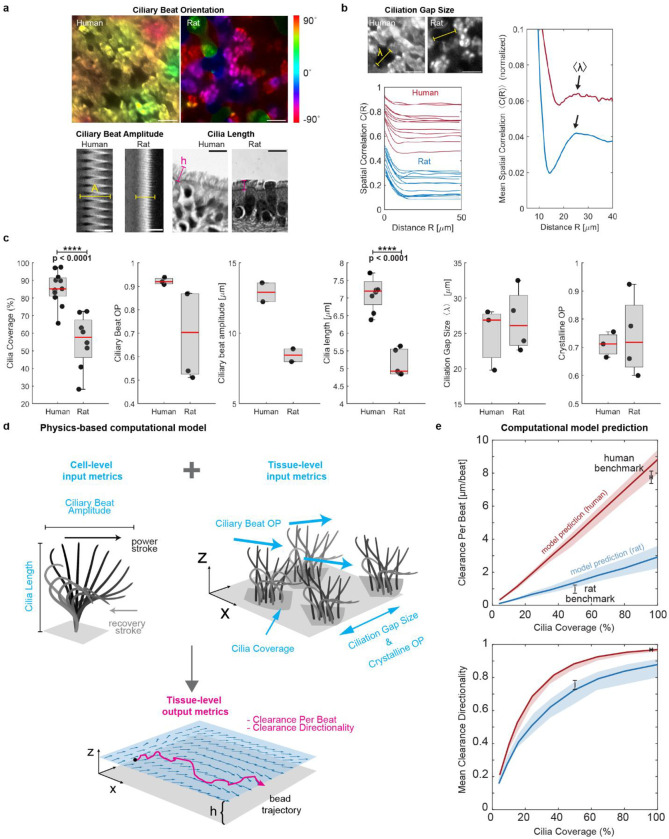
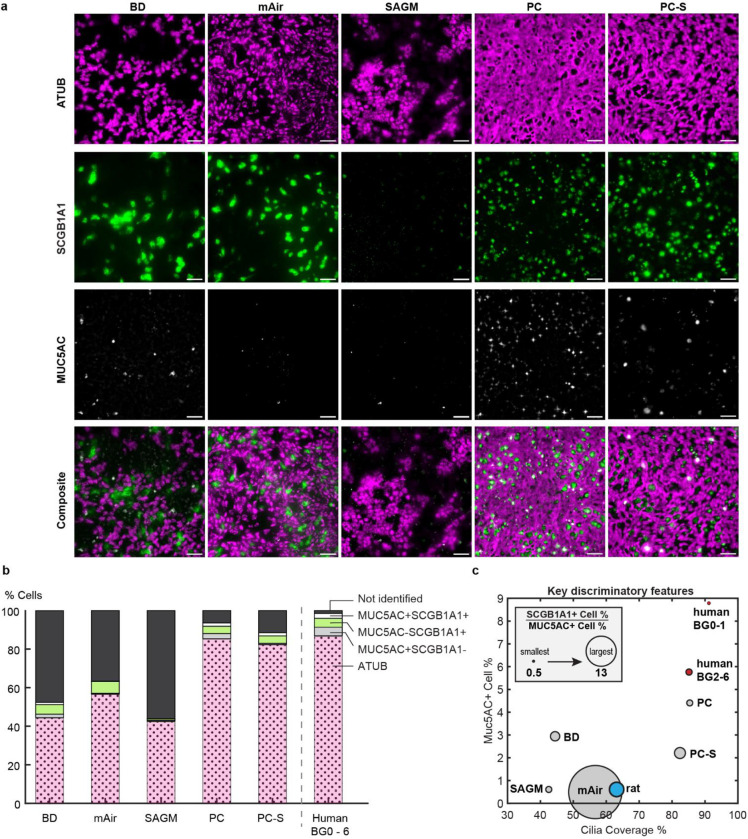
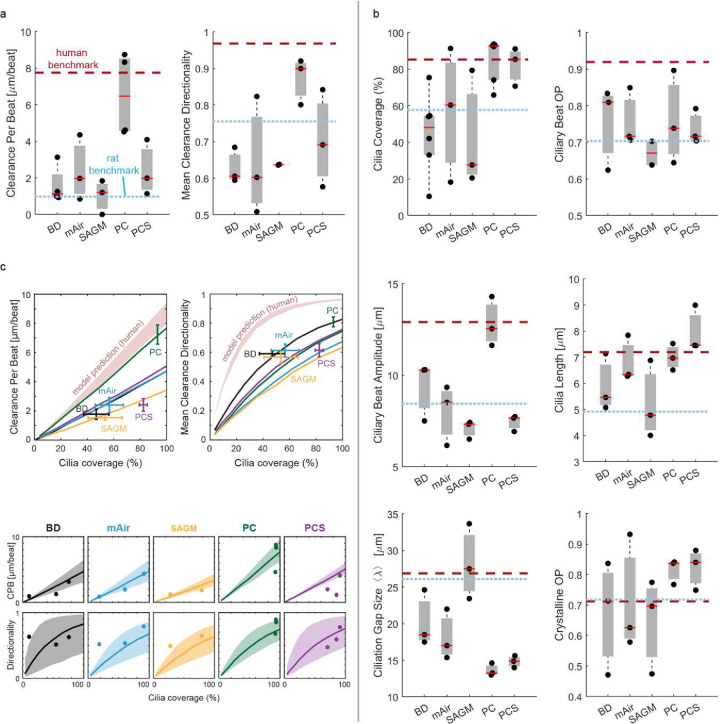
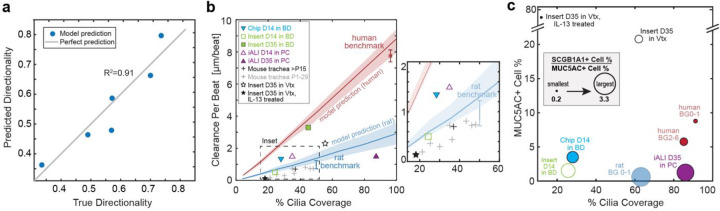
Our study focuses on the intricate connection between tissue-level organization and ciliated organ function in humans, particularly in understanding the morphological organization of airways and their role in mucociliary clearance. Mucociliary clearance is a key mechanical defense mechanism of human airways, and clearance failure is associated with many respiratory diseases, including chronic obstructive pulmonary disease (COPD) and asthma. While single-cell transcriptomics have unveiled the cellular complexity of the human airway epithelium, our understanding of the mechanics that link epithelial structure to clearance function mainly stem from animal models. This reliance on animal data limits crucial insights into human airway barrier function and hampers the human-relevant in vitro modeling of airway diseases. This study, for the first time, maps the distribution of ciliated and secretory cell types along the airway tree in both rats and humans, noting species-specific differences in ciliary function and elucidates structural parameters of airway epithelia that predict clearance function in both native and in vitro tissues alike. By uncovering how tissue organization influences ciliary function, we can better understand disruptions in mucociliary clearance, which could have implications for various ciliated organs beyond the airways.


Conflict of interest statement

COMPETING INTERESTS DECLARATIONS The authors declare no competing interests.

Figures

Figure 1:
Figure 1:. Luminal epithelial cell type composition differs along the human and rat airway tree.
a, Airway branching generations in human and rat investigated in this study included BG0–6 in humans and BG0–5 in rats. b, Workflow for imaging luminal epithelial cell type composition and ciliary beat and clearance function in airway samples. c Example IF staining of cilia (ATUB, magenta) and secretory cells (SCGB1A1, green; MUC5AC, grey) in human and rat airway epithelium in BG0 (trachea) and BG5/6. Scale bar: 20 μm. D, Quantification of luminal cell proportions labeled with ATUB (ciliated cells) or with MUC5AC and/or SCGB1A1 (secretory cells) as a function of airway branching generation in human and rat airway epithelium. Inset: Percentage of human secretory cell population positive for only MUC5AC (grey), only for SCGB1A1 (green), or for both (white) as a function of branching generation. Solid line: mean, shaded region: SEM. For donor numbers and information see Supplementary Tables S1 & S2.
Figure 2:
Figure 2:. Ciliary beat and particle clearance function differ between human and rat airway.
a, Representative measurement of ciliary beat frequency (CBF) and associated particle clearance trajectories and speed in a human airway epithelial sample (BG2). b, Same measurements in rat airway epithelial sample (BG1). c, Quantification of average CBF, particle clearance speed, and clearance per beat (CPB) in human airways BG0–6 and rat airways BG0–1. d, left: Clearance directionality as a function of distance in human (red) and rat (blue) airways. Thick lines are average curves. Right: Mean directionality over a flow distance of 80 μm. Boxplots: Each solid dot is the mean value of one donor (across multiple BGs); red line is median of distribution; significance was assessed with Kruskal–Wallis test.
Figure 3:
Figure 3:. Quantitative analysis of ciliary beat parameters and their impact on clearance function.
a, Cell-level analysis of ciliary beat orientation based on beat trajectories (scalebar: 20 μm), ciliary beat amplitude based on kymograph span (scalebar: 10 μm), and cilia length based on histology sections (scalebar: 10 μm). b, Tissue-level analysis of ciliation gap size λ using spatial correlation function C(R) of ciliated regions in multiple fields of view (left plot) where the first local maximum of the mean correlation curve reveals mean λ (right plot). Scalebar: 20 μm. c, Average cilia coverage, ciliary beat order, ciliary beat amplitude, cilia length, ciliation gap size and crystalline order parameter measured in human BG0–6 and rat BG0–1. Each solid dot is the mean value of one donor (across multiple BGs), red line is median of distribution; significance was assessed with Kruskal–Wallis test. More donors were available for measurements that could be done in fixed tissue. b, Schematic of ciliary input metrics on cell- and tissue-level used to predict output metrics of tissue-level clearance using physics-based computational model. c, Predicted clearance per beat and clearance directionality in human (red, BG0–6) and rat (blue, BG0–1). Solid line represents mean prediction, shaded area shows uncertainty based on spread of input metrics. Black data points and error bars represent experimental human and rat benchmark data (mean ± SEM) indicating a good match of the model predictions.
Figure 4:
Figure 4:. Cell culture media determine in vitro luminal cell type composition.
a, Representative IF-images of primary human airway epithelial cultures from 1 donor grown in different differentiation media for 28 days at ALI and stained for cilia (ATUB, magenta) and secretory cell markers (SCGB1A1, green; MUC5AC, white). Scalebar, 40 μm. b, Average luminal cell type composition based on IF-staining across N=3–6 donors (Supplementary Tables S1 & S2). c, Mapping of IF-staining data of in vitro and ex vivo samples onto three dimensions. y-axis: percentage of MUC5AC+ cells; x-axis: cilia coverage, i.e., percentage of ciliated (ATUB+) cells; circle diameter: ratio of SCGB1A1+ to MUC5AC+ cell percentages.
Figure 5:
Figure 5:. Cell culture media dramatically impact in vitro ciliary beat and clearance function.
a, Quantitative analysis of particle CPB and directionality in primary human airway epithelial cultures of N=3–4 donors grown in different differentiation media for 28 days at ALI compared to human and rat benchmark data. Each solid dot is the mean value of one donor (across multiple BGs), red line is median of distribution. Dotted lines indicate human and rat benchmark values. b, Quantitative analysis of ciliary beat metrics in airway cells cultured and visualized as in (a). c, Predicted CPB and clearance directionality in in vitro cultures (solid lines) compared to predicted human airway performance (red shade). Data points and error bars indicate the particle clearance metrics experimentally measured in each medium (mean ± SEM).
Figure 6:
Figure 6:. Structural and functional benchmarking of the mucociliary machinery.
a, Linear regression model predicting average clearance directionality in human airway epithelia (in vitro and ex vivo) using as input the average values of MUC5AC+ cell percentage, cilia coverage, and ratio of SCGB1A1+ to MUC5AC+ cell percentages. b, Clearance per beat map comparing different human in vitro and rodent ex vivo models to human and rat benchmark data. D, day at ALI; P, postnatal day; Vtx, Vertex ALI medium; iALI, human iPSC-derived differentiated airway epithelium. Proof-of-concept data (iALI, Vtx and Vtx +IL13) are from N=1 donor each; other data was sourced from literature, see methods for details. Red line and shaded region: Human model predictions; blue line and shaded region: rat BG0–1 model predictions. c, Cellular composition map comparing different human in vitro models to human and rat benchmarks with y-axis: percentage of MUC5AC+ cells; x-axis: cilia coverage, i.e., percentage of ciliated (ATUB+) cells; circle diameter: ratio of SCGB1A1+ to MUC5AC+ cell percentages. Data collected as in (b).

References

    1. Wanner A., Salathé M. & O’Riordan T. G. Mucociliary clearance in the airways. Am J Respir Crit Care Med 154, 1868–1902 (1996). - PubMed
    1. Bustamante-Marin X. M. & Ostrowski L. E. Cilia and Mucociliary Clearance. Cold Spring Harb Perspect Biol 9, (2017). - PMC - PubMed
    1. Nawroth J. C., van der Does A. M., Ryan (Firth) A. & Kanso E. Multiscale mechanics of mucociliary clearance in the lung. Philosophical Transactions of the Royal Society B: Biological Sciences 375, 20190160 (2020). - PMC - PubMed
    1. Whitsett J. A. Airway Epithelial Differentiation and Mucociliary Clearance. Annals ATS 15, S143–S148 (2018). - PMC - PubMed
    1. Satir P. & Sleigh M. A. The physiology of cilia and mucociliary interactions. Annual review of physiology 52, 137–155 (1990). - PubMed

Publication types

LinkOut - more resources