[Preprint]. 2024 May 4:2024.05.01.592062.
doi: 10.1101/2024.05.01.592062.

Sliding Window INteraction Grammar (SWING): a generalized interaction language model for peptide and protein interactions

Affiliations

Sliding Window INteraction Grammar (SWING): a generalized interaction language model for peptide and protein interactions

Alisa A Omelchenko et al. bioRxiv. .

Update in

Abstract

The explosion of sequence data has allowed the rapid growth of protein language models (pLMs). pLMs have now been employed in many frameworks including variant-effect and peptide-specificity prediction. Traditionally, for protein-protein or peptide-protein interactions (PPIs), corresponding sequences are either co-embedded followed by post-hoc integration or the sequences are concatenated prior to embedding. Interestingly, no method utilizes a language representation of the interaction itself. We developed an interaction LM (iLM), which uses a novel language to represent interactions between protein/peptide sequences. Sliding Window Interaction Grammar (SWING) leverages differences in amino acid properties to generate an interaction vocabulary. This vocabulary is the input into a LM followed by a supervised prediction step where the LM's representations are used as features. SWING was first applied to predicting peptide:MHC (pMHC) interactions. SWING was not only successful at generating Class I and Class II models that have comparable prediction to state-of-the-art approaches, but the unique Mixed Class model was also successful at jointly predicting both classes. Further, the SWING model trained only on Class I alleles was predictive for Class II, a complex prediction task not attempted by any existing approach. For de novo data, using only Class I or Class II data, SWING also accurately predicted Class II pMHC interactions in murine models of SLE (MRL/lpr model) and T1D (NOD model), that were validated experimentally. To further evaluate SWING's generalizability, we tested its ability to predict the disruption of specific protein-protein interactions by missense mutations. Although modern methods like AlphaMissense and ESM1b can predict interfaces and variant effects/pathogenicity per mutation, they are unable to predict interaction-specific disruptions. SWING was successful at accurately predicting the impact of both Mendelian mutations and population variants on PPIs. This is the first generalizable approach that can accurately predict interaction-specific disruptions by missense mutations with only sequence information. Overall, SWING is a first-in-class generalizable zero-shot iLM that learns the language of PPIs.


Conflict of interest statement

Conflict of Interest The authors declare no conflict of interest.

Figures

Figure 1:
Figure 1:
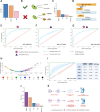
a. Schematic highlighting the difference between existing protein language models (pLMs) and the novelty of interaction language models (iLMs). b. Conceptual overview of the SWING vocabulary generation step. c. Abstract overview of the embedding and classification functions of SWING. Overview of Distributed memory (DM) and Distributed bag of words (DBOW) doc2vec architectures. In the doc2vec models; V is the vocabulary of the interaction language; W is the k-mers embedding matrix; C is the total number of interactions; N is the dimension of the embeddings; W1 is the output layer weight matrix d. Key conceptual innovations of SWING.
Figure 2:
Figure 2:
a. Schematic of the pMHC prediction task adaptation of the SWING framework. b. Representation of the standard Cross Validation (SCV) evaluation metric. c. Depiction of the cross-prediction evaluation metric. d. Class I allele functional clustering as defined by MHCcluster 2.0. Orange, alleles in the training set; magenta, alleles in the validation set; blue, distant allele validation set. e. SWING Class I model performance plotted across 10 replicates of 10-fold cross-validation with permutation testing defined by the area under the receiver operating characteristic curve (AUC-ROC). Blue, validation curve; red, permuted mean; green, Perfect classifier; gray, Random classifier. f. Class I model performance on 3 unseen functionally close alleles in the validation set as defined by the AUC-ROC. Blue, HLA-A02:02; orange, HLA-B40:02; magenta, HLA-C05:01; green, Perfect classifier; gray, Random classifier. g. Class I model cross-prediction performance on 3 unseen functionally distinct alleles in the distant validation set as defined by the AUC-ROC. Blue, HLA-A32:01; orange, HLA-B38:01; magenta, HLA-C03:03; green, Perfect classifier; gray, Random classifier. h. Class II allele functional clustering as defined by MHCcluster 2.0. Orange, alleles in the training set; blue, alleles in the validation set. i. Class II model performance plotted across 10 replicates of 10-fold cross-validation with permutation testing defined by the AUC-ROC. Blue, validation curve; red permuted mean; green, Perfect classifier; gray, Random classifier. j. Class II model cross-prediction performance on 2 unseen alleles in the validation set as defined by the AUC-ROC. Blue, DRB1_0102; orange, DRB1_0404; green, Perfect classifier; gray, Random classifier. For the AUC-ROC plots the shaded regions span +- the standard deviation.
Figure 3:
Figure 3:
a. Schematic of the sequence length modification to the SWING pMHC prediction framework. b. Full sequence Class I model SCV performance with permutation testing defined by the AUC-ROC (left). Blue, validation curve; red, permuted mean; green, Perfect classifier; gray, Random classifier. Full sequence Class I model cross-prediction performance on 3 alleles in the validation set as defined by the AUC-ROC (right). Blue, HLA-A02:02; orange, HLA-B40:02; magenta, HLA-C05:01; green, Perfect classifier; gray, Random classifier. c. Full sequence Class II model SCV performance with permutation testing defined by the AUC-ROC (left). Blue, validation curve; red, permuted mean; green, Perfect classifier; gray, Random classifier. Full sequence Class II model cross-prediction performance 2 alleles in the validation set as defined by the AUC-ROC (right). Blue, DRB1_0102; orange, DRB1_0404; green, Perfect classifier; gray, Random classifier. d. Schematic of the hydrophobic scale modification to the SWING pMHC prediction framework. e. Hydrophobicity score Class I model SCV performance with permutation testing defined by the AUC-ROC (left). Blue, validation curve; red, permuted mean; green, Perfect classifier; gray, Random classifier. Hydrophobicity score Class I model cross-prediction performance on 3 alleles in the validation set as defined by the AUC-ROC (right). Blue, HLA-A02:02; orange, HLA-B40:02; magenta, HLA-C05:01; green, Perfect classifier; gray, Random classifier. f. Hydrophobicity score Class II model SCV performance with permutation testing defined by the AUC-ROC (left). Blue, validation curve; red, permuted mean; green, Perfect classifier; gray, Random classifier. Hydrophobicity score Class II model cross-prediction performance on 2 alleles in the validation set as defined by the AUC-ROC (right). Blue, DRB1_0102; orange, DRB1_0404; green, Perfect classifier; gray, Random classifier. g. Peptide length distribution of the interacting peptides in the Class II datasets defined by percentage. Magenta, training set; blue, DRB1_0102 validation set; orange, DRB1_0404 validation set. h. Peptide length truncation in training and test datasets affects the predictive power of the SWING Class II model as defined by the AUC for each cut-off size in 2 Class II datasets (left). Blue, DRB1_0102; orange, DRB1_0404. i. Visualization of the stratification of the model performance using 4 truncation cut-offs for cross predictions on DRB1_0102 (left), and DRB1_0404 (right) defined by AUC-ROC. Sea green, full length peptides; purple, 16 amino acid (AA) truncation; magenta, 12 AA truncation; yellow, 8 AA truncation. For the AUC-ROC plots the shaded regions span +- the standard deviation.
Figure 4:
Figure 4:
a. Schematic to illustrate the structural differences between the Class I and II MHC receptors. b. SWING Class I model performance for predicting Class II pMHC interactions defined by the AUC-ROC. Blue, DRB1_0102; orange, DRB1_0404 c. Comparison of AUC-ROC between SWING Class I and II models with netMHCpan 4.1, mixMHCpred 2.0, netMHCIIpan 4.2, and mixMHC2pred 2.0 models for predicting Class II pMHC interactions. Blue, netMHCpan models; orange MixMHC2Pred models; magenta SWING models. d. SCV prediction performance of SWING Mixed model (trained with Class I and II pMHC interactions) with permutation testing defined by the AUC-ROC. Blue, validation curve; red, permuted mean; green, perfect classifier; gray, random classifier. e. Prediction performance of SWING Mixed model for predicting Class I pMHC interactions represented by AUC-ROC. Blue, HLA-A02:02; orange, HLA-B40:02; magenta, HLA-C05:01; gray, Random classifier; green, Perfect Classifier. f. Prediction performance of SWING Mixed model for predicting Class II pMHC interactions represented by AUC-ROC. Blue, DRB1_0102; orange, DRB1_0404; gray, Random classifier; green, Perfect classifier. g. Schematic to illustrate the evolutionary distance between Homo sapiens and Mus musculus. h. Performance of the SWING human Class II model for predicting Class II pMHC interactions in mice represented by AUC-ROC. Blue, H-2-IAb; gray, Random Classifier; green, Perfect Classifier i. Performance of the SWING human Mixed model for predicting Class II pMHC interactions in mice represented by AUC-ROC. Blue, H-2-IAb; gray, Random Classifier; green, Perfect Classifier. j. Accuracy scores for H-2-IEk interacting peptides of different lengths for different SWING models, netMHCIIPan 4.2, and MixMHC2Pred 2.0. Blue, SWING Class I model; orange, SWING Class II model; magenta, SWING Mixed class model; green, MixMHC2Pred 2.0; gray, NetMHCIIpan 4.2. k. Accuracy scores for H-2-IAg7 interacting peptides of different lengths for different SWING models, netMHCIIPan 4.2, and MixMHC2Pred 2.0. Blue, SWING Class I model; orange, SWING Class II model; magenta, SWING Mixed model; green, MixMHC2Pred 2.0; gray, NetMHCIIpan 4.2. For the AUC-ROC plots the shaded regions span +- the standard deviation.
Figure 5:
Figure 5:
a. Comparison of interface variants and non-interface variants scores from the state-of-art variant effect prediction (VEP) tools represented as the negative log of the p value. A Mann-Whitney U test was performed for testing statistical significance. Blue, AlphaMissense; Orange, ESM1b; Pink, EVE b. Schematic illustrating the focus of current VEP tools on predicting organismal level pathogenic effect of variants over interaction specific effect. c. Comparison of predictive performance of various VEP tools in predicting interaction specific effects of the variants. Orange, ESM1b; Blue, AlphaMissense; Pink, EVE; Green, Random. d. Schematic explaining the interaction language generation procedure for applying the SWING model to predict the effect of mutations on protein-protein interactions. e. Prediction performance in a standard cross validation setting of SWING trained for predicting the interaction perturbation effect by mendelian missense mutations. Blue, Mendelian disease associated interaction perturbation effects; Red, Permuted classifier; Grey, Random Classifier; Green, Perfect classifier. f. Prediction performance in a standard cross validation setting of SWING trained for predicting the interaction perturbation effect by population variants. Blue, Population variants; Red, Permuted classifier; Grey, Random Classifier; Green, Perfect classifier. g. Prediction performance in a standard cross validation setting of SWING trained for predicting the interaction perturbation effect by population variants and mendelian missense mutations (Mixed). Blue, Mixed variant set; Red, Permuted classifier; Grey, Random Classifier; Green, Perfect classifier. h. Clusters of sequences of variant targeted proteins for the mixed dataset. i. Prediction performance of SWING on predicting the left-out sequence cluster represented through an AUC-ROC. Blue, Validation clusters; Red, Permuted classifier; Grey, Random Classifier; Green, Perfect classifier. The table provides the AUC for each test cluster and the corresponding proximal clusters held out from training. j. Comparison of predictive performance of various VEP tools in predicting interaction specific effects of the variants and SWING. Purple, SWING; Orange, ESM1b; Blue, AlphaMissense; Pink, EVE; Green, Random. k. Schematic representing predicted candidate interaction disrupting variants and the possible downstream effects of these in particular disorders. For the AUC-ROC plots the shaded regions span +- the standard deviation.

References

    1. LeCun Y., Bengio Y. & Hinton G. Deep learning. Nature 521, 436–444 (2015). - PubMed
    1. Madani A. et al. Large language models generate functional protein sequences across diverse families. Nat. Biotechnol. 41, 1099–1106 (2023). - PMC - PubMed
    1. Unsal S. et al. Learning functional properties of proteins with language models. Nature Machine Intelligence 4, 227–245 (2022).
    1. Hie B. L. et al. Efficient evolution of human antibodies from general protein language models. Nat. Biotechnol. 42, 275–283 (2024). - PMC - PubMed
    1. Mock M., Langmead C. J., Grandsard P., Edavettal S. & Russell A. Recent advances in generative biology for biotherapeutic discovery. Trends Pharmacol. Sci. 45, 255–267 (2024). - PubMed

Publication types