

This is a preprint.
Long COVID incidence in adults and children between 2020 and 2023: a real-world data study from the RECOVER Initiative
- PMID: 38746290
- PMCID: PMC11092818
- DOI: 10.21203/rs.3.rs-4124710/v1
Long COVID incidence in adults and children between 2020 and 2023: a real-world data study from the RECOVER Initiative
Update in
-
Long COVID Incidence Proportion in Adults and Children Between 2020 and 2024: An Electronic Health Record-Based Study From the RECOVER Initiative.Clin Infect Dis. 2025 Jul 18;80(6):1247-1261. doi: 10.1093/cid/ciaf046. Clin Infect Dis. 2025. PMID: 39907495
Abstract
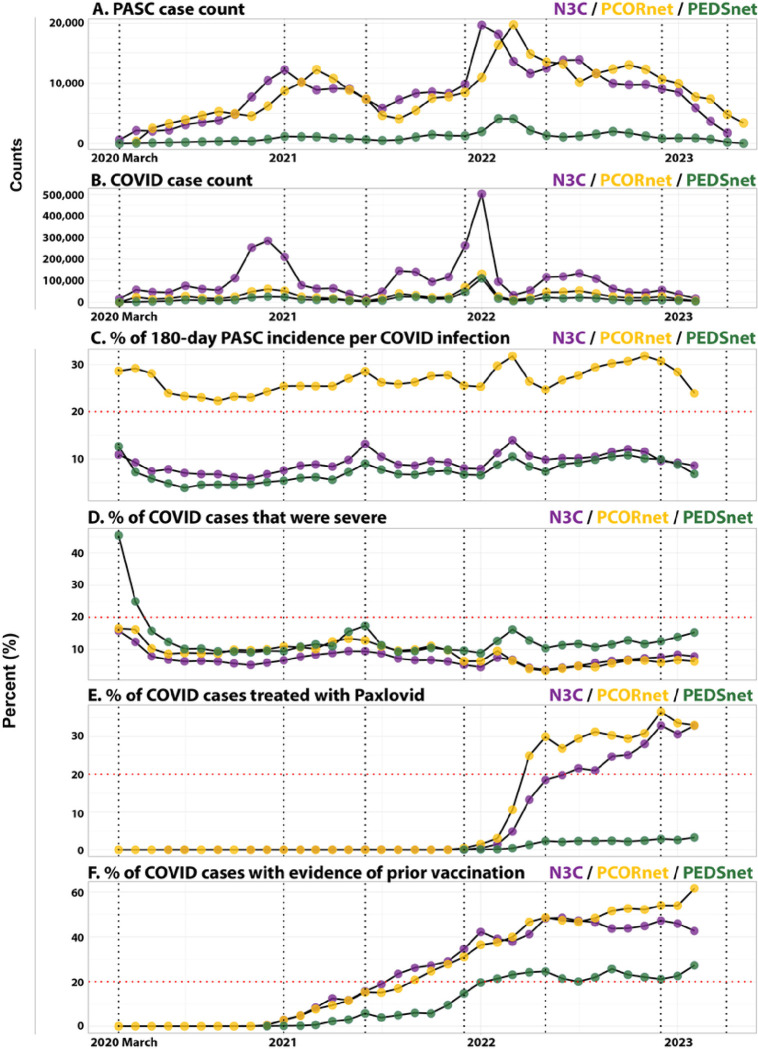
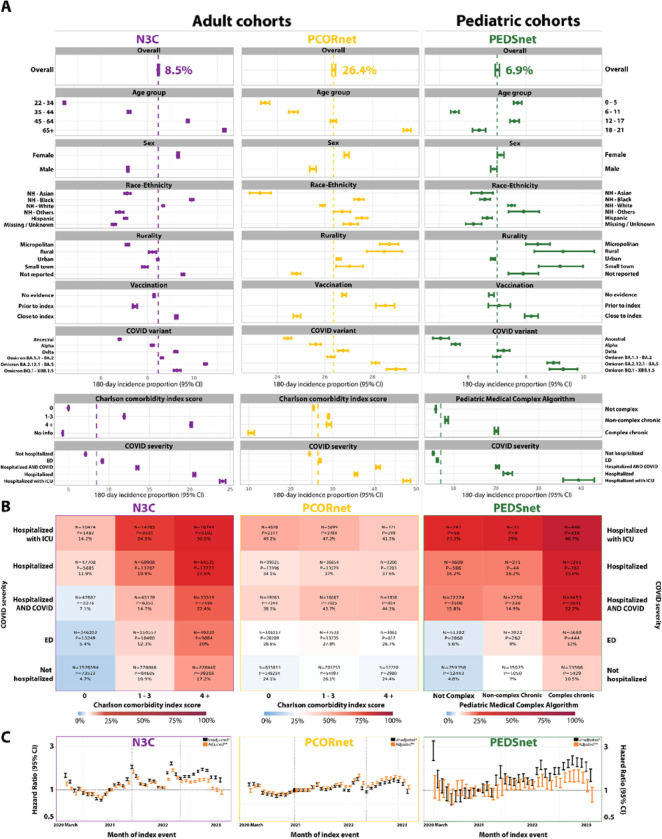
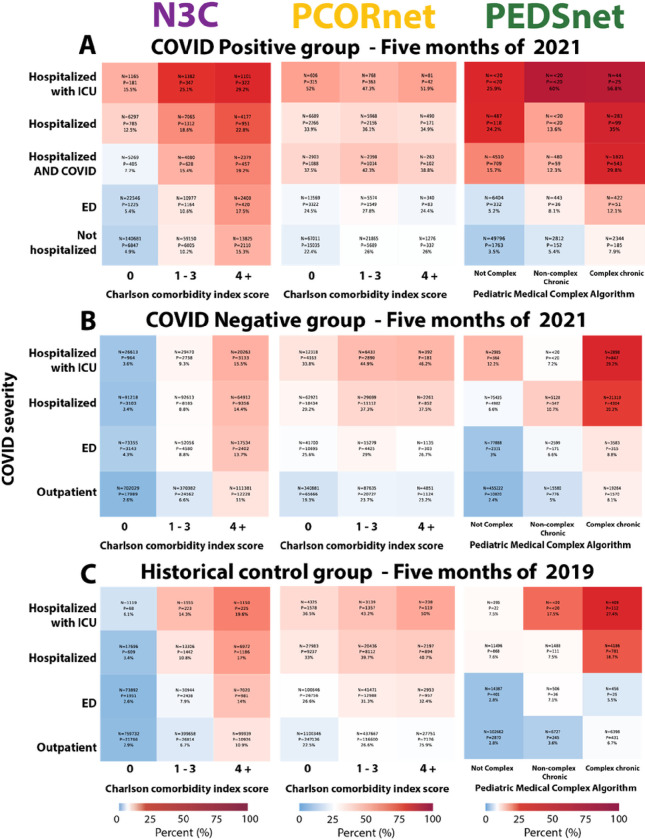
Estimates of post-acute sequelae of SARS-CoV-2 infection (PASC) incidence, also known as Long COVID, have varied across studies and changed over time. We estimated PASC incidence among adult and pediatric populations in three nationwide research networks of electronic health records (EHR) participating in the RECOVER Initiative using different classification algorithms (computable phenotypes). Overall, 7% of children and 8.5%-26.4% of adults developed PASC, depending on computable phenotype used. Excess incidence among SARS-CoV-2 patients was 4% in children and ranged from 4-7% among adults, representing a lower-bound incidence estimation based on two control groups - contemporary COVID-19 negative and historical patients (2019). Temporal patterns were consistent across networks, with peaks associated with introduction of new viral variants. Our findings indicate that preventing and mitigating Long COVID remains a public health priority. Examining temporal patterns and risk factors of PASC incidence informs our understanding of etiology and can improve prevention and management.
Conflict of interest statement
Conflict of Interest Disclosures: No disclosures were reported.
Figures
References
-
- HHS. COVID.gov - What is Long COVID. COVID.gov. Accessed November 17, 2023. https://www.covid.gov/longcovid/definitions
Publication types
Grants and funding
- U54 GM104938/GM/NIGMS NIH HHS/United States
- UL1 TR002649/TR/NCATS NIH HHS/United States
- UL1 TR002548/TR/NCATS NIH HHS/United States
- UL1 TR001433/TR/NCATS NIH HHS/United States
- UL1 TR001422/TR/NCATS NIH HHS/United States
- UL1 TR001860/TR/NCATS NIH HHS/United States
- UL1 TR001427/TR/NCATS NIH HHS/United States
- U54 GM104942/GM/NIGMS NIH HHS/United States
- UL1 TR001420/TR/NCATS NIH HHS/United States
- UL1 TR001439/TR/NCATS NIH HHS/United States
- UL1 TR002243/TR/NCATS NIH HHS/United States
- UL1 TR001445/TR/NCATS NIH HHS/United States
- UL1 TR003096/TR/NCATS NIH HHS/United States
- UL1 TR002537/TR/NCATS NIH HHS/United States
- UL1 TR001857/TR/NCATS NIH HHS/United States
- UL1 TR001412/TR/NCATS NIH HHS/United States
- U54 GM133807/GM/NIGMS NIH HHS/United States
- UL1 TR001872/TR/NCATS NIH HHS/United States
- UL1 TR001878/TR/NCATS NIH HHS/United States
- UL1 TR002529/TR/NCATS NIH HHS/United States
- UL1 TR001863/TR/NCATS NIH HHS/United States
- UL1 TR002494/TR/NCATS NIH HHS/United States
- UL1 TR002736/TR/NCATS NIH HHS/United States
- U54 GM115516/GM/NIGMS NIH HHS/United States
- UL1 TR002369/TR/NCATS NIH HHS/United States
- UL1 TR002541/TR/NCATS NIH HHS/United States
- U54 GM115371/GM/NIGMS NIH HHS/United States
- UL1 TR002001/TR/NCATS NIH HHS/United States
- UL1 TR002538/TR/NCATS NIH HHS/United States
- U54 GM115458/GM/NIGMS NIH HHS/United States
- UL1 TR001442/TR/NCATS NIH HHS/United States
- UL1 TR002535/TR/NCATS NIH HHS/United States
- UL1 TR001866/TR/NCATS NIH HHS/United States
- UL1 TR003167/TR/NCATS NIH HHS/United States
- OT2 HL161847/HL/NHLBI NIH HHS/United States
- UL1 TR001409/TR/NCATS NIH HHS/United States
- UL1 TR001449/TR/NCATS NIH HHS/United States
- UL1 TR001453/TR/NCATS NIH HHS/United States
- UL1 TR002489/TR/NCATS NIH HHS/United States
- U54 GM104940/GM/NIGMS NIH HHS/United States
- UL1 TR003107/TR/NCATS NIH HHS/United States
- UL1 TR003015/TR/NCATS NIH HHS/United States
- UL1 TR002733/TR/NCATS NIH HHS/United States
- U24 TR002306/TR/NCATS NIH HHS/United States
- UL1 TR002003/TR/NCATS NIH HHS/United States
- UL1 TR001876/TR/NCATS NIH HHS/United States
- UL1 TR001436/TR/NCATS NIH HHS/United States
- UL1 TR002378/TR/NCATS NIH HHS/United States
- UL1 TR002384/TR/NCATS NIH HHS/United States
- UL1 TR002553/TR/NCATS NIH HHS/United States
- UL1 TR002389/TR/NCATS NIH HHS/United States
- UL1 TR001414/TR/NCATS NIH HHS/United States
- U54 GM104941/GM/NIGMS NIH HHS/United States
- UL1 TR002014/TR/NCATS NIH HHS/United States
- UM1 TR004528/TR/NCATS NIH HHS/United States
- UL1 TR002550/TR/NCATS NIH HHS/United States
- UL1 TR002319/TR/NCATS NIH HHS/United States
- UL1 TR001855/TR/NCATS NIH HHS/United States
- UL1 TR001425/TR/NCATS NIH HHS/United States
- UL1 TR002373/TR/NCATS NIH HHS/United States
- UL1 TR002240/TR/NCATS NIH HHS/United States
- UL1 TR002556/TR/NCATS NIH HHS/United States
- UL1 TR003017/TR/NCATS NIH HHS/United States
- UL1 TR001998/TR/NCATS NIH HHS/United States
- UL1 TR001873/TR/NCATS NIH HHS/United States
- UL1 TR001881/TR/NCATS NIH HHS/United States
- UL1 TR002645/TR/NCATS NIH HHS/United States
- UL1 TR001450/TR/NCATS NIH HHS/United States
- UL1 TR002366/TR/NCATS NIH HHS/United States
- U54 GM115428/GM/NIGMS NIH HHS/United States
- UL1 TR002345/TR/NCATS NIH HHS/United States
- UL1 TR002377/TR/NCATS NIH HHS/United States
- U54 GM115677/GM/NIGMS NIH HHS/United States
- UL1 TR002544/TR/NCATS NIH HHS/United States
- UL1 TR003098/TR/NCATS NIH HHS/United States
- UL1 TR001430/TR/NCATS NIH HHS/United States
- UL1 TR003142/TR/NCATS NIH HHS/United States
LinkOut - more resources
Full Text Sources
Miscellaneous
