[Preprint]. 2024 May 1:2024.04.30.591752.
doi: 10.1101/2024.04.30.591752.

Single-cell transcriptomics reveals evolutionary reconfiguration of embryonic cell fate specification in the sea urchin Heliocidaris erythrogramma

Affiliations

Single-cell transcriptomics reveals evolutionary reconfiguration of embryonic cell fate specification in the sea urchin Heliocidaris erythrogramma

Abdull J Massri et al. bioRxiv. .

Update in

Abstract

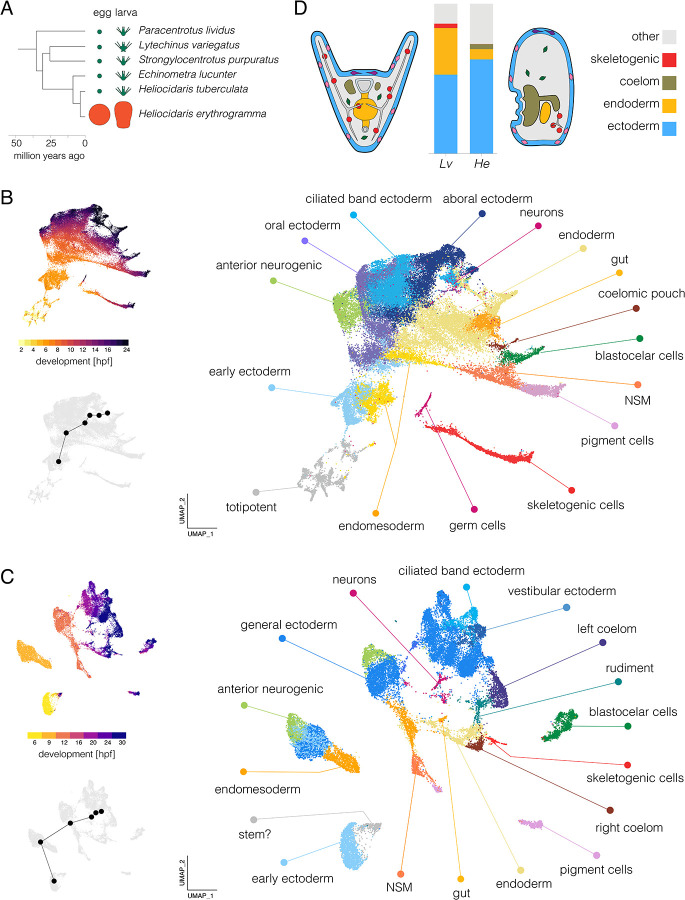
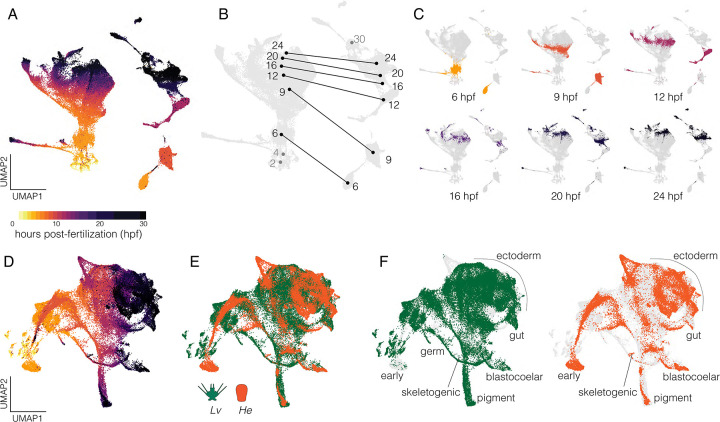
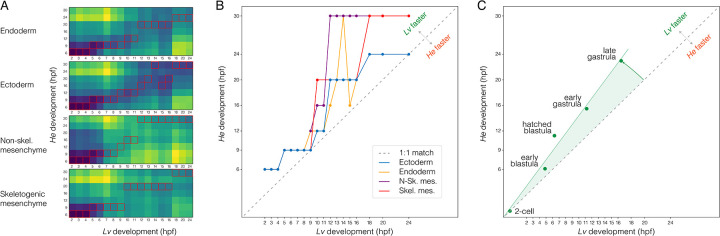
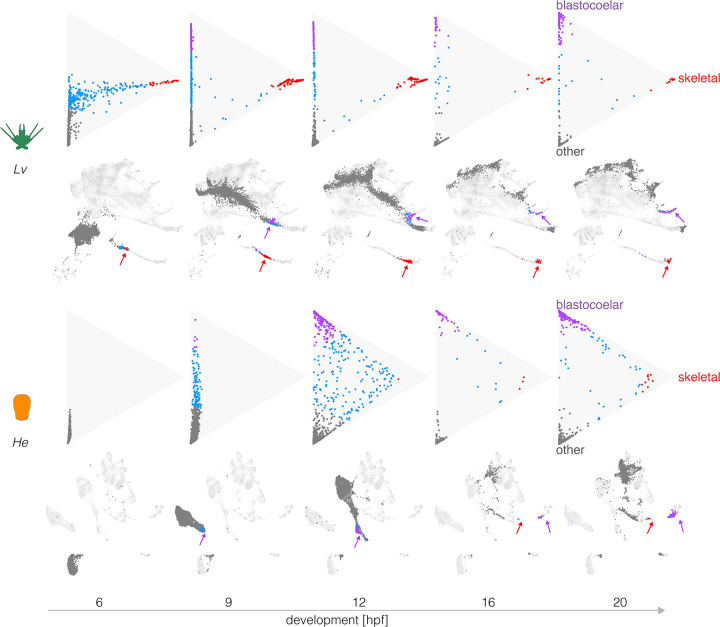
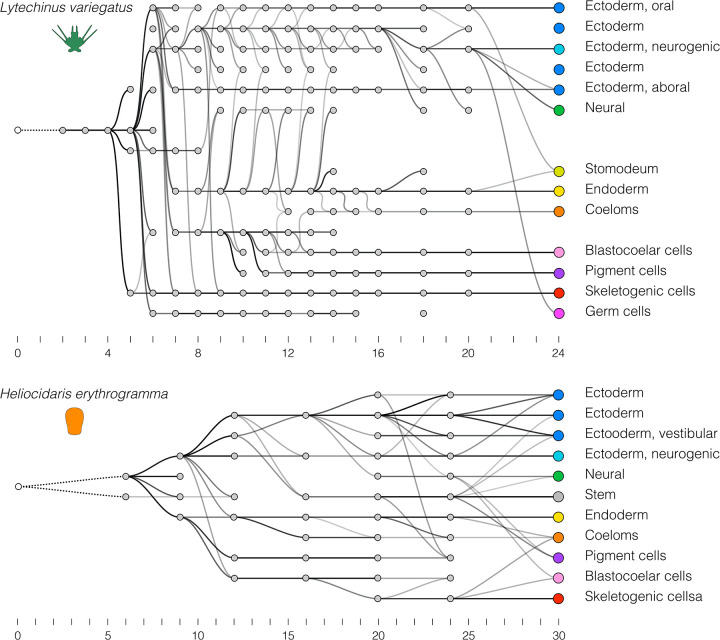
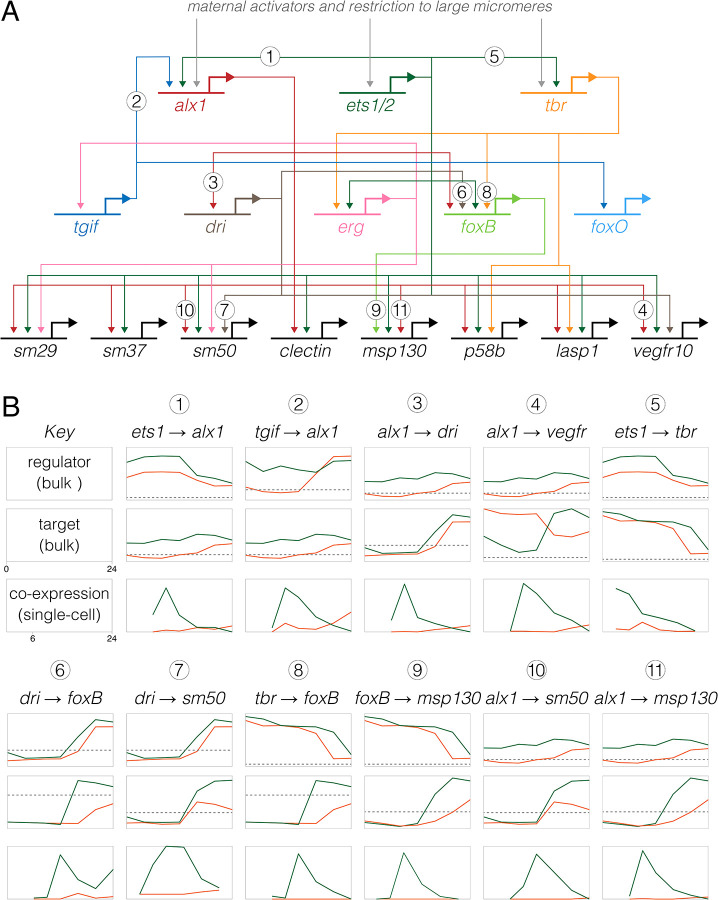
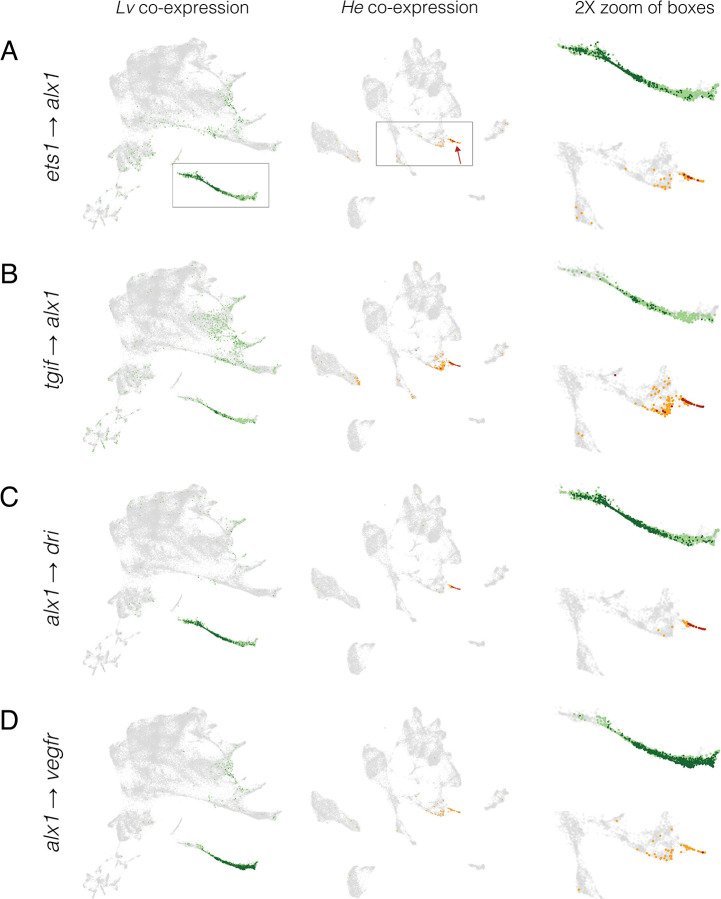
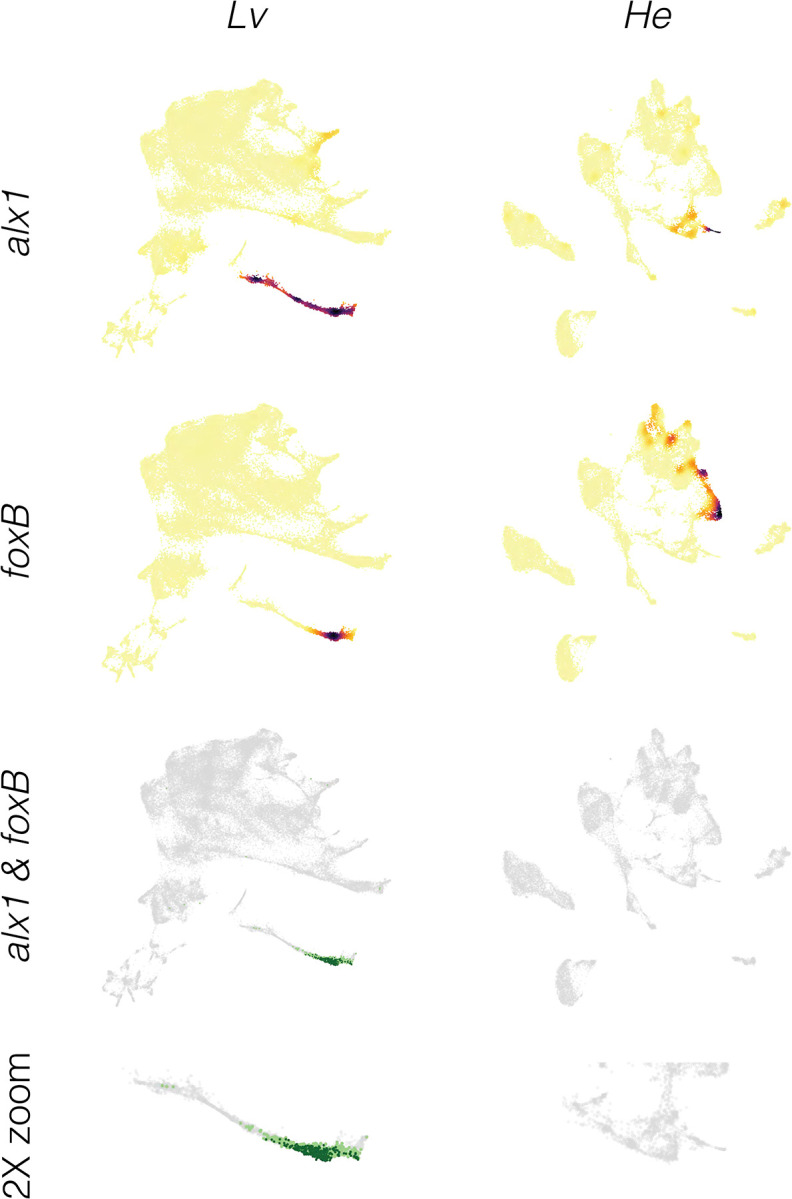
Altered regulatory interactions during development likely underlie a large fraction of phenotypic diversity within and between species, yet identifying specific evolutionary changes remains challenging. Analysis of single-cell developmental transcriptomes from multiple species provides a powerful framework for unbiased identification of evolutionary changes in developmental mechanisms. Here, we leverage a "natural experiment" in developmental evolution in sea urchins, where a major life history switch recently evolved in the lineage leading to Heliocidaris erythrogramma, precipitating extensive changes in early development. Comparative analyses of scRNA-seq developmental time courses from H. erythrogramma and Lytechinus variegatus (representing the derived and ancestral states respectively) reveals numerous evolutionary changes in embryonic patterning. The earliest cell fate specification events, and the primary signaling center are co-localized in the ancestral dGRN but remarkably, in H. erythrogramma they are spatially and temporally separate. Fate specification and differentiation are delayed in most embryonic cell lineages, although in some cases, these processes are conserved or even accelerated. Comparative analysis of regulator-target gene co-expression is consistent with many specific interactions being preserved but delayed in H. erythrogramma, while some otherwise widely conserved interactions have likely been lost. Finally, specific patterning events are directly correlated with evolutionary changes in larval morphology, suggesting that they are directly tied to the life history shift. Together, these findings demonstrate that comparative scRNA-seq developmental time courses can reveal a diverse set of evolutionary changes in embryonic patterning and provide an efficient way to identify likely candidate regulatory interactions for subsequent experimental validation.


Figures

Figure 1.
Figure 1.. Single-cell developmental transcriptomes.
A. Time-tree of sea urchin species with high quality reference genomes. Egg and larva sizes approximately to scale; green indicates the ancestral life history with small eggs and feeding larvae (planktotrophy) and orange the derived life history with large eggs and non-feeding larvae (lecithotrophy). Egg and larva sizes from Mortensen 1921, Emlet et al. 1987, Williams and Anderson 1975; topology from Láruson 2016; divergence times from Ziegler et al. 2003 and Láruson 2016. B. UMAPs of scRNA-seq developmental time course for Lv. The large plot shows cells color-coded by cluster and labelled according to inferred cell types; the two smaller plots show cells color coded by time point (upper) and the centroids of the six time points common to both species (lower plot). C. UMAPS of scRNA-seq developmental time course for He. Organization parallels panel B. For individual marker gene expression, see Figure S2. Clusters in panels B and C are colored with the same encoding to facilitate comparison between species (some cell types are present only in one species or the other). D. Comparison of cell type proportions and larval morphology. Proportions of four cell types in 24 hpf larvae (see Tables S1 and S2 for cell counts at all stages). Simplified diagrams of larvae are not to scale; colors match bar plot.
Figure 2.
Figure 2.. Combined single-cell transcriptomes.
A. UMAP of combined data from all gene models from both species without integration and cells colored according to developmental stage. The mass on the left is composed exclusively of cells from Lv while the more fragmented clumps on the right are composed exclusively of cells from He. B. Same plot, showing centroids of cells across developmental stages with lines connecting the same time points between species. Numbers correspond to hours post-fertilization (hpf); grey numbers refer to stages sampled in one species only. C. Individual UMAPs of shared time points with cells colored according to stage (same encoding as panel A). D. UMAP of integrated data from both species incorporating gene models of 1:1 orthologues only. Cells colored by stage (same encoding as panel A). E. Same plot with cells colored by species. F. Same plot as panel E with each species shown separately and cell identities labeled; light gray cells are from the complementary species.
Figure 3.
Figure 3.. Temporal shifts in transcriptomes.
A. Heatmaps showing degree of similarity among scRNA-seq transcriptomes (1:1 orthologues only) for four different embryonic cell lineages. Assignment of cells to lineages is based on optimal transport (see Methods). Red boxes indicate the most similar time point of He for each time point of Lv. B. Line plots showing developmental time of best matches among transcriptomes in panel A. Note the overall delay in He, with most points above the line defined by a slope of 1. C. Line plot showing developmental time of morphogenetic events. Again, there is an overall delay in He.
Figure 4.
Figure 4.. Evolutionary changes in timing of differentiation.
Optimal transport was used to predict the likely fate for each cell at five stages, based on transcriptomes at 24 hpf (see Methods). Triangle plots show transcriptomes predictive of blastocoelar cell (green), skeletogetogenic cell (red), or any other cell fate (dark gray); cells with undifferentiated transcriptomes are shown in blue. Corresponding UMAPs are shown below. Note the much earlier differentiation of skeletogenic cells in Lv and the slightly earlier differentiation of blastocoelar cells in He. See text for additional interpretation.
Figure 5.
Figure 5.. Evolutionary changes in overall transcriptional trajectories.
Optimal transport was used to identify “ancestors” for each cell cluster, starting with the final time point (unlike Figure 4, where transcriptomes of individual cells are measured against those of differentiated cells). These trajectories reflect the progressive divergence of transcriptomes among cells during development, and thus are an indirect reflection of cell lineages. A. Transcriptional trajectory of Lv. B. Transcriptional trajectory of He.
Figure 6.
Figure 6.. Inference of evolutionary changes in regulatory interactions based on proportion of co-expressing cells.
A. Simplified version of the skeletogenic portion of the ancestral dGRN present in camarodont sea urchins with feeding larvae (based on Kurokawa et al. 1999; Oliveri et al. 2002, Ettensohn et al. 2003; Oliveri et al. 2008; Rafiq 2012; Rafiq 2014). The three primary activators of skeletogenic-specific transcription (top) feed directly or indirectly into a large set of effector genes, some of which are illustrated (bottom). B. Co-expression analysis of 11 experimentally validated regulatory interactions, where Lv = green lines and He = orange lines. Numbers correspond to interactions in panel A) The top two plots for each interaction show expression of regulator and target based on bulk RNAseq (Israel et al., 2016), with a log2 y-axis and the dashed line indicating very low expression (an average of 5 counts per million reads across time points). The plot directly below shows the proportion of cells that co-express both genes based on scRNA-seq, with a linear y-axis; these time-points begin a 6 hpf, the first time point common to both data sets. Note that y-axes are not equivalently scaled because genes have a wide range of expression and co-expression levels. Most gene pairs show a strong peak of co-expression at 9 hpf in Lv, which then drops as skeletogenic cells stop dividing while other cell lineages continue to proliferate. In contrast, this peak is notably absent in He; instead, co-expression is initially zero or very low at 9 hpf and rises modestly 16–24 hpf.
Figure 7.
Figure 7.. Inference of evolution changes in regulatory interactions based on distribution of co-expressing cells.
Co-expression analysis of experimentally validated regulatory interactions. UMAPs show the location of cells with co-expression of indicated regulator and target. Lv = green dots and He = orange dots; dark colors indicate cells with >2 UMIs for both regulator and target gene; pale colors indicate low co-expressing cells, where one or both genes have 1 or 2 UMIs. Boxes indicate areas shown at 2X in the right-hand column and arrows indicate skeletogenic cells.
Figure 8.
Figure 8.. Inference of evolutionary loss of a regulatory interaction.
A. Density plots showing expression of regulator (alx1) and target (foxB) genes in both species. Note that both alx1 and foxB transcripts are readily detected in both species. B. Co-expression plots. The complete absence of co-expression in He suggests that the ancestral alx1foxB regulatory interaction has been lost in this species.

References

    1. Alvarez-Campos P., Garcia-Castro H., Emili E., Perez-Posada A., Salamanca-Diaz D.A., Mason V., Metzger B., Bely A.E., Kenny N., Ozpolat B.D., Solana J., 2023. Annelid adult cell type diversity and their pluripotent cellular origins. bioRxiv. - PMC - PubMed
    1. Angerer L.M., Yaguchi S., Angerer R.C., Burke R.D., 2011. The evolution of nervous system patterning: insights from sea urchin development. Development 138: 3613–3623. - PMC - PubMed
    1. Arshinoff B.I., Cary G.A., Karimi K., Foley S., Agalakov S., Delgado F., Lotay V.S., Ku C.J., Pells T.J., Beatman T.R., Kim E., Cameron R.A., Vize P.D., Telmer C.A., Croce J.C., Ettensohn C.A., Hinman V.F., 2021. Echinobase: leveraging an extant model organism database to build a knowledgebase supporting research on the genomics and biology of echinoderms. Nucleic Acids Res 50(D1): D970–D979. - PMC - PubMed
    1. Bessodes N., Haillot E., Duboc V., Rottinger E., Lahaye F., Lepage T., 2012. Reciprocal signaling between the ectoderm and a mesendodermal left-right organizer directs left-right determination in the sea urchin embryo. PLoS Genet 8: e1003121. - PMC - PubMed
    1. Bisgrove B.W., Raff R.A., 1989. Evolutionary conservation of the larval serotonergic nervous system in a direct developing sea urchin. Dev Growth Differ 31: 363–370. - PubMed

Publication types