[Preprint]. 2024 Jul 19:2024.04.30.587787.
doi: 10.1101/2024.04.30.587787.

Molecular basis for plasma membrane recruitment of PI4KA by EFR3

Affiliations

Molecular basis for plasma membrane recruitment of PI4KA by EFR3

Sushant Suresh et al. bioRxiv. .

Update in

  • Molecular basis for plasma membrane recruitment of PI4KA by EFR3.
    Suresh S, Shaw AL, Pemberton JG, Scott MK, Harris NJ, Parson MAH, Jenkins ML, Rohilla P, Alvarez-Prats A, Balla T, Yip CK, Burke JE. Suresh S, et al. Sci Adv. 2024 Dec 20;10(51):eadp6660. doi: 10.1126/sciadv.adp6660. Epub 2024 Dec 20. Sci Adv. 2024. PMID: 39705356 Free PMC article.

Abstract

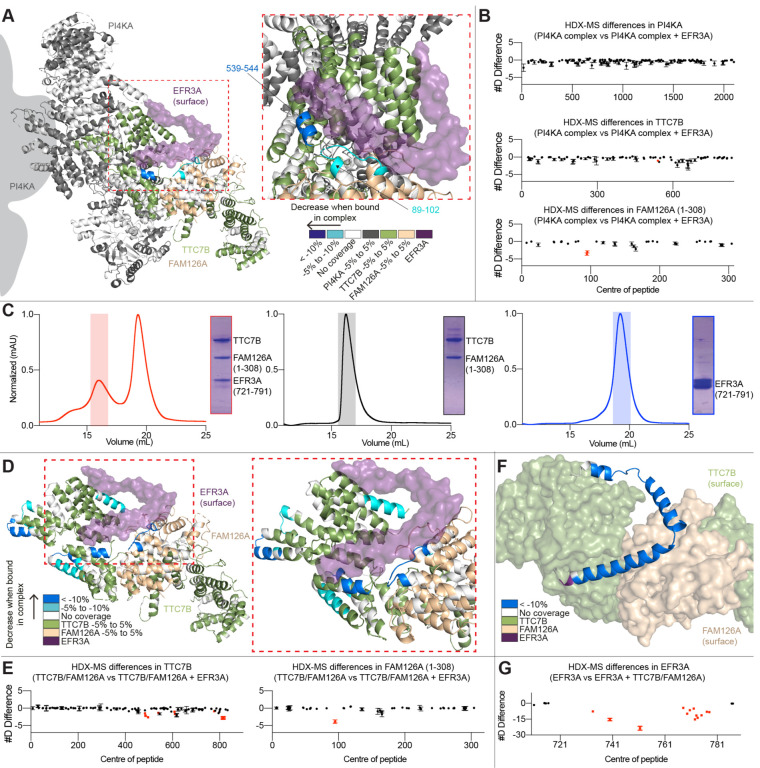
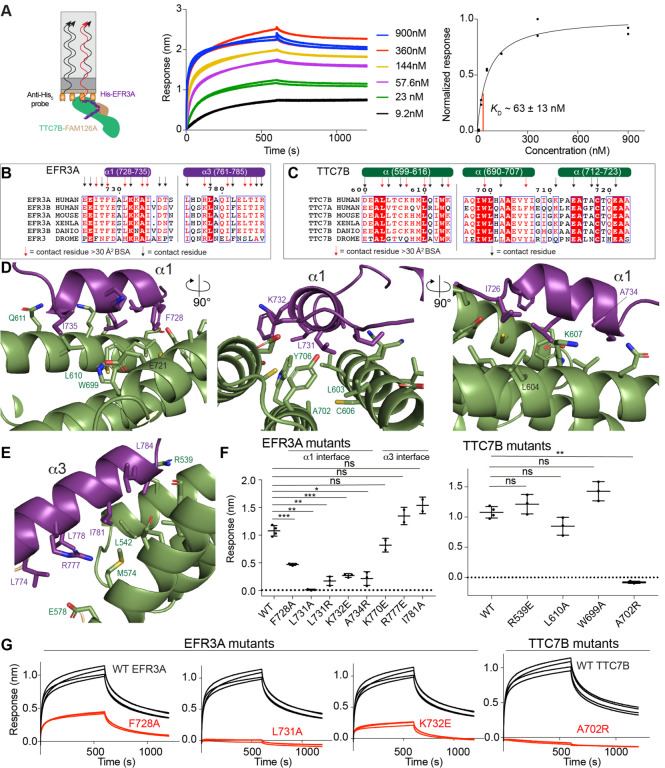
The lipid kinase phosphatidylinositol 4 kinase III alpha (PI4KIIIa/PI4KA) is a master regulator of the lipid composition and asymmetry of the plasma membrane. PI4KA exists primarily in a heterotrimeric complex with its regulatory proteins TTC7 and FAM126. Fundamental to PI4KA activity is its targeted recruitment to the plasma membrane by the lipidated proteins EFR3A and EFR3B. Here, we report a cryo-EM structure of the C-terminus of EFR3A bound to the PI4KA-TTC7B-FAM126A complex, with extensive validation using both hydrogen deuterium exchange mass spectrometry (HDX-MS), and mutational analysis. The EFR3A C-terminus undergoes a disorder-order transition upon binding to the PI4KA complex, with an unexpected direct interaction with both TTC7B and FAM126A. Complex disrupting mutations in TTC7B, FAM126A, and EFR3 decrease PI4KA recruitment to the plasma membrane. Multiple post-translational modifications and disease linked mutations map to this site, providing insight into how PI4KA membrane recruitment can be regulated and disrupted in human disease.


Conflict of interest statement

Competing Interests J.E.B. reports personal fees from Scorpion Therapeutics and Reactive therapeutics; and research contracts from Novartis and Calico Life Sciences.

Figures

Figure 1.
Figure 1.. Cryo-EM analysis of EFR3 binding to the PI4KA complex
A. Domain schematics of the full-length PI4KA complex and EFR3A constructs used in this paper. Constructs used in this paper are PI4KA/TTC7B/FAM126A ΔC (referred to as PI4KA complex) and EFR3A (721–791) referred to as EFR3A. B. Size exclusion chromatography traces of (L) PI4KA complex/EFR3A, (M) PI4KA complex, and (R) EFR3A, with corresponding SDS-PAGE gels to show protein present in the highlighted size exclusion chromatography (SEC) peaks. C. Cryo-EM density map of the PI4KA complex bound to EFR3A. EFR3A was bound to both sides of the hetero-trimer, however, the full triple helical V was only visible in one of the two dimers of hetero-tetramers (see left side of the molecule in the top panel). D. Molecular model of the triple helical V in the C-terminus of EFR3A (724–787) bound to the PI4KA complex, with a zoom-in highlighting EFR3A contacts with both TTC7B and FAM126A.
Figure 2:
Figure 2:. HDX-MS analysis of the interaction of EFR3A with TTC7B and FAM126A
A. Residues showing significant differences in deuterium exchange (defined as >5% 0.45 Da, and p<0.01 in an unpaired two-tailed t-test at any time point) upon PI4KA complex binding to EFR3A. Differences are mapped on a structural model of the high local resolution half, with a zoom-in on the interface. Differences are indicated by the legend. B. Sum of the number of deuteron differences of PI4KA complex upon formation with EFR3A analysed over the entire deuterium exchange time course for the PI4KA complex. Each point is representative of the centre residue of an individual peptide. Peptides that met the significance criteria described in A are coloured red. Error is shown as the sum of standard deviations across all 4 time points (SD) (n=3 for each condition in each timepoint). C. Size exclusion chromatography traces of (L) TTC7B-FAM126A ΔC -EFR3A, (M) TTC7B-FAM126A ΔC, and (R) EFR3A, with corresponding SDS-PAGE gels to show protein present in the highlighted SEC peaks. D. TTC7B-FAM126A residues showing significant differences in deuterium exchange (defined as >5% 0.45 Da, and p<0.01 in an unpaired two-tailed t-test at any time point) upon formation of the TTC7B-FAM126A-EFR3A complex. Differences are mapped on a structural model of the high local resolution half removing PI4KA, with a zoom in on the interface. Differences are indicated by the legend. E. Sum of the number of deuteron differences of TTC7B and FAM126A upon complex formation with EFR3A analysed over the entire deuterium exchange time course for the dimer. Each point is representative of the centre residue of an individual peptide. Peptides that met the significance criteria described in D are coloured red. Error is shown as the sum of standard deviations across all 5 time points (SD) (n=3 for each condition in each timepoint). F. EFR3A residues showing significant differences in deuterium exchange (defined as >5% 0.45 Da, and p<0.01 in an unpaired two-tailed t-test at any time point) upon formation of the TTC7B-FAM126A-EFR3A complex. Differences are mapped on a structural model of the high local resolution half removing PI4KA zooming in on the interface. Differences are indicated by the legend. The construct used has overlapping MBP peptides that do not contain EFR3A residues, therefore peptides that start before 721 are not EFR3A sequence. G. Sum of the number of deuteron differences of EFR3A upon complex formation with TTC7B-FAM126A analysed over the entire deuterium exchange time course for the EFR3A. Each point is representative of the centre residue of an individual peptide. Peptides that met the significance criteria described in F are coloured red. Error is shown as the sum of standard deviations across all 4 time points (SD) (n=3 for each condition in each timepoint). Individual deuterium exchange curves for significant differences for all conditions are shown in Supplemental Fig 4.
Figure 3:
Figure 3:. Molecular basis of EFR3A binding to TTC7B
A. Cartoon schematic (L) of a bio-layer interferometry (BLI) experiment showing binding of immobilized His-EFR3A (721–791) to TTC7B-FAM126A. Association and dissociation curves (M) for the binding of His-EFR3A (721–791) to different concentrations of TTC7B-FAM126A (10–2500 nM). The experiment was carried out in duplicate, with all data shown. Normalized BLI response versus concentration of TTC7B-FAM126A (R), with KD estimated by one site specific non-linear regression. Each data point is shown (n=2). B. Multiple sequence alignment of EFR3A from Homo sapiens, Mus musculus, Xenopus laevis, Danio rerio, Drosophila melanogaster. EFR3A secondary structure of α1 and α3 helices are annotated above the alignment. Contact residues within 6 Å of TTC7B are annotated using arrows. Contact residues with BSA > 30 Å2 are annotated using red arrows. C. Multiple sequence alignment of TTC7B from Homo sapiens, Mus musculus, Xenopus laevis, Danio rerio, Drosophila melanogaster. TTC7B secondary structure is annotated above the alignment. Contact residues within 6 Å of EFR3A are annotated using arrows. Contact residues with BSA > 30 Å2 are annotated using red arrows. D. Zoomed in cartoon view of the EFR3A α1-TTC7B interface with putative interfacial residues labelled. EFR3A and TTC7B are coloured according to in-figure text. E. Zoomed in cartoon view of the EFR3A α3-TTC7B interface with putative interfacial residues labelled. EFR3A and TTC7B are coloured according to in-figure text. F. Maximum BLI response of various EFR3A and TTC7B mutants compared to WT. Error is shown as standard deviation (n=3) with two-tailed p values indicated as follows: **p<0.001; ***p<0.0001; not significant (ns) > 0.01. G. Raw BLI association and dissociation curves of EFR3A and TTC7B mutants compared to WT. His-EFR3A was loaded on the anti-penta-His tip at 200 nM and dipped in TTC7B-FAM126A at 500 nM. Raw BLI curves of all mutants in Supplemental Fig 5.
Figure 4.
Figure 4.. Mutational analysis validates the EFR3A-FAM126A binding interface
A. Multiple sequence alignment of EFR3A from Homo sapiens, Mus musculus, Xenopus laevis, Danio rerio and Drosophila melanogaster. EFR3A secondary structure of α2 and α3 helices are annotated above the alignment. Contact residues within 5 Å of FAM126A are annotated using arrows. Contact residues with BSA > 30 Å2 are annotated using red arrows. B. Multiple sequence alignment of FAM126A from Homo sapiens, Mus musculus, Danio rerio, Drosophila melanogaster and Caenorhabditis elegans. FAM126A secondary structure is annotated above the alignment. Contact residues within 5 Å of EFR3A are annotated using arrows. Contact residues with BSA > 30 Å2 are annotated using red arrows. C. Zoomed in cartoon view of the EFR3A-FAM126A interface with putative interfacial residues labelled. EFR3A and FAM126A are coloured according to in-figure text. D. Maximum BLI response of various EFR3A and FAM126A mutants compared to WT. Error is shown as standard deviation (n=3) with p values indicated as follows: *p<0.01; **p<0.001; ***p<0.0001; not significant (ns) > 0.01. E. Raw BLI association and dissociation curves of EFR3A and FAM126A mutants compared to WT. His-EFR3A was loaded on the anti-penta-His tip at 200 nM and dipped in TTC7B-FAM126A at 500 nM. Raw BLI curves of all mutants in Supplemental Fig 5.
Figure 5.
Figure 5.. The C-terminus of EFR3A mediates plasma membrane recruitment of PI4KA
A. Cartoon depicting the quantitative BRET-based PI4KA recruitment assay. Briefly, the PM-anchored BRET acceptor (L10-mVenus) will only be near the nLuc-tagged PI4KA BRET-donor, and thereby efficiently increase the relative BRET signal, if co-assembled with the requisite molecular partners for PM targeting. B. Normalized BRET signal measured from HEK293A cell populations (~0.75 × 10⁵ cells/well) expressing a fixed amount of the PM-PI4KABRET biosensor (L10-mVenus-tPT2A-NLuc-PI4KA; 500 ng/well) together with increasing amounts (100, 500, or 1000 ng/well) of constructs consisting of either an empty vector (black), wild-type control (red; EFR3B-P2A-TTC7B-T2A-FAM126A), or the indicated mutants of the PI4KA complex components (blue, EFR3B Δc-term(1–716)-P2A-TTC7B-T2A-FAM126A; green, EFR3BL726A,F751A-P2A-TTC7B-T2A-FAM126A; grey, EFR3B-P2A-TTC7BA702R-T2A-FAM126A; and, magenta, EFR3B-P2A-TTC7B-T2A-FAM126AA103R). For all treatments, BRET values were normalized relative to an internal basal BRET control (PM-PI4KABRET biosensor expressed without the empty vector or EFR3B-P2A-TTC7B-T2A-FAM126A plasmid added) and are presented as the summary of triplicate wells measured for each treatment condition in three independent biological replicates (n = 3, with normalized signals from 9 total wells averaged). Normalized BRET signals were then expressed and graphed as fold-increases relative to the 100 ng/well pcDNA3.1 control. C. Representative confocal images of live HEK293A cells co-expressing a fixed amount (250 ng) of EGFP-PI4KA (greyscale) together with the indicated constructs (500 ng/each). The sequence and colour-coding of the experimental treatments are matched with the BRET measurements in (B).

References

    1. Balla T., Phosphoinositides: tiny lipids with giant impact on cell regulation. Physiol. Rev. 93, 1019–1137 (2013). - PMC - PubMed
    1. Burke J. E., Triscott J., Emerling B. M., Hammond G. R. V., Beyond PI3Ks: targeting phosphoinositide kinases in disease. Nat Rev Drug Discov, 1–30 (2022). - PMC - PubMed
    1. Hammond G. R. V., Burke J. E., Novel roles of phosphoinositides in signaling, lipid transport, and disease. Curr Opin Cell Biol 63, 57–67 (2020). - PMC - PubMed
    1. Batrouni A. G., Baskin J. M., The chemistry and biology of phosphatidylinositol 4-phosphate at the plasma membrane. Bioorg Med Chem 40, 116190 (2021). - PMC - PubMed
    1. Nakatsu F., Baskin J. M., Chung J., Tanner L. B., Shui G., Lee S. Y., Pirruccello M., Hao M., Ingolia N. T., Wenk M. R., De Camilli P., PtdIns4P synthesis by PI4KIIIα at the plasma membrane and its impact on plasma membrane identity. J. Cell Biol. 199, 1003–1016 (2012). - PMC - PubMed

Publication types