. 2024 Apr 30;15(5):706-713.
doi: 10.1021/acsmedchemlett.4c00099. eCollection 2024 May 9.

Synthesis and in Vitro Evaluation of CAPE Derivatives as Ferroptosis Inducers in Triple Negative Breast Cancer

Affiliations

Synthesis and in Vitro Evaluation of CAPE Derivatives as Ferroptosis Inducers in Triple Negative Breast Cancer

Valeria Consoli et al. ACS Med Chem Lett. .

Abstract

Herein, we describe the design, synthesis, and in vitro biological evaluation of HO-1 inducers endowed with cytotoxic effects mediated by ferroptosis activation. Using the natural HO-1 inducer caffeic acid phenethyl ester (CAPE) as a chemical scaffold, new derivatives were synthesized by performing modifications in the cathecol moiety and in the phenethyl ester aromatic ring. Biological assays aimed at evaluating an imbalanced activity of ferroptosis key players identified that 2-(1H-indol-3-yl)ethyl cinnamate (compound 24) possesses improved anticancer activity toward the MDA-MB 231 triple negative breast cancer cell line when compared to CAPE. Increased ROS and LOOH levels, reduced GSH levels, imbalanced mitochondrial activity, and restored cell viability after ferrostatin-1 treatment suggested a ferroptotic mechanism of action, which did not involve GPX4 inhibition. Compound 24 represents an intriguing hit compound useful for the identification of novel ferroptosis inducers.


Conflict of interest statement

The authors declare no competing financial interest.

Figures

Figure 1
Figure 1
Chemical structures of CAPE and VP961.
Figure 2
Figure 2
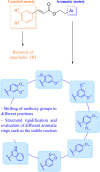
General structure and design strategy adopted for novel CAPE derivatives.
Scheme 1
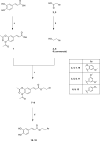
Scheme 1. Synthetic Strategy for the Synthesis of Compounds 1113
Reagents and conditions: (a) NaOH, H2O, r.t, acetic anhydride, 0 °C then r.t., 1.5 h. (b) LiAlH4 in THF 1 M, dry THF, r.t., 4 h. (c) SOCl2, dry CHCl3, reflux, 2 h, then 5–7, dry pyridine, dry CH2Cl2, r.t., overnight. (d) Guanidinium carbonate, TEA, N2, dry CH2Cl2/dry CH3OH (1:2), r.t, 15–30 min.
Scheme 2
Scheme 2. Synthetic Strategy for the Synthesis of Compounds 2024
Reagents and conditions: (a) LiAlH4 in THF 1M, dry THF, r.t., 4 h. (b) PBr3, dry CH2Cl2, 0 °C, then r.t, 1.5 h. (c) CA or cinnamic acid, Na2CO3, KI, DMSO, r.t., 20 h.
Figure 3
Figure 3
Evaluation of the CAPE effect, alone or in combination with ferrostatin-1 (1 μM) and Z-VAD-FMK (20 μM), on cell viability after 48 h of treatment (A, B). Assessment of glutathione, ferrous iron, and IL-6 levels following CAPE exposure (C–E). Results are expressed as mean ± SEM (*compound vs CTRL; #vs CAPE; ***p < 0.0001; ###p < 0.0001; ##p < 0.001; #p < 0.01).
Figure 4
Figure 4
Evaluation of compounds 1012, 2125, VP961, and CAPE cytotoxic effects following 24 h of treatment. Results are expressed as mean ± SEM (§CAPE vs CTRL; *compound vs CAPE 10 μM; #compound vs CAPE 50 μM; §p < 0.0001; ***p < 0.0001; ###p < 0.0001; ##p < 0.001; #p < 0.01).
Figure 5
Figure 5
Measurement of HO-1 expression (A) and enzymatic activity (B) following 18 h of treatment. Results are expressed as mean ± SEM (***p < 0.0001 vs CTRL).
Figure 6
Figure 6
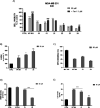
Evaluation of a combination treatment (selected compounds/ferrostatin-1) effect on cell viability after 48 h (A). Measurement of lipid hydroperoxide (B), glutathione (D), and IL-6 (E) levels following treatment with the three selected compounds. Assessment of VP961, 11, and 24 GPX4 inhibitory capacity compared to positive control ML162 (C). Results are expressed as mean ± SEM (***p < 0.0001, **p < 0.001, *p < 0.01 vs CTRL; ###p < 0.0001, #p < 0.01 vs reference compound).
Figure 7
Figure 7
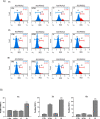
Assessment of ROS profile following VP961, 11, and 24 treatments at different time points (1, 3, 6 h) by cytometric analysis (A) and relative quantification (B). Results are expressed as mean ± SEM (***p < 0.0001 vs CTRL).
Figure 8
Figure 8
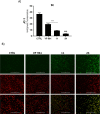
Evaluation of treatment effects on mitochondrial membrane potential (A) and fluorescence images of JC-1 staining after 6 h of treatment (B). Results are expressed as mean ± SEM (***p < 0.0001 vs CTRL).

References

    1. Sui S.; Xu S.; Pang D. Emerging role of ferroptosis in breast cancer: New dawn for overcoming tumor progression. Pharmacology & Therapeutics 2022, 232, 107992.10.1016/j.pharmthera.2021.107992. - DOI - PubMed
    1. Siegel R. L.; Giaquinto A. N.; Jemal A. Cancer statistics, 2024. CA Cancer J. Clin 2024, 74, 12–49. 10.3322/caac.21820. - DOI - PubMed
    1. Chiang S. K.; Chen S. E.; Chang L. C. A Dual Role of Heme Oxygenase-1 in Cancer Cells. Int. J. Mol. Sci. 2019, 20, 39.10.3390/ijms20010039. - DOI - PMC - PubMed
    1. Floresta G.; Fallica A. N.; Salerno L.; Sorrenti V.; Pittala V.; Rescifina A. Growing the molecular architecture of imidazole-like ligands in HO-1 complexes. Bioorg Chem. 2021, 117, 105428.10.1016/j.bioorg.2021.105428. - DOI - PubMed
    1. Floresta G.; Fallica A. N.; Patamia V.; Sorrenti V.; Greish K.; Rescifina A.; Pittala V. From Far West to East: Joining the Molecular Architecture of Imidazole-like Ligands in HO-1 Complexes. Pharmaceuticals (Basel) 2021, 14, 1289.10.3390/ph14121289. - DOI - PMC - PubMed

LinkOut - more resources