. 2024 Jun 21;135(1):6-25.
doi: 10.1161/CIRCRESAHA.123.324172. Epub 2024 May 15.

A Novel Macrophage Subpopulation Conveys Increased Genetic Risk of Coronary Artery Disease

Affiliations

A Novel Macrophage Subpopulation Conveys Increased Genetic Risk of Coronary Artery Disease

Jiahao Jiang et al. Circ Res. .

Abstract

Background: Coronary artery disease (CAD), the leading cause of death worldwide, is influenced by both environmental and genetic factors. Although over 250 genetic risk loci have been identified through genome-wide association studies, the specific causal variants and their regulatory mechanisms are still largely unknown, particularly in disease-relevant cell types such as macrophages.

Methods: We utilized single-cell RNA-seq and single-cell multiomics approaches in primary human monocyte-derived macrophages to explore the transcriptional regulatory network involved in a critical pathogenic event of coronary atherosclerosis-the formation of lipid-laden foam cells. The relative genetic contribution to CAD was assessed by partitioning disease heritability across different macrophage subpopulations. Meta-analysis of single-cell RNA-seq data sets from 38 human atherosclerotic samples was conducted to provide high-resolution cross-referencing to macrophage subpopulations in vivo.

Results: We identified 18 782 cis-regulatory elements by jointly profiling the gene expression and chromatin accessibility of >5000 macrophages. Integration with CAD genome-wide association study data prioritized 121 CAD-related genetic variants and 56 candidate causal genes. We showed that CAD heritability was not uniformly distributed and was particularly enriched in the gene programs of a novel CD52-hi lipid-handling macrophage subpopulation. These CD52-hi macrophages displayed significantly less lipoprotein accumulation and were also found in human atherosclerotic plaques. We investigated the cis-regulatory effect of a risk variant rs10488763 on FDX1, implicating the recruitment of AP-1 and C/EBP-β in the causal mechanisms at this locus.

Conclusions: Our results provide genetic evidence of the divergent roles of macrophage subsets in atherogenesis and highlight lipid-handling macrophages as a key subpopulation through which genetic variants operate to influence disease. These findings provide an unbiased framework for functional fine-mapping of genome-wide association study results using single-cell multiomics and offer new insights into the genotype-environment interactions underlying atherosclerotic disease.

Keywords: atherosclerosis; cholesterol, LDL; coronary artery disease; genome-wide association study; macrophages; multiomics; single cell analysis.


Conflict of interest statement

Disclosures None.

Figures

Figure 1.
Figure 1.
Multiomics single-cell sequencing identifies cellular heterogeneity in human monocyte-derived macrophages and captures transcriptional regulators driving their response to oxidized low-density lipoprotein (ox-LDL) cholesterol. A and B, Representative immunostaining of unexposed (A) and lipid-laden ex vivo macrophages (B), showing variations in cellular morphology and lipid accumulation. Scale bar: 50 µm. C, Uniform manifold approximation and projection (UMAP) visualization showing transcriptomically distinct macrophage subpopulations identified by single-cell RNA-sequence (scRNA-seq; n=4881 cells). D, Refined ex vivo macrophage subpopulations based on integrated single-nucleus RNA-seq and assay for transposase-accessible chromatin with high throughput sequencing (ATAC-seq) profiles and displayed as UMAP. E, Dot plot of the expression of selected marker genes for the 9 subpopulations in D; for each subpopulation, the color represents the average gene expression, normalized by sequencing depth and scaled across all cells; the size represents the percentage of cells expressing the gene. F, Mean TF (transcription factor) motif deviation scores (y axis, relative enrichment compared with background) plotted against their correlation with TF RNA expression (x axis, Pearson coefficient) in ox-LDL–treated cells. TFs are colored by significance (FDR <0.05) for negative (blue) or positive (red) correlation. G, Motif deviation scores (top) and normalized gene expression (bottom) for the AP-1 family TF FOS, shown on the UMAP and summarized by ox-LDL exposure status in the violin plot. Gene expression levels were min-max normalized for visualization purposes. H, Motif deviation scores (top) and normalized gene expression (bottom) for NFE2 family TF BACH1. P values were calculated using a Wilcoxon test. SNP indicates single nucleotide polymorphism.
Figure 2.
Figure 2.
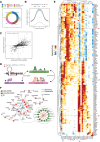
Multiomics analysis identifies cis-regulatory elements and key transcriptional regulatory networks for coronary artery disease (CAD). A, Location of CREs (cis-regulatory elements; n=22 555 CREs). B, Aggregated H3K27ac signals at CRE-peak and non-CRE-peak regions. Signals from unexposed (blue) and oxidized low-density lipoprotein cholesterol (ox-LDL)–exposed (red) human macrophages are plotted separately. Shaded regions indicate 95% CIs. C, Pearson correlation between ox-LDL–induced changes in CRE chromatin accessibility and in gene expression. n=636 DORC genes analyzed. D, Schematic diagram of the workflow for identification of transcription regulatory networks. The significance of each TF-gene interaction is tested by assessing whether the TF motif is enriched in the target CRE and whether the expression of the TF correlates with the accessibility of the target CRE (see Methods). E, Heatmap of regulation scores for the top 0.1% of TF (transcription factor)-DORC enrichments (n=25 TFs and n=147 DORCs). DORC genes are in rows and TFs are in columns. DORCs with CREs overlapping CAD-associated variants are marked with red. Positive and negative regulatory effects are shown in red and blue, respectively. Red arrows highlight the opposite regulatory effect of JDP2 on CD109 and PLPP3. F, Network visualization of significant TF-DORC pairs for CAD-DORCs (absolute regulation score >1.5). Nodes represent CAD-DORCs (orange) and TF regulators (grey). Non-CAD-DORCs regulated by MITF are plotted separately (green discs). Red lines indicate activating effects, and blue lines indicate repressive effects. Line widths are weighted by the regulation score.
Figure 3.
Figure 3.
Partitioning the genetic risk of coronary artery disease (CAD) prioritizes disease-critical macrophage subpopulations. A, Histogram showing the null distribution of overlaps between CAD-associated SNPs and n=1000 sets of background peaks matched for GC% bias and average accessibility for all oxidized low-density lipoprotein cholesterol (ox-LDL)–response CREs (cis-regulatory elements). The observed overlap is marked by the red dashed line. B, Number of independent CAD loci mapped onto CREs targeting subpopulation-specific genes. Each set of subpopulation marker genes was binarily selected by a differential gene expression test using an FDR threshold of 0.05. Rows represent marker gene sets, and intersections between different sets are shown as connected dots. The size of each marker gene set is plotted to the left of the matrix, and the size of each intersection is plotted on the top. C, Genome-wide association studies (GWAS) heritability enrichment framework. Left, Deriving macrophage subpopulation gene programs, pseudo-bulk ox-LDL gene program, and subpopulation-ox-LDL gene programs from single-cell transcriptomic data. Middle, Converting gene programs into weighted genomic regions using the macrophage CRE map (top), then constructing single nucleotide polymorphism (SNP) annotation matrices by assigning the corresponding weights to 1000G SNPs overlapping each region (bottom). Right, After accounting for the linkage disequilibrium (LD) structure within GWAS risk loci, the putative causal variants and their target genes are prioritized by their overlaps with macrophage CREs (task 1); the relative enrichment of GWAS heritability for stratified subpopulation-specific/subpopulation-specific–ox-LDL–specific annotations are tested using the LD score regression model (task 2). D and E, Enrichments for CAD heritability in subpopulation gene programs (D) and subpopulation-ox-LDL gene programs (E). Dot size denotes the relative enrichment over background annotations. Color denotes the standardized effect sizes (see text) after conditioning on each other (D) or on a pseudo-bulk ox-LDL–response program (E) Nonzero τ* estimates reported at 2 significance levels (solid: P<0.05, dotted: P<0.1).
Figure 4.
Figure 4.
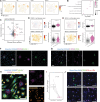
Multiomics characterization of the lipid-handling macrophage subpopulation. A, The expression of selected marker genes displayed on the uniform manifold approximation and projection (UMAP). Expression levels were min-max normalized for visualization purposes. B, Kyoto Encyclopedia of Genes and Genomes (KEGG) pathways enriched in the marker genes of lipid-handling macrophages. Color represents log2-fold change and size represents the number of overlapped genes in each pathway. C, Mean TF (transcription factor) motif deviation scores (y axis, the relative enrichment compared with background) compared with their correlation with TF RNA expression (x axis, Pearson coefficient) in lipid-handling macrophages. TFs are colored by significance (FDR<0.05) for negative (blue) or positive (red) correlation. D, Motif deviation scores (top) and RNA expression (bottom) for CEBPB. E, Motif deviation scores (top) and RNA expression (bottom) for NR1H3. F and G, Representative immunostaining of ex vivo macrophages for lipid-handling macrophage markers CD52, CHI3L1 (F), and CD36 (G). H, Representative immunostaining of ex vivo macrophages for lipid accumulation after 48 hours treatment with DiI-oxidized low-density lipoprotein cholesterol (ox-LDL). I, Quantification of the intracellular level of DiI-ox-LDL in H, shown as average fluorescence intensities (arbitrary units) per biological replicate (n=6). J, Representative live-cell imaging of ex vivo macrophages for lipid accumulation at different time points post-DiI-ox-LDL exposure, with a CD52+ cell marked by the white arrow. Cells were briefly incubated with Fc-muted CD52 antibody for 1 hour before the assay to minimize the effect of antibody binding. Scale bar: 50 µm. P values were calculated using a Wilcoxon test in D and E, and a paired Wilcoxon test in I.
Figure 5.
Figure 5.
Meta-analysis of 38 human plaque samples enables high-resolution mapping of plaque macrophages in vivo. A, Uniform manifold approximation and projection (UMAP) visualization of the plaque macrophage atlas: multiple subpopulations of plaque macrophages demonstrated by meta-analysis of 38 samples from 5 independent studies.–,, B, The expression of selected marker genes for subpopulations in A is summarized in the dot plot, where the color represents the average gene expression, normalized by sequencing depth and scaled across all cells; the dot size represents the percentage of cells expressing the gene in the subpopulation. C, Single-cell transcriptomic profiles of ex vivo macrophages projected onto the plaque macrophage atlas (A) colored by treatment, demonstrating close mapping to the lipid-associated macrophage (LAM) subpopulation in plaques. D, Predicted probabilities of ex vivo macrophages being classified as plaque LAM, shown as individual data points along with the median, colored by treatment. E, Enrichments for coronary artery disease (CAD) heritability in subpopulation gene programs of plaque macrophages. Dot size denotes the relative enrichment over all macrophage open chromatin regions. Color denotes the standardized effect sizes after conditioning on each other. Nonzero τ* estimates reported at 2 significance levels (solid: P<0.05, dotted: P<0.1). F, UMAP visualization of plaque LAMs in A but clustered at a higher resolution. G, The expression of selected lipid-handling macrophage markers displayed on the UMAP in F. Expression levels were minimum-maximum normalized for visualization purposes.
Figure 6.
Figure 6.
Chromatin regulatory landscapes of coronary artery disease (CAD) risk variants in lipid-handling macrophages. A, Genomic plots for the region encoding CAD risk variants rs6772383 and rs11452399, which localize to a CRE (cis-regulatory element) at the MITF locus. Tracks (from top to bottom) showing cis-regulatory interactions (links), ATAC-seq peaks (peaks), CAD-associated variants (SNPs), genomic annotations (genes), ATAC-seq signals aggregated by treatment, ATAC-seq signals aggregated by subpopulations, enhancer signals from H3K27ac ChIP-seq. Higher resolution coverage plots centered on the cis-regulatory peak are plotted in the middle. Violin plots of aggregated gene expression are shown to the right. A red bar indicates significant CREs, and eQTL SNPs are marked with an asterisk. B, Violin plot showing the allele-specific effect of rs6772383 on MITF expression in human blood based on GTEx data. C, Quantification of the immunofluorescence staining of ex vivo macrophages for MITF, shown as average nuclear and intracellular fluorescence intensities (arbitrary units) per biological replicate (n=6). D, MITF expression in lipid-associated macrophages (LAMs) from plaques vs LAMs from control unaffected arteries. E, Genomic plot similar to that in A, but showing CAD risk variants rs1800590, rs59811201, rs11204085, rs11204086, and rs11204087 overlapping CREs at the LPL locus. P values were calculated using a paired Wilcoxon test in C, and a Wilcoxon test in D.
Figure 7.
Figure 7.
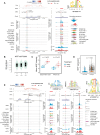
Coronary artery disease (CAD) risk variants at the cis-regulatory region of FDX1 and RDX. A, Genomic plots of CAD-associated genome-wide association studies (GWAS) variant rs10488763 at the FDX1/RDX locus, similar to the plots shown in Figure 6A. B, Association of rs10488763 variant with CAD (GWAS-CAD), FDX1 expression (eQTL-FDX1), RDX expression (eQTL-RDX, note smaller scale of y axis), and chromatin accessibility (caQTL) at the FDX1/RDX locus. SNPs are colored by their LD with rs10488763. C, Chromatin accessibility of the cis-regulatory peak in A grouped by genotype from multiomics data (n=3 for A/A, n=1 for A/T). D, Allelic sequencing coverage of rs10488763 in 7 heterozygous samples, showing higher accessibility in the chromosome containing the protective A allele compared with the T allele. Reads are aggregated from snATAC-seq data sets of primary human macrophages and human plaques. Sequencing coverage on the alternative allele shown in negative values for visualization purposes. E, Dual luciferase reporter assays in primary human macrophages with and without ox-LDL treatment testing the allelic enhancer activity of rs10488763 (n=5 biological replicates). Signals normalized to Renilla luciferase activities. F, RT-qPCR measurement of FDX1 expression. Primary macrophages (n=8, 6, 2 for AA, AT, and TT samples, respectively) were transfected with LAP (liver-enriched activator protein) overexpression plasmid or control pcDNA3 plasmid. GAPDH was used as the reference gene. P values were calculated using a Wilcoxon test in C and a paired Wilcoxon test in D, E, and F.

References

    1. Kassebaum NJ, Bertozzi-Villa A, Coggeshall MS, Shackelford KA, Steiner C, Heuton KR, Gonzalez-Medina D, Barber R, Huynh C, Dicker D, et al. . Global, regional, and national levels and causes of maternal mortality during 1990-2013: a systematic analysis for the Global Burden of Disease Study 2013. Lancet. 2014;384:980–1004. doi: 10.1016/S0140-6736(14)60696-6 - PMC - PubMed
    1. Malakar AK, Choudhury D, Halder B, Paul P, Uddin A, Chakraborty S. A review on coronary artery disease, its risk factors, and therapeutics. J Cell Physiol. 2019;234:16812–16823. doi: 10.1002/jcp.28350 - PubMed
    1. Woollard KJ, Geissmann F. Monocytes in atherosclerosis: subsets and functions. Nat Rev Cardiol. 2010;7:77–86. doi: 10.1038/nrcardio.2009.228 - PMC - PubMed
    1. Chinetti-Gbaguidi G, Colin S, Staels B. Macrophage subsets in atherosclerosis. Nat Rev Cardiol. 2015;12:10–17. doi: 10.1038/nrcardio.2014.173 - PubMed
    1. Moore KJ, Tabas I. Macrophages in the pathogenesis of atherosclerosis. Cell. 2011;145:341–355. doi: 10.1016/j.cell.2011.04.005 - PMC - PubMed