. 2024 Jun 21;135(1):26-40.
doi: 10.1161/CIRCRESAHA.123.324026. Epub 2024 May 15.

MICU3 Regulates Mitochondrial Calcium and Cardiac Hypertrophy

Affiliations

MICU3 Regulates Mitochondrial Calcium and Cardiac Hypertrophy

Barbara Roman et al. Circ Res. .

Abstract

Background: Calcium (Ca2+) uptake by mitochondria occurs via the mitochondrial Ca2+ uniporter. Mitochondrial Ca2+ uniporter exists as a complex, regulated by 3 MICU (mitochondrial Ca2+ uptake) proteins localized in the intermembrane space: MICU1, MICU2, and MICU3. Although MICU3 is present in the heart, its role is largely unknown.

Methods: We used CRISPR-Cas9 to generate a mouse with global deletion of MICU3 and an adeno-associated virus (AAV9) to overexpress MICU3 in wild-type mice. We examined the role of MICU3 in regulating mitochondrial calcium ([Ca2+]m) in ex vivo hearts using an optical method following adrenergic stimulation in perfused hearts loaded with a Ca2+-sensitive fluorophore. Additionally, we studied how deletion and overexpression of MICU3, respectively, impact cardiac function in vivo by echocardiography and the molecular composition of the mitochondrial Ca2+ uniporter complex via Western blot, immunoprecipitation, and Blue native-PAGE analysis. Finally, we measured MICU3 expression in failing human hearts.

Results: MICU3 knock out hearts and cardiomyocytes exhibited a significantly smaller increase in [Ca2+]m than wild-type hearts following acute isoproterenol infusion. In contrast, heart with overexpression of MICU3 exhibited an enhanced increase in [Ca2+]m compared with control hearts. Echocardiography analysis showed no significant difference in cardiac function in knock out MICU3 mice relative to wild-type mice at baseline. However, mice with overexpression of MICU3 exhibited significantly reduced ejection fraction and fractional shortening compared with control mice. We observed a significant increase in the ratio of heart weight to tibia length in hearts with overexpression of MICU3 compared with controls, consistent with hypertrophy. We also found a significant decrease in MICU3 protein and expression in failing human hearts.

Conclusions: Our results indicate that increased and decreased expression of MICU3 enhances and reduces, respectively, the uptake of [Ca2+]m in the heart. We conclude that MICU3 plays an important role in regulating [Ca2+]m physiologically, and overexpression of MICU3 is sufficient to induce cardiac hypertrophy, making MICU3 a possible therapeutic target.

Keywords: calcium; echocardiography; mitochondria; myocytes, cardiac.


Conflict of interest statement

Disclosures None.

Figures

Figure 1.
Figure 1.. Deletion of MICU3 reduces [Ca2+]m uptake in the heart.
A) Protocol for the isoproterenol treatment. B) Time course of [Ca2+]m in wild-type (black circle, WT) and MICU3-KO (red square, KO) hearts during and following isoproterenol treatment. C) Fold change at 1 min of isoproterenol treatment compared to baseline for [Ca2+]m in wild-type and MICU3-KO hearts. Lack of MICU3 reduce the increase of [Ca2+]m following β-adrenergic stimulation (n=5; 5M) for each genotype analyzed with Mann Whitney test). D) Protocol for the isoproterenol treatment in hearts injected with R-GECO1. E) Time course of [Ca2+]m in wild-type (black circle, WT) and MICU3-KO (red square, KO) hearts during and following isoproterenol treatment. F) Fold change of isoproterenol treatment compared to baseline for [Ca2+]m in wild-type and MICU3-KO hearts. Loss of MICU3 reduce the increase of [Ca2+]m following β-adrenergic stimulation (n=4; 2M-2F) for each genotype, analyzed with Mann Whitney test ).
Figure 2.
Figure 2.. Overexpression of MICU3 increases [Ca2+]m uptake in the heart.
A) Representative Western blot analysis and summary data of MICU3 expression in PBS (control, gray, n=4; 1M-3F), MICU3-OE (blue, n=4; 1M-3F), WT (black, n=5; 3M-2F) and MICU3-KO (red, n=5; 3M-2F). MICU3 was normalized to MCU (rabbit) (lower bands in panel). A Mann Whitney test was used to compare differences between WT vs MICU3-KO or PBS vs MICU3-OE whole heart samples. B) Time course of [Ca2+]m in control (C57BL6/N mice injected with PBS, gray triangle) or MICU3-OE (blue square) hearts during and following ISO treatment. C) Fold change at 1 min ISO compared to baseline for [Ca2+]m in PBS and MICU3-OE hearts (n=4 per group (1M-3F)). Overexpression of MICU3 in the heart increased the uptake of [Ca2+]m following isoproterenol treatment. The samples were analyzed with Mann Whitney test.
Figure 3.
Figure 3.. MICU1 and MICU2 levels following deletion or overexpression of MICU3.
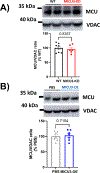
Western blot analysis of the ratio of total expression of A) MCU (mouse)/VDAC in WT (black, n=7; 5M-2F) vs. MICU3-KO (red n=7; 4M-3F), B) PBS (gray, n=7;4M-3F), vs. MICU3-OE (blue, n=7;4M-3F) samples from whole heart, and C) MICU1/MCU(rabbit) in WT (black, n=6; 4M-2F) vs. MICU3-KO (red n=6; 4M-2F), D) MICU2/MCU(rabbit), in WT (black, n=6; 4M-2F)) vs. MICU3-KO (red n=6; 4M-2F), in samples from whole hearts and E) MICU1/MCU(rabbit), PBS (gray, n=6; 4M-2F), vs. MICU3-OE (blue, n=6; 4M-2F) F) MICU2/MCU (rabbit), PBS (gray, n=6; 4M-2F), vs. MICU3-OE (blue, n=6; 4M-2F) total expression in samples from whole hearts. Mann Whitney test was used to compare differences between WT vs MICU3-KO or PBS vs MICU3-OE hearts.
Figure 4.
Figure 4.. The configuration of the MCUc changes with the levels of MICU3 expression.
Immunoprecipitation of MCU (rabbit) and western blotting for MICU1, MICU2 and MICU3 in A) WT and MICU3-KO (n=5 for each genotype; 3M-2F), and B) Immunoprecipitation of MCU (rabbit) and western blotting for MICU1 (n=4; 1M-3F), MICU2 (n=6; 3M-3F) and MICU3 (PBS, n=8; 5M-3F; MICU3-OE; 4M-4F) in MICU3-OE and PBS samples from whole hearts. Mann Whitney test was used to compare differences between WT vs MICU3-KO or PBS vs. MICU3-OE hearts. C) Blue-Native PAGE of isolated mitochondria from WT and MICU3-KO mice, blotting against MICU1 (n=4; 3M-1F), MICU2 (n=4; 3M-1F), EMRE (n=3; 2M-1F) and MCU (n=4; 3M-1F), analyzed with Mann Whitney test.
Figure 5.
Figure 5.. MICU3 expression and phospho-PDH in the heart.
Western blot analysis of the ratio between pSer293-PDH/PDH in A) PBS or Scr (controls, gray, n=7;4M-3F) and MICU3-OE (blue, n=7; 4M-3F) from whole heart samples, and B) MICU3 WT (black, n=7; 5M-2F)) and MICU3-KO (red, n=7; 5M-2F). Mann Whitney test was used to compare differences between the groups.
Figure 6.
Figure 6.. Overexpression of MICU3 and cardiac hypertrophy, potential.
A) Percent fractional shortening (%FS), and percent ejection fraction (%EF) were calculated using the echocardiography instrument software, PBS-Scr (n=11; 6M-5F) vs MICU3-OE (n=10; 6M-4F)). A two-tailed unpaired t test was used to compare differences between PBS-Scr vs MICU3-OE group. B) Hypertrophy was measured as the ratio between the weight of the whole heart and the corresponding tibia length (HW/TL) of each mouse (PBS-Scr n=9; 4M-5F), MICU3-OE n=7; 4M-3F). A Mann Whitney test was used to compare differences between the groups. C) Percent fractional shortening (%FS), and percent ejection fraction (%EF) were calculated using the echocardiography instrument software, WT (n=5M) vs MICU3-KO (n=4M), analyzed with Mann Whitney test. D) Collagen measurement in PBS-Scr (n=9; 4M-5F) vs MICU3-OE (n=7; 4M-3F)). E) Western blot analysis of the ratio between Caspase 3/ TOMM-20, in PBS (control, gray, n=7; 4M-3F) and MICU3-OE (blue, n=6; 4M-2F) from whole heart samples. Mann Whitney test was used to compare differences between PBS-Scr vs MICU3-OE hearts.
Figure 7.
Figure 7.. MICU3 expression is reduced in failing human hearts.
A) Micu3 mRNA expression levels in human heart tissues measured by real-time PCR normalized by Tomm20 expression levels. A Mann Whitney test was used to compare differences between control (n=8; 4M-4F) and HF hearts (n =10; 5M-5F). B) Western blot analysis of the ratio of MICU3 to VDAC, in Ctrl (control, black, n=9; 5M-4F) and HF (orange, n=13; 6M-7F) from whole human heart samples. A Mann Whitney test was used to compare differences between control (Ctrl) vs HF human hearts.

References

    1. Bers DM. Calcium cycling and signaling in cardiac myocytes. Annu Rev Physiol. 2008;70:23–49. - PubMed
    1. Bround MJ, Bers DM, Molkentin JD. A 20/20 view of ANT function in mitochondrial biology and necrotic cell death. Journal of molecular and cellular cardiology. 2020;144:A3–A13. - PMC - PubMed
    1. Robichaux DJ, Harata M, Murphy E, Karch J. Mitochondrial permeability transition pore-dependent necrosis. Journal of molecular and cellular cardiology. 2022. - PMC - PubMed
    1. Bernardi P, Gerle C, Halestrap AP, Jonas EA, Karch J, Mnatsakanyan N, Pavlov E, Sheu S-S, Soukas AA. Identity, structure, and function of the mitochondrial permeability transition pore: Controversies, consensus, recent advances, and future directions. Cell Death & Differentiation. 2023;30:1869–1885. - PMC - PubMed
    1. Del Re DP, Amgalan D, Linkermann A, Liu Q, Kitsis RN. Fundamental mechanisms of regulated cell death and implications for heart disease. Physiological reviews. 2019;99:1765–1817. - PMC - PubMed

MeSH terms