. 2024 Jun 4;12(6):e0408923.
doi: 10.1128/spectrum.04089-23. Epub 2024 May 15.

Impact of whole grain highland hull-less barley on the denaturing gradient gel electrophoresis profiles of gut microbial communities in rats fed high-fat diets

Affiliations

Impact of whole grain highland hull-less barley on the denaturing gradient gel electrophoresis profiles of gut microbial communities in rats fed high-fat diets

Xuejuan Xia et al. Microbiol Spectr. .

Abstract

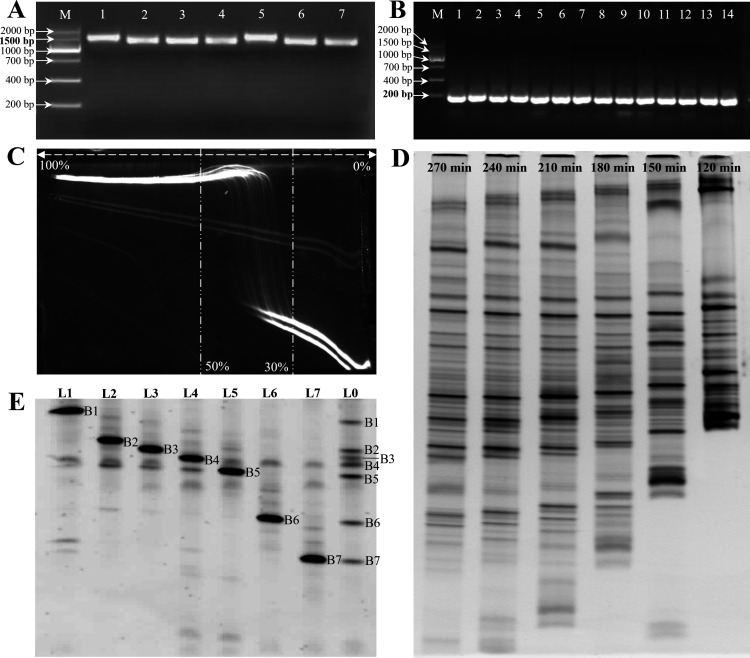
Polymerase chain reaction-denaturing gradient gel electrophoresis (PCR-DGGE) is a traditional non-culture technique that can provide a fingerprint of the microbial community. In the field of gut microbiota analysis, PCR-DGGE still holds potential for development. In the present study, we utilized an improved nested PCR-DGGE approach targeting the V3 region of 16S ribosomal DNA to investigate the impact of whole grain highland hull-less barley (WHLB), a cereal known for its significant hypocholesterolemic effect, on the gut microbiota profiles of high-fat diet rats. Seventy-two male Sprague-Dawley rats were divided into four groups and fed a normal control diet, a high-fat diet, or a high-fat diet supplemented with a low or high dose of WHLB for 4 or 8 weeks. The results revealed that the dominant bands varied among different dose groups and further changed with different treatment times. The compositions of bacterial communities in feces and cecal content were similar, but the dominant bacterial bands differed. After performing double DGGE, extracting the bands, sequencing the DNA, and aligning the sequences, a total of 19 bands were classified under the Firmicutes and Bacteroidetes phyla, while two bands were identified as unclassified uncultured bacteria. The relative abundance of Lactobacillus gasseri, Uncultured Prevotella sp., and Clostridium sp. increased following the administration of WHLB. Illumina-based sequencing was employed to assess the reliability of DGGE, demonstrating its reliability in analyzing the dominant taxonomic composition, although it may have limitations in accurately detecting the alpha diversity of bacterial species.

Importance: While next-generation sequencing has overshadowed polymerase chain reaction-denaturing gradient gel electrophoresis (PCR-DGGE), the latter still holds promise for advancing gut microbiota analysis due to its unique advantages. In this study, we used optimized nested PCR-DGGE to investigate the gut microbiota profile of high-fat diet rats after administering whole grain highland hull-less barley. High-throughput sequencing was employed to validate the DGGE results. Our results proved the reliability of PCR-DGGE for analyzing the dominant taxonomic composition while also providing visual evidence of a notable relationship between the composition of cecal and fecal microbial communities, highlighting substantial differences in both richness and abundance.

Keywords: denaturing gradient gel electrophoresis; fecal microbiota; high-throughput sequencing; nested PCR; taxonomic composition; whole grain.


Conflict of interest statement

The authors declare no conflict of interest.

Figures

Fig 1
Fig 1
Effects of diets containing different doses of WHLB on the moisture content and pH of feces and cecal content in rats. The graphs are plotted as means with standard deviation, with 19 samples collected from week 1 to week 4 and 9 samples collected from week 5 to week 8 for fecal samples. For cecal content, nine samples were collected at both week 4 and week 8. One-way ANOVA was performed for statistical comparisons within groups. Values with different letters in the four groups are significantly different, with lower case letters indicating differences at week 4 and upper case letters indicating differences at week 8 (P < 0.05). The absence of a letter indicates no significant difference was observed. (A) Fecal moisture content. (B) Fecal pH. (C) Cecal content moisture content. (D) Cecal content pH. (E) Cecal content weight.NC, normal control group; BC, blank control group; LD, low-dose group; and HD, high-dose group.
Fig 2
Fig 2
Nested PCR and DGGE condition optimization. (A) Agarose gel electrophoresis image of the 16S rDNA. (B) Agarose gel electrophoresis image of the V3 region of 16S rDNA gene. M, DNA Marker; lanes 1–14, representative samples. (C) Perpendicular DGGE profile of nested-PCR products. (D) DGGE profiles at different electrophoresis times. (E) Secondary DGGE profile of PCR products amplified from recovered DGGE bands. L1–L7, lanes for PCR products from recovered bands; L0, lane for the recovered band original sample; and B1–B7, representative recovered bands.
Fig 3
Fig 3
DGGE profiles and principal component analysis. (A) DGGE profiles and dominant bands observed in feces. (B) DGGE profiles and dominant bands observed in cecal content. Bands labeled with F, C, or FC indicate specific fecal, cecal content, or shared bands, respectively. (C) Principal component analysis of different samples based on the bands and their intensities. Samples labeled with a “F” or “C” indicate feces and cecal content samples, respectively.
Fig 4
Fig 4
Band quantitation and sequence identification of bacteria in feces and cecal content. (A) Intensity and identification of dominant fecal bacterial bands. (B) Fecal-specific band intensity and identification in different groups. One-way ANOVA was performed for statistical comparisons within groups. Values with different letters in the four groups are significantly different, with lower case letters indicating differences at week 4 and upper case letters indicating differences at week 8 (P < 0.05). (C) Intensity and identification of cecal content dominant bacterial bands. (D) Intensity and identification of specific bands from cecal content.
Fig 5
Fig 5
High-throughput sequencing verification of DGGE result using cecal content at week 8. (A) DGGE profiles at week 8 of cecal content with automatic band detection. (B) Analysis of band number by DGGE and alpha diversity indexes using Illumina-based sequencing. Statistical comparisons within groups were performed using one-way ANOVA. *P < 0.05 and ***P < 0.001. (C) Frequency of species classification in the sequences, including domain, phylum, class, order, family, and genus. The species that were also detected by the DGGE method were highlighted in red squares. (D) Heatmap of the Weighted UniFrac distance matrix illustrating the distances between samples.

References

    1. WHO . 2021. Cardiovascular diseases. Available from: https://www.who.int/news-room/fact-sheets/detail/cardiovascular-diseases.... Retrieved 9 Jan 2023.
    1. Vaidean GD, Manczuk M, Vansal SS, Griffith J. 2018. The cholesterol-lowering effect of statins is potentiated by whole grains intake. Eur J Intern Med 50:47–51. doi: 10.1016/j.ejim.2017.11.005 - DOI - PubMed
    1. Wang H, Lichtenstein AH, Lamon-Fava S, Jacques PF. 2014. Association between statin use and serum cholesterol concentrations is modified by whole-grain consumption: NHANES 2003-2006. Am J Clin Nutr 100:1149–1157. doi: 10.3945/ajcn.113.074344 - DOI - PubMed
    1. Lan Y, Ning K, Ma Y, Zhao J, Ci C, Yang X, An F, Zhang Z, An Y, Cheng M. 2022. High-density lipoprotein cholesterol as a potential medium between depletion of Lachnospiraceae genera and hypertension under a high-calorie diet. Microbiol Spectr 10:e0234922. doi: 10.1128/spectrum.02349-22 - DOI - PMC - PubMed
    1. Pol K, Christensen R, Bartels EM, Raben A, Tetens I, Kristensen M. 2013. Whole grain and body weight changes in apparently healthy adults: a systematic review and meta-analysis of randomized controlled studies. Am J Clin Nutr 98:872–884. doi: 10.3945/ajcn.113.064659 - DOI - PubMed

LinkOut - more resources