. 2024 Oct 15;18(10):1672-1689.
doi: 10.1093/ecco-jcc/jjae074.

Influence of Vitamin D Receptor Signalling and Vitamin D on Colonic Epithelial Cell Fate Decisions in Ulcerative Colitis

Affiliations

Influence of Vitamin D Receptor Signalling and Vitamin D on Colonic Epithelial Cell Fate Decisions in Ulcerative Colitis

Lauge Kellermann et al. J Crohns Colitis. .

Erratum in

Abstract

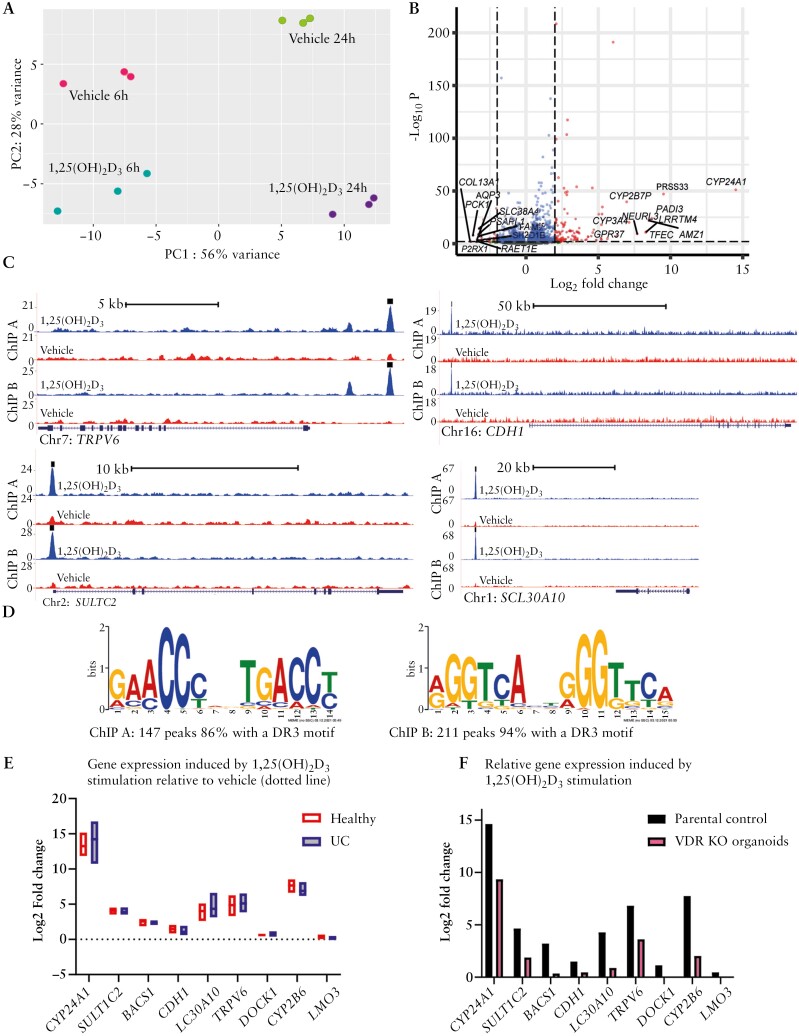
Background and aims: Epidemiological studies have shown that subnormal levels of vitamin D (25[OH]D) are associated with a more aggravated clinical course of ulcerative colitis [UC]. Despite an increased focus on the therapeutic importance of vitamin D and vitamin D receptor [VDR] signalling, the mechanisms underlying the effects of the vitamin D-VDR axis on UC remain elusive. Therefore, we aimed to investigate whether exposure to active vitamin D (1,25[OH]2D3/VDR) signalling in human organoids could influence the maintenance of the colonic epithelium.

Methods: Intestinal VDR expression was studied by immunohistochemistry, RNA expression arrays, and single-cell RNA sequencing of colonic biopsy specimens obtained from patients with UC and healthy individuals. To characterise the functional and transcriptional effects of 1,25[OH]2D3, we used patient-derived colonic organoids. The dependency of VDR was assessed by knocking out the receptor with CRISPR/Cas9.

Results: Our results suggest that 1,25[OH]2D3/VDR stimulation supports differentiation of the colonic epithelium and that impaired 1,25[OH]2D3/VDR signalling thereby may compromise the structure of the intestinal epithelial barrier, leading to flares of UC. Furthermore, a transcriptional response to VDR activity was observed primarily in fully differentiated cells at the top of the colonic crypt, and this response was reduced during flares of UC.

Conclusions: We identified an important role of vitamin D signalling in supporting differentiated cell states in the human colonic epithelium, and thereby maintenance of the intestinal barrier integrity. This makes the vitamin D-VDR signalling axis an interesting target for therapeutic efforts to achieve and maintain remission in patients with UC.

Keywords: Colonic epithelium; inflammatory bowel disease; vitamin D.


Conflict of interest statement

The authors declare no conflicts of interest.

Figures

Graphical Abstract
Graphical Abstract
Figure 1
Figure 1
Colonic VDR expression is reduced in patients with active ulcerative colitis [UC]. [A] Plot of VDR expression in healthy participants and UC patients. VDR expression was assessed via RNA array in sigmoid colon biopsy specimens from healthy individuals [n = 19] and patients with UC [n = 59], who were grouped according to disease activity based on the Mayo score. Y-axis: log of normalised gene expression levels. Data are presented as the mean ± SEM. One-way ANOVA with Tukey’s multiple comparison test. ***p < 0.0001; **p = 0.0017. [B] VDR protein expression was assessed by immunohistochemistry [IHC] intensity scores. A score of 0–3 (negative [0], weak [1], moderate [2], and strong [3]) was assigned to two biopsy specimens from each individual to calculate the mean score. The horizontal line represents the mean values. One-way ANOVA with Tukey’s multiple comparison test. ***p < 0.0001. [C]-[D] A representative IHC image of a VDR-stained colonic biopsy from a healthy individual [C] and a patient with UC with severe disease activity [D]. Scale bar = 100 µm. [E] Isotype control stained colonic biopsy from a patient with UC. [F] Scatterplot of VDR expression vs the Mayo score. Spearman’s correlation test. Black line: linear regression; dotted lines: 95% confidence interval. [G] Scatterplot of VDR expression vs the Geboes score. Spearman’s correlation test. Black line: linear regression; dotted lines: 95% confidence interval VDR, vitamin D receptor; SEM, standard error of the mean; ANOVA, analysis of variance.
Figure 2
Figure 2
Colonic vitamin D receptor [VDR] expression is high in the crypt-top domains. Analysis of single-cell RNA sequencing [scRNA-seq] data of 11 035 colonic epithelial cells from four healthy individuals and 4 354 colonic epithelial cells from four patients with active ulcerative colitis [UC]. [A] UMAP plot of cell states in the healthy epithelium. TA, transit amplifying; CT, crypt-top; EECs, enteroendocrine cells. [B] UMAP plot of VDR expression in cells in the healthy epithelium. [C] UMAP plot of cells in the inflamed epithelium. [D] UMAP plot of VDR expression in cells in the inflamed epithelium. [E] Top left: normal epithelium from a colonic resection specimen, haematoxylin and eosin [H&E]. Top right: normal colonic epithelium, VDR staining. Bottom left: inflamed colonic epithelium, H&E. Bottom right: inflamed colonic epithelium, VDR staining. Scale bar = 250 µm. * = Top of crypts at the epithelial surface. Insert = VDR stained slide overview. [F] Percentage of cells identified using the scRNA-seq data as crypt-top cells in samples of healthy tissue and inflamed tissue from UC patients. Error bars represent the standard error of the mean [SEM]. Wilcoxon rank-sum test.
Figure 3
Figure 3
In colonic epithelial cells, 1,25[OH]2D3 exerts antiproliferative effects and reduces the organoid formation capacity. Organoids were stimulated with 100 nM 1,25[OH]2D3 or the vehicle control for 10 days, corresponding to one passage. On Day 10, five representative images of each well were captured. The organoids were derived from six patients with UC and six healthy individuals, and all experiments were performed in triplicate. [A] Immunohistochemical staining for vitamin D receptor [VDR] in formalin-fixed and paraffin-embedded colonic organoids. Scale bar = 100 µm. [B] Images of organoids on Day 10 following continuous stimulation with either 1,25[OH]2D3 or the vehicle control representative of n = 6 participants from each group. Bright-field images [objective: 5x]. Scale bar = 200 µm. [C] Plot of the individual sizes [µm2] of colonic organoids from six healthy individuals and six patients with UC. Horizontal lines represent the mean. Welch’s t test. [D] The organoid size and number of organoids per area normalised to those in the corresponding vehicle control group. Horizontal black lines represent the mean. The red dotted line represents vehicle after normalisation. The Wilcoxon test was used to compare paired values [*p = 0.0313 on all plots]. The Mann‒Whitney U test was used to compare the healthy and UC patient samples; ns, not significant. [E] Images captured on Day 10 after reseeding the cells from one healthy individual and one patient with UC representative of n = 6 participants from each group. Bright-field images [objective: 5x]. Scale bar = 200 µm. [F] Organoid-forming capacity. Plot of the number of organoids formed after re-seeding of 1,25[OH]2D3-treated organoids normalised to vehicle control levels for healthy participants and UC patients. Wilcoxon test *p = 0.0313; ns: not significant.
Figure 4
Figure 4
The effects of 1,25[OH]2D3 on proliferation and self-renewal potential are dependent on vitamin D receptor [VDR] expression. CRISPR/Cas9 knockout of VDR was performed in organoids from one healthy individual. [A] Western blotting and [B] immunohistochemistry showing effective loss of VDR in CRISPR/Cas9-edited organoids compared with those derived from the parental line. Scale bar = 100 µm. [C] Bright-field images [objective: 5x] of VDR-knockout organoids and the corresponding parental organoids, which were seeded at 7 500 cells per Matrigel droplet and embedded in medium supplemented with either 100 nM 1,25[OH]2D3 or the vehicle control. On Day 10, five representative images of each well were acquired. Scale bar = 200 µm. [D] The organoids were collected and processed into single-cell suspensions. The yield per seeded cell upon 1,25[OH]2D3 stimulation normalised to the vehicle control was calculated. The number of organoids per unit area and organoid size were measured using representative images and normalised to the corresponding vehicle control group. The data represent the mean of three replicates. [E] Bright-field images [objective: 5x] of organoids after single-cell suspensions were reseeded at 5 000 cells per Matrigel droplet and cultured for 10 days in standard organoid medium. Representative images captured on Day 10 after reseeding the cells. Scale bar = 200 µm. [F] The number of organoids formed after 1,25[OH]2D3 treatment was normalised to the number of organoids formed after treatment with the corresponding vehicle control.
Figure 5
Figure 5
Identification of genome-wide vitamin D receptor [VDR] targets in 1,25[OH]2D3-stimulated colonic organoids. Organoids from one healthy individual were treated with 1,25[OH]2D3 or the vehicle control for 6 h and 24 h in triplicate for each time point. The transcriptional response was evaluated using bulk RNA sequencing. [A] Principal component [PC] analysis was performed to cluster samples by time and treatment. [B] Volcano plot of differentially expressed genes after 24 h of stimulation with 1,25[OH]2D3; 567 were upregulated, and 353 were downregulated [absolute log2 fold change ≥ 0.05 and false-discovery rate < 0.05]. [C] Organoids from the same healthy individual were treated for 2 h with 1,25[OH]2D3 or the vehicle control. Chromatin interactions were studied by ChIP-seq with two replicates. Integrative genome visualisation representation of VDR-binding sites identified near the selected VDR target genes. [D] De novo motif analysis revealed a consensus VDR response DR3 element in 85% and 94%of the identified peaks in two CHIP-seq replicates, respectively. [E] Organoids derived from six healthy individuals and six UC patients were stimulated with 1 µM 1,25[OH]2D3 for 24 h on Day 6. The changes in the expression levels of the selected VDR target genes were evaluated by quantitative polymerase chain reaction [qPCR]. A Wilcoxon test was used to compare paired samples for 1,25[OH]2D3 vs the vehicle control. All the genes were significantly upregulated [p = 0.0313]. Boxes indicate the range, the lines in boxes indicate the mean, and the dotted line indicates vehicle after normalisation. [F] Gene expression fold change relative to the vehicle control group analysed by qPCR for selected VDR target genes after 24 h of 1,25[OH]2D3 stimulation in VDR-knockout organoids and matching parental organoids. Data represent the mean of three replicates.
Figure 6
Figure 6
The expression levels of VDR target genes are reduced in the inflamed colons of UC patients. The expression levels of the identified VDR target genes were analysed using RNA array data from sigmoid colon biopsy samples from healthy individuals [n = 19] and patients with UC [n = 59]. [A] SLC30A10 expression grouped by disease activity. Data are shown as the mean ± standard error of the mean [SEM]. One-way analysis of variance [ANOVA] with Tukey’s multiple comparison test. ***p < 0.0001;**p = 0.0029. SLC30A10 expression is shown as a representative example. The remaining gene expression plots are included in Supplementary Figure S5. [B] Scatterplot of SLC30A10 expression vs the Mayo score. Spearman’s correlation test. [C] Spearman’s correlation coefficients for the identified VDR target genes vs the Mayo score.
Figure 7
Figure 7
The transcriptional response to 1,25[OH]2D3 occurs in VDR-expressing crypt-top epithelial cells. [A] Single-cell RNA-seq data for the healthy epithelium. Left: UMAP plot of the enrichment of genes that were upregulated upon 1,25[OH]2D3 stimulation for 24 h. Right: UMAP plot of the enrichment of 21 VDR target genes. [B] Single-cell RNA-seq data for the inflamed epithelium. Left: UMAP plot of the enrichment of genes that were upregulated upon 1,25[OH]2D3 stimulation for 24 h. Right: UMAP plot of the enrichment of the 21 VDR target genes. [C] Fraction of cells in the scRNA-seq dataset with positive enrichment of genes upregulated upon 1,25[OH]2D3 stimulation.

References

    1. GBD 2017 Inflammatory Bowel Disease Collaborators. The global, regional, and national burden of inflammatory bowel disease in 195 countries and territories, 1990-2017: a systematic analysis for the Global Burden of Disease Study 2017. Lancet Gastroenterol Hepatol 2020;5:17–30. - PMC - PubMed
    1. Kaplan GG, Windsor JW. The four epidemiological stages in the global evolution of inflammatory bowel disease. Nat Rev Gastroenterol Hepatol 2021;18:56–66. - PMC - PubMed
    1. Wang R, Li Z, Liu S, Zhang D. Global, regional and national burden of inflammatory bowel disease in 204 countries and territories from 1990 to 2019: a systematic analysis based on the Global Burden of Disease Study 2019. BMJ Open 2023;13:e065186. - PMC - PubMed
    1. Armuzzi A, Tarallo M, Lucas J, et al.. The association between disease activity and patient-reported outcomes in patients with moderate-to-severe ulcerative colitis in the United States and Europe. BMC Gastroenterol 2020;20:18. - PMC - PubMed
    1. Le Berre C, Honap S, Peyrin-Biroulet L. Ulcerative colitis. Lancet 2023;402:571–84. - PubMed

MeSH terms