. 2025 May;35(5):3253-3266.
doi: 10.1007/s10895-024-03729-2. Epub 2024 May 15.

References for Small Fluorescence Quantum Yields

Affiliations

References for Small Fluorescence Quantum Yields

Mahbobeh Morshedi et al. J Fluoresc. 2025 May.

Abstract

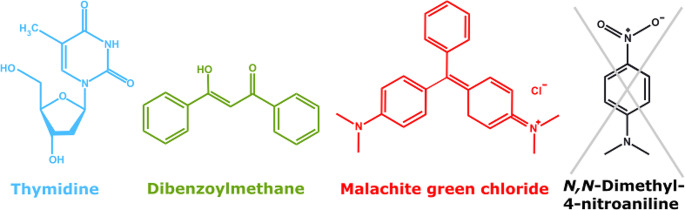
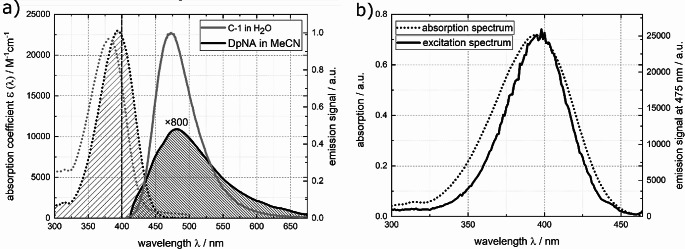
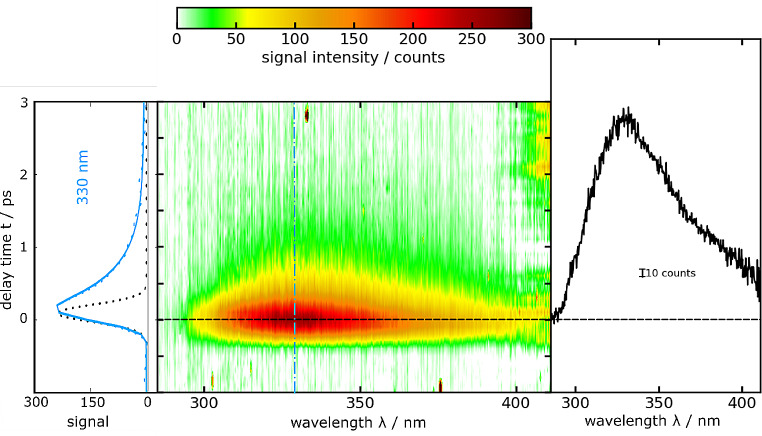
Three compounds with fluorescence quantum yields in the range of 10- 5 to 10- 4 and emission spectra covering the UV/Vis spectral range are suggested as new references for the determination of small fluorescence quantum yields. The compounds are thymidine (dT) in water, dibenzoylmethane (DBM) in ethanol, and malachite green chloride (MG) in water, representing the blue, green, and red regions of the spectrum, respectively. All compounds are easily handled, photostable, and commercially available. Furthermore, these compounds exhibit a mirror-image symmetry between their absorption and fluorescence spectra. This symmetry, along with closely aligned fluorescence excitation and absorption spectra, confirms that the observed emissions originate from the compounds themselves. The fluorescence quantum yields were determined via a relative approach as well as Strickler-Berg analysis in conjunction with time resolved fluorescence spectroscopy. Within the respective error margins, the two approaches yielded identical results.

Keywords: Dibenzoylmethane; Fluorescence quantum yield; Malachite green chloride; Strickler-Berg analysis; Thymidine; Time resolved spectroscopy.


Conflict of interest statement

Declarations. Ethical Approval: Not applicable. Competing Interests: The authors declare no competing interests.

Figures

Fig. 1
Fig. 1
Chemical structures of thymidine, dibenzoylmethane, malachite green chloride, and N, N-dimethyl-4-nitroaniline. The first three molecules plotted in different colors are suggested as references, the last one was discarded
Fig. 2
Fig. 2
(a) Absorption (coefficient, black dotted line) and fluorescence (smoothed black solid line) spectra of DpNA in acetonitrile. Absorption (coefficient, gray dotted line scaled according to ref. [65]) and fluorescence (gray solid line) spectra of the reference dye C-1 in water are included. The excitation wavelength at 400 nm is marked in the absorption spectra. The emission spectra were recorded with constant wavelength bandpass (5 nm). The fluorescence spectra are scaled such that their integrals are proportional to their respective fluorescence quantum yields. For the sake of comparison, the fluorescence spectrum of DpNA was multiplied by a factor of 800. The relevant ranges used for the Strickler-Berg analysis are highlighted in the absorption and emission spectra. (b) Fluorescence excitation spectrum of DpNA in comparison with its absorption spectrum. For the excitation spectrum the signal was probed at 475 nm
Fig. 3
Fig. 3
Femtosecond transient fluorescence on DpNA in acetonitrile (∼ 0.5 mM) as a function of detection wavelength λ and delay time t. The solution was excited at 400 nm. In the central contour representation, reddish hue represents large fluorescence signals. One representative time trace (480 nm) as well as a fit are shown on the left. The dotted gray line represents the IRF
Fig. 4
Fig. 4
(a) Absorption (coefficient, blue dotted line) and fluorescence (smoothed blue solid line) spectra of dT in water. Absorption (coefficient, gray dotted line scaled according to ref. [71]) and fluorescence (gray solid line) spectra of the reference dye Ty in water are included. The excitation wavelength at 255 nm is marked in the absorption spectra. The emission spectra were recorded with constant wavelength bandpass (5 nm). The fluorescence spectra are scaled such that their integrals are proportional to their respective fluorescence quantum yields. For the sake of comparison, the fluorescence spectrum of dT was multiplied by a factor of 2000. The relevant ranges used for the Strickler-Berg analysis are highlighted in the absorption and emission spectra. (b) Fluorescence excitation spectrum of dT in comparison with its absorption spectrum. For the excitation spectrum the signal was probed at 350 nm
Fig. 5
Fig. 5
Femtosecond transient fluorescence on dT in water (∼ 1 mM) as a function of detection wavelength λ and delay time t. The solution was excited at 266 nm. In the central contour representation, reddish hue represents large fluorescence signals. One representative time trace (330 nm) as well as a single-exponential fit are shown on the left. The dotted black line represents the IRF
Fig. 6
Fig. 6
Decay associated spectra (DAS) retrieved from the measurement on dT in water depicted in Fig. 5 using a bi-exponential trial function
Fig. 7
Fig. 7
(a) Absorption (coefficient, green dotted line) and fluorescence (smoothed green solid line) spectra of DBM in ethanol. Absorption (coefficient, gray dotted line scaled according to ref. [65]) and fluorescence (gray solid line) spectra of the reference dye C-1 in water are included. The excitation wavelength at 330 nm is marked in the absorption spectra. The emission spectra were recorded with constant wavelength bandpass (5 nm). The fluorescence spectra are scaled such that their integrals are proportional to their respective fluorescence quantum yields. For the sake of comparison, the fluorescence spectrum of DBM was multiplied by a factor of 500. The relevant ranges used for the Strickler-Berg analysis are highlighted in the absorption and emission spectra. (b) Fluorescence excitation spectrum of DBM in comparison with its absorption spectrum. For the excitation spectrum the signal was probed at 400 nm
Fig. 8
Fig. 8
Femtosecond transient fluorescence on DBM in ethanol (∼ 1.3 mM) as a function of detection wavelength λ and delay time t. The solution was excited at 266 nm. In the central contour representation, reddish hue represents large fluorescence signals. One representative time trace (400 nm) as well as a fit are shown on the left. The dotted black line represents the IRF
Fig. 9
Fig. 9
(a) Absorption (coefficient, red dotted line) and fluorescence (smoothed red solid line) spectra of MG in water. Absorption (coefficient, gray dotted line scaled according to ref. [82]) and fluorescence (gray solid line) spectra of the reference dye Rh 101 in ethanol are included. The excitation wavelength at 535 nm is marked in the absorption spectra. The emission spectra were recorded with constant wavelength bandpass (5 nm). The fluorescence spectra are scaled such that their integrals are proportional to their respective fluorescence quantum yields. For the sake of comparison, the fluorescence spectrum of MG was multiplied by a factor of 10,000. The relevant ranges used for the Strickler-Berg analysis are highlighted in the absorption and emission spectra. (b) Fluorescence excitation spectrum of MG in comparison with its absorption spectrum. For the excitation spectrum the signal was probed at 670 nm
Fig. 10
Fig. 10
Femtosecond transient fluorescence on MG in water (∼ 70 μM) as a function of detection wavelength λ and delay time t. The solution was excited at 580 nm. In the central contour representation, reddish hue represents large fluorescence signals. One representative time trace (670 nm) as well as a fit are shown on the left. The dotted black line represents the IRF

References

    1. Wong K-L, Bünzli J-CG, Tanner PA (2020) Quantum yield and brightness. J Lumin 224:117256. 10.1016/j.jlumin.2020.117256
    1. Braslavsky SE (2007) Glossary of terms used in photochemistry, (IUPAC recommendations 2006). Pure Appl Chem 79:293–465. 10.1351/pac200779030293
    1. Birriel JJ, King D (2018) Fluorescence spectra of highlighter inks. Phys Teach 56:20–23. 10.1119/1.5018682
    1. Hoinka NM, Fuhrmann-Lieker T (2019) Amplified spontaneous emission in paper. Sci Rep 9:1862. 10.1038/s41598-018-38438-x - PMC - PubMed
    1. Kalyani NT, Dhoble S (2012) Organic light emitting diodes: Energy saving lighting technology—A review. Renew Sustain Energy Rev 16:2696–2723. 10.1016/j.rser.2012.02.021

LinkOut - more resources