. 2024 May 21;121(21):e2316006121.
doi: 10.1073/pnas.2316006121. Epub 2024 May 15.

Synergistic induction of blood-brain barrier properties

Affiliations

Synergistic induction of blood-brain barrier properties

Gergő Porkoláb et al. Proc Natl Acad Sci U S A. .

Abstract

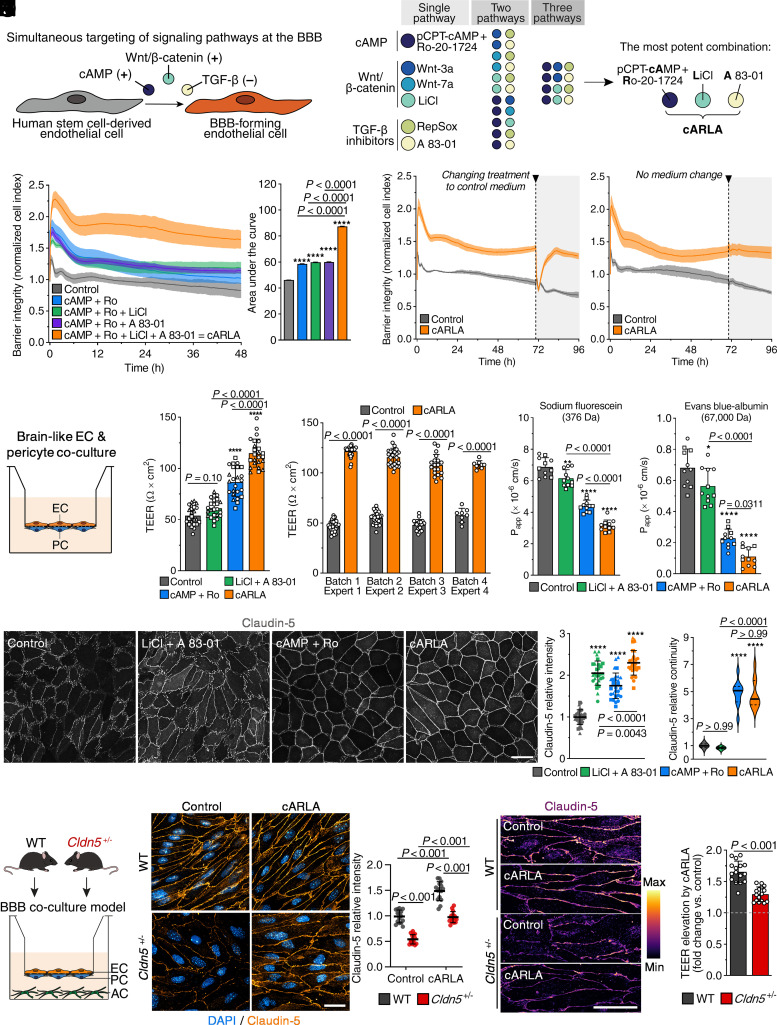
Blood-brain barrier (BBB) models derived from human stem cells are powerful tools to improve our understanding of cerebrovascular diseases and to facilitate drug development for the human brain. Yet providing stem cell-derived endothelial cells with the right signaling cues to acquire BBB characteristics while also retaining their vascular identity remains challenging. Here, we show that the simultaneous activation of cyclic AMP and Wnt/β-catenin signaling and inhibition of the TGF-β pathway in endothelial cells robustly induce BBB properties in vitro. To target this interaction, we present a small-molecule cocktail named cARLA, which synergistically enhances barrier tightness in a range of BBB models across species. Mechanistically, we reveal that the three pathways converge on Wnt/β-catenin signaling to mediate the effect of cARLA via the tight junction protein claudin-5. We demonstrate that cARLA shifts the gene expressional profile of human stem cell-derived endothelial cells toward the in vivo brain endothelial signature, with a higher glycocalyx density and efflux pump activity, lower rates of endocytosis, and a characteristic endothelial response to proinflammatory cytokines. Finally, we illustrate how cARLA can improve the predictive value of human BBB models regarding the brain penetration of drugs and targeted nanoparticles. Due to its synergistic effect, high reproducibility, and ease of use, cARLA has the potential to advance drug development for the human brain by improving BBB models across laboratories.

Keywords: blood–brain barrier; drug delivery; endothelial cell; in vitro models; signaling pathways.


Conflict of interest statement

Competing interests statement:I.K. and M.V. are employed by the company Gedeon Richter. HUN-REN BRC has filed a patent (PCT/HU2023/050070) related to this work; G.P., M.M., A.S., S.V., and M.A.D. are named inventors. Other authors declare no competing interest. Hungarian national patent P2300053 was filed on 9 February 2023 by HUN-REN Biological Research Centre, Szeged, Hungary. Inventors are authors G.P., M.A.D., S.V., M.M., and A.S.

Figures

Fig. 1.
Fig. 1.
cARLA synergistically enhances barrier tightness via claudin-5. (A) Rationale. (B) Schematic drawing of single compounds and their combinations tested in the impedance-based screen. (C) Barrier integrity of human cord blood stem cell–derived EC monolayers supplemented with PC-conditioned medium, measured by impedance. Higher normalized cell index values and a higher area under the curve indicate increased barrier integrity. Mean ± SD, ANOVA with Bonferroni’s post hoc test, ****P < 0.0001 compared to the control group, n = 6. (D) Impedance kinetics of EC monolayers with or without changing cARLA treatment to control medium at 72 h. Mean ± SD, n = 6. (E) Schematic drawing of the BBB model: human stem cell–derived ECs acquire brain-like characteristics upon coculture with PCs. (F) Transendothelial electrical resistance (TEER) in the coculture model after 48 h treatment. Mean ± SD, ANOVA with Bonferroni’s post hoc test, ****P < 0.0001 compared to the control group, n = 24 from three experiments. (G) Reproducibility of TEER measurements after 48 h cARLA treatment across experiments, measured by different experts using different batches of cells. Mean ± SD, ANOVA with Bonferroni’s post hoc test, n = 82 from four experiments. (H) Permeability of sodium fluorescein and (I) Evans blue–albumin across the coculture model after 48 h treatment. Papp: apparent permeability coefficient. Mean ± SD, ANOVA with Bonferroni’s post hoc test, *P < 0.05, **P < 0.01, ****P < 0.0001 compared to the control group, n = 11 from two experiments. (J) Claudin-5 immunostaining in human brain–like ECs. (Scale bar: 50 µm.) Mean ± SD for intensity and (K) median ± quartiles for continuity, ANOVA with Bonferroni’s post hoc test, ****P < 0.0001 compared to the control group, n = 27 to 30 from three experiments. (L) Schematic drawing of BBB coculture models isolated from wild-type (WT) and Cldn5+/ mice. (M and N) Claudin-5 immunostaining in the mouse BBB coculture model. (Scale bar: 50 µm in both subpanels.) Mean ± SD, Two-way ANOVA with Bonferroni’s post hoc test, n = 15. (O) Measurement of TEER in the mouse BBB coculture models. Values are presented as fold change (cARLA vs. control). Mean ± SD, unpaired t test, t = 6,903, df = 30, n = 16.
Fig. 2.
Fig. 2.
The effect of cARLA on barrier tightness is reproducible in additional BBB culture models. (A) Schematic drawing of additional BBB culture models in which cARLA treatment was tested. (B) Real-time measurement of barrier integrity by impedance in mouse bEnd.3 cells and (C) in rat primary brain capillary ECs. Higher normalized cell index values and a higher area under the curve indicate increased barrier integrity. Mean ± SD, ANOVA with Bonferroni’s post hoc test, ****P < 0.0001 compared to the control group, n = 5 to 6 for both panels. (D) Measurement of TEER as well as permeability of (E) sodium fluorescein and (F) Evans blue–albumin across mouse bEnd.3 monolayers after 48 h treatment. Similarly, (G) TEER as well as permeability of (H) sodium fluorescein and (I) Evans blue–albumin was measured across the rat primary cell–based coculture BBB model after 24 h treatment. Mean ± SD, ANOVA with Bonferroni’s post hoc test, *P < 0.05, ***P < 0.001, ****P < 0.0001 compared to the control group, n = 8 in mouse bEnd.3 cells n = 11 in the rat primary BBB model from 2-2 experiments. (J) Claudin-5 immunostaining in mouse bEnd.3 cells and (K) in the rat primary BBB model. (Scale bar: 50 µm in both panels.) Mean ± SD, ANOVA with Bonferroni’s post hoc test, ****P < 0.0001 compared to the control group, n = 20 to 22 from two experiments in both panels.
Fig. 3.
Fig. 3.
cARLA promotes barrier maturation and brain endothelial identity in human brain–like ECs. (A) Schematic drawing of the experimental setup. (B) Principal component analysis (PCA) of control and cARLA-treated samples. (C) Mean-difference (MD) plot of cARLA vs. control samples showing up- and down-regulated genes and their expression levels. Key transcripts related to different aspects of BBB function are highlighted. (D) Functional enrichment analysis of up-regulated- and (E) down-regulated gene sets upon cARLA treatment. Gene Ontology Biological Process (GO:BP) terms are ranked based on their gene ratio and are colored based on statistical significance. (F) F-actin immunostaining, with or without cARLA treatment. (Scale bar: 40 µm.) (G) Validation of the vascular endothelial nature of human stem cell–derived brain-like ECs. Expression levels (TPM: transcript per million) of key epithelial and endothelial transcripts from our dataset are plotted on a three-segment y-axis covering multiple orders of magnitude. (H) Scaled heatmap of 45 BBB-specific genes that are up-regulated by cARLA and are enriched in brain ECs in vivo. (I) Scaled heat map of 14 genes that are down-regulated by cARLA and are enriched in peripheral ECs in vivo. (J) The ratio of up-regulated, not changed, and down-regulated genes by cARLA for all genes and BBB-specific genes using our and previously published (4, 52) lists. (K) Venn diagram of BBB-specific genes from the three lists up-regulated by cARLA.
Fig. 4.
Fig. 4.
cARLA induces a complex BBB phenotype at the mRNA, protein, and functional levels in human brain–like ECs. (A) Key glycocalyx synthesis enzymes are up-regulated upon cARLA treatment. Mean ± SD. (B) Wheat germ agglutinin (WGA) lectin staining labeling negatively charged sialic acid residues in the EC glycocalyx. (Scale bar: 50 µm.) Mean ± SD, unpaired t test, t = 11.43, df = 43, n = 22 to 24 from two experiments. (C) Cell surface zeta potential measurement in ECs. Mean ± SD, unpaired t test, t = 3.045, df = 60, n = 31 from two experiments. (D) Key BBB efflux transporters are up-regulated upon cARLA treatment. Mean ± SD. (E) P-glycoprotein (P-gp, ABCB1) immunostaining in ECs. (Scale bar: 50 µm.) Mean ± SD, unpaired t test, t = 4.065, df = 36, n = 19 from two experiments. (F) Efflux ratio of rhodamine 123, a ligand of efflux pumps, across the BBB coculture model in the presence or absence of verapamil, an efflux pump inhibitor. Mean ± SD, two-way ANOVA with Bonferroni’s post hoc test, n = 4. (G) Key mediators of endocytic vesicle formation and nonspecific albumin uptake are down-regulated by cARLA. Mean ± SD. (H) Texas Red (TR)-labeled albumin internalization in ECs visualized by live cell confocal microscopy. (Scale bar: 50 µm.) Mean ± SD, unpaired t test, t = 3.786, df = 22, n = 12. (I) TR-albumin internalization in ECs quantified by fluorescent spectrophotometry. MβCD: randomly methylated β-cyclodextrin, an inhibitor of lipid raft/caveolin-mediated endocytosis. Incubation at 4 °C inhibits energy-dependent internalization. Mean ± SD, two-way ANOVA with Bonferroni’s post hoc test, **P < 0.01, ****P < 0.0001 compared to its respective 37 °C group, n = 6. (J) Key immune cell adhesion molecules are down-regulated by cARLA in the absence of inflammatory stimuli. Mean ± SD. (K) Barrier integrity of control and cARLA-treated ECs upon TNF-α + IL-1β treatment, measured by impedance. Higher normalized cell index values indicate better-preserved barrier integrity. Mean ± SD, n = 4 to 6. (L) Measurement of TEER in control and cARLA-treated cocultures upon TNF-α + IL-1β treatment. Mean ± SD, two-way ANOVA with Bonferroni’s post hoc test, ****P < 0.0001 compared to nonstimulated ECs, n = 6. (M) Permeability of sodium fluorescein and (N) Evans blue–albumin across the control or cARLA-treated coculture model upon TNF-α + IL-1β treatment. Mean ± SD, two-way ANOVA with Bonferroni’s post hoc test, n = 5 to 6. (O) VCAM-1 (red) and VE-cadherin (gray) immunostaining in control or cARLA-treated ECs, with or without TNF-α + IL-1β treatment. Mean ± SD, two-way ANOVA with Bonferroni’s post hoc test, n = 11.
Fig. 5.
Fig. 5.
Targeted pathways converge on Wnt/β-catenin signaling to mediate the effect of cARLA. (A) Schematic drawing of known interactions between effector transcription factors (TFs) of cAMP, Wnt, and TGF-β signaling. (B) Canonical target genes of Wnt/β-catenin signaling are up-regulated by cARLA. Mean ± SD. (C) β-catenin immunostaining in human brain–like ECs. Arrowheads point to nuclear β-catenin, a hallmark of active Wnt signaling. (Scale bar: 50 µm.) (D) Quantification of β-catenin staining intensity and (E) β-catenin nuclear/non-nuclear ratio. Mean ± SD for intensity, median ± quartiles for nuclear/non-nuclear ratio, ANOVA with Bonferroni’s post hoc test, **P < 0.01, ****P < 0.0001 compared to the control group, n = 20 from two experiments. (F) Schematic drawing of the mechanism of action of Wnt signaling inhibitors ICG-001 and XAV 939. (G) Barrier integrity measured by impedance in EC monolayers, with or without ICG-001 (5 µM) and (H) XAV 939 (1 µM). Higher normalized cell index values indicate higher barrier integrity. Mean ± SD, n = 5 to 6. (I) Permeability of sodium fluorescein and (J) Evans blue–albumin across the coculture model, with or without ICG-001 and XAV 939. Mean ± SD, ANOVA with Bonferroni’s post hoc test. ****P < 0.0001 in cARLA-treated ECs compared to its respective treatment in the control group, n = 6 from two experiments.
Fig. 6.
Fig. 6.
cARLA improves the in vitro prediction of drug and nanoparticle delivery across the human BBB. (A) Permeability of 10 clinically used drugs in blood-to-brain direction across the human brain–like EC-PC coculture model, with or without cARLA treatment. CNS: central nervous system. Red and blue color indicates higher and lower permeability, respectively, for a given drug upon cARLA treatment (P < 0.05). Mean ± SD for symbols, n = 3 to 4. Line of best fit with 95% CIs and R2 value from a simple linear regression are shown. (B) Drug efflux ratios in the coculture model. Mean ± SD, multiple unpaired t tests with Welch’s correction, n = 3 to 4. Upward red and downward blue triangles indicate higher and lower efflux ratios, respectively (P < 0.05). (C) In vitro unbound brain-to-plasma partition coefficient (Kp,uu,brain) of drugs across the coculture model, with or without cARLA treatment. Red and blue color indicates higher and lower values, respectively, for a given drug upon cARLA treatment (P < 0.05). Mean ± SD for symbols, n = 3 to 4. Line of best fit with 95% CIs and R2 value from a simple linear regression are shown. (D) Correlation heatmap of in vitro Kp,uu,brain values for the whole set of drugs from our experiments with in vivo Kp,uu,brain data from rats and nonhuman primates. Numbers inside boxes are Spearman’s correlation coefficients. Data were obtained from 1present study, 2Fridén et al. (57), and 3Sato et al. (58). (E) Comparison of Kp,uu,brain measured in vivo in humans with its predictive models for the drug verapamil. Upper panel: Heat map of Kp,uu,brain values. Lower panel: Mean difference of Kp,uu,brain values compared to human in vivo data. Lower values indicate better prediction. (F) Schematic drawing of nontargeted and GSH-targeted polypeptide nanoparticles (NPs) carrying rhodamine 6G cargo. (G) Permeability of nontargeted and GSH-targeted NPs across the coculture BBB model, with or without cARLA treatment. Pe: endothelial permeability coefficient. Mean ± SD, two-way ANOVA with Bonferroni’s post hoc test, n = 4. (H) Internalization of nontargeted and GSH-targeted NPs carrying rhodamine 6G cargo (orange) in ECs, visualized by live cell confocal microscopy. (Scale bar: 50 µm.)

References

    1. Zlokovic B. V., The blood-brain barrier in health and chronic neurodegenerative disorders. Neuron 57, 178–201 (2008). - PubMed
    1. Abbott N. J., Patabendige A. A., Dolman D. E., Yusof S. R., Begley D. J., Structure and function of the blood-brain barrier. Neurobiol. Dis. 37, 13–25 (2010). - PubMed
    1. Pardridge W. M., Drug transport across the blood-brain barrier. J. Cereb. Blood Flow Metab. 32, 1959–1972 (2012). - PMC - PubMed
    1. Munji R. N., et al. , Profiling the mouse brain endothelial transcriptome in health and disease models reveals a core blood-brain barrier dysfunction module. Nat. Neurosci. 22, 1892–1902 (2019). - PMC - PubMed
    1. Sweeney M. D., Zhao Z., Montagne A., Nelson A. R., Zlokovic B. V., Blood-brain barrier: From physiology to disease and back. Physiol. Rev. 99, 21–78 (2019). - PMC - PubMed