. 2024 May 17;10(20):eadk9076.
doi: 10.1126/sciadv.adk9076. Epub 2024 May 15.

Oncogene EVI1 drives acute myeloid leukemia via a targetable interaction with CTBP2

Affiliations

Oncogene EVI1 drives acute myeloid leukemia via a targetable interaction with CTBP2

Dorien Pastoors et al. Sci Adv. .

Abstract

Acute myeloid leukemia (AML) driven by the activation of EVI1 due to chromosome 3q26/MECOM rearrangements is incurable. Because transcription factors such as EVI1 are notoriously hard to target, insight into the mechanism by which EVI1 drives myeloid transformation could provide alternative avenues for therapy. Applying protein folding predictions combined with proteomics technologies, we demonstrate that interaction of EVI1 with CTBP1 and CTBP2 via a single PLDLS motif is indispensable for leukemic transformation. A 4× PLDLS repeat construct outcompetes binding of EVI1 to CTBP1 and CTBP2 and inhibits proliferation of 3q26/MECOM rearranged AML in vitro and in xenotransplant models. This proof-of-concept study opens the possibility to target one of the most incurable forms of AML with specific EVI1-CTBP inhibitors. This has important implications for other tumor types with aberrant expression of EVI1 and for cancers transformed by different CTBP-dependent oncogenic transcription factors.


Figures

Fig. 1.
Fig. 1.. CTBP1 and CTBP2 bind EVI1.
(A) Differential enrichment of proteins binding to EVI1 as determined by an EVI1 specific IP compared to a nonspecific IgG IP followed by MS in MUTZ3 nuclear protein extracts (n = 3 for each group, thresholds log2FC > 1 and P value < 0.05). FC, fold change. Top 4 enriched gene identifiers are highlighted in red [MECOM (EVI1), CTBP1, and CTBP2]. In addition, several previously identified MECOM interactors are shown in gray (BioGrid). (B) Network plot of protein complex enrichment analysis of the proteins coprecipitated with EVI1 IP in MUTZ3 cells. The connections (edges) between proteins (nodes) were weighted on the basis of their co-occurrence in CORUM complexes. Node color represents the cluster assigned to a protein; dot size represents the fold enrichment in the IP. Font size of CTBP1 and CTBP2 was adjusted manually, and colored areas and their corresponding labels were added manually based on the common biochemical functions. The full plot with all labels is presented in fig. S1C. (C) Heatmaps of ChIP-seq experiments in MUTZ3 cells using antibodies directed to the indicated transcription factors or histone modifications. Ranking was based on the ChIP-seq EVI1 signal (leftmost panel) showing signal intensity of indicated ChIP-seq tracks in a ± 1000-bp region centered on EVI1 peaks (21505 peaks). (D) Quantification of the heatmap in (C). Normalized EVI1 signal is plotted versus the normalized reads in the indicated ChIP-seq tracks for all EVI1 peaks with a window of ±1000 bp. Correlation coefficients and linear regression equations are shown for log10-transformed data with a pseudo count of 1. (E) Heatmap of CTBP2 ChIP-seq data following dox-inducible short hairpin RNA–mediated knockdown of EVI1 (48 hours) in MOLM1 cells. On the right, EVI1 heatmap in unperturbed MOLM1 cells. Tracks are ranked on peaks in the CTBP2 control track (leftmost panel, 64,569 peaks).
Fig. 2.
Fig. 2.. Identification of a competitive inhibitor of EVI1-CTBP2 interaction.
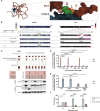
(A) EVI1-CTBP2 interaction as predicted by AlphaFold and visualized with ChimeraX. EVI1 is shown in maroon, with the PLDLS residues highlighted. CTBP2 is depicted in dark blue. (B) Frequency of the involvement of individual residues in EVI1 and CTBP2 in the interaction between these two proteins as predicted by AlphaFold and quantified in ChimeraX (using the “interfaces” command with default parameters) for all 25 structures per heterodimer prediction. (C) IP of overexpressed EVI1-FLAG with anti-FLAG antibody, followed by WB for CTBP2 and FLAG in lysates from HEK293T cells transfected with wild type (WT) or mutated EVI1-FLAG. The diagram indicates sites of deletions and mutations. (D) MAPPIT assay in HEK293T cells to measure EVI1-CTBP interaction. Mutations introduced in EVI1 are similar to (C). Reporter induction is normalized to –EPO (not induced) and maximum induction with RNF as positive control. Statistical significance is determined with a mixed-effects model (significance shown if P < 0.05 and N > 1) in one to three independent experiments (all independent experiments are performed in triplicate); means + SD is shown. (E) MAPPIT assay in HEK293T cells to measure EVI1-CTBP2 interaction, with mutations disrupting residues in CTBP2. Those residues have been previously reported to be important for target protein binding via PXDLS motifs (n = 2 to 5 in triplicate) (53). Reporter induction is normalized to –EPO (not induced) and maximum induction with RNF as positive control. Statistical significance is determined with a two-way analysis of variance (ANOVA) (significance shown if P < 0.05) in two to five independent experiments (all independent experiments are performed in triplicate); means + SD is shown. (F) Colony formation of mouse bone marrow cells transduced with empty vector, full-length EVI1, or EVI1 without PLDLS domain. Statistical significance was determined with a two-way ANOVA with EVI1 as reference (all comparisons shown). Experiment performed in triplicate.
Fig. 3.
Fig. 3.. Disruption of CTBP2 binding to EVI1 with PLDLS inhibitor.
(A) AlphaFold prediction of the interaction of the PLDLS inhibitor with CTBP2 visualized with ChimeraX. The PLDLS residues are shown in different colors according to their biochemical properties and CTBP2 is depicted in dark blue. (B) Diagram outlining the 4× PLDLS inhibitor and 4× PLASS control constructs. Each repeat consists of two human (hEVI1) and two mouse (mEvi1) PLDLS surrounding region (±15 amino acids); NLS, nuclear localization signal. (C) MAPPIT assay in HEK293T cells to measure EVI1-CTBP2 interaction as in Fig. 2 with 4× PLDLS inhibitor or 4× PLASS control. Reporter induction is normalized to –EPO (not induced) and maximum induction with RNF as positive control. Significance was determined with two-way ANOVA (comparison PLDLS versus PLASS + EPO shown). (D) WB for CTBP1 and CTBP2 following IP for EVI1 in MUTZ3 cells with dox-induced 4× PLASS or 4× PLDLS expression. (E) Differential enrichment in MS following IP for EVI1 in MUTZ3 cells with dox-induced 4× PLDLS or 4× PLASS expression. A negative log2 fold change indicates depletion from EVI1 complex upon PLDLS overexpression; the proteins that fall into the gray rectangle have reduced binding to EVI1 upon overexpression of 4× PLDLS. (F) Heatmap of ChIP-seq data for CTBP2 in MUTZ3 cells following retroviral transduction with either 4× PLASS (control) or 4× PLDLS (inhibitor). Consensus CTBP2 binding sites were determined by DiffBind (5634 peaks). Tracks were ranked by the average DiffBind enrichment in the control tracks. Enrichment in an untreated EVI1 track is shown for comparison. (G) Representative plot showing the effect of 4× PLDLS overexpression induction with doxycycline (72 hours) on the locus of GFI1B. (RE, regulatory element associated with expression of GFI1B). Top track is on primary material from an inv(3) patient; the other tracks are from MUTZ3.
Fig. 4.
Fig. 4.. Inhibition of EVI1-CTBP2 in transformed mouse bone marrow abolishes leukemic potential.
(A) Diagram illustrating the procedure for functionally testing inhibitors of the EVI1-CTBP interaction. For all experiments on EVI1-transformed bone marrow shown, bone marrow of 8- to 10-week-old mice was collected and transduced with a retroviral EVI1-eGFP construct. The immortalized cells acquired after four rounds of serial replating were transduced with retroviral vectors containing no insert (empty vector), a 4× PLASS control, or 4× PLDLS (inhibitor). (B) Colony formation of lineage-negative (Lin) mouse bone marrow cells (left), Lin cells immortalized with E2A-PBX (middle), or with EVI1 (right). Before plating, cells were transfected with empty vector, PLASS (control), or PLDLS (inhibitor) and selected with puromycin. All experiments were performed in triplicate; each dot represents the average of technical triplicates of an independent experiment (n = 1 to 4). Adjusted P value of two-way ANOVA with Šídák’s multiple comparisons test shown if adjusted P value < 0.05. Between-group comparison shown on graph; within-group test results are included in table S1. (means + SD plotted). (C) Flow cytometric analysis of Lin mouse bone marrow transduced with EVI1, and with empty vector, 4× PLASS, or 4× PLDLS, stained with CD11b-phycoerythrin (PE) and Gr1-allophycocyanin (APC) (single-cell gate shown) [day 7; cultured in media with cytokines including granulocyte-macrophage colony-stimulating factor (GM-CSF)]. (D) May-Grünwald Giemsa staining of cytospins made from Lin mouse bone marrow transduced with EVI1, together with empty vector, 4× PLASS, or 4× PLDLS (day 7; cultured in media with cytokines including GM-CSF) [same experiment as (C); magnification, ×63].
Fig. 5.
Fig. 5.. In vivo growth inhibition of EVI1-transformed human leukemia cells using EVI1-CTBP2 inhibitor.
(A) Colony formation of human EVI1 (HL-60) or EVI1+ (SB1690 or MUTZ3) cell lines, which are retrovirally transduced with either 4× PLDLS or 4× PLASS. All experiments were performed in triplicate, n = 2 to 4 experiments per cell line (two-way ANOVA with multiple testing correction; within-group test results in table S1). (B) SB1690 cells were lentivirally transduced and mixed to 1:1 ratio Emerald:mCherry on day 0. Flow cytometric analysis at day 13 is shown. Left: 4× PLDLS-mCherry and 4× PLASS-Emerald; right: 4× PLDLS-Emerald and 4× PLASS-mCherry. (C) Competition between 4× PLASS and 4× PLDLS in SB1690CB over time. Frequencies are grouped by whether they contain inhibitor (PLDLS) or control (PLASS). (D) Competition between 4× PLASS and 4× PLDLS in MUTZ3 over time. Quantification of Emerald and mCherry gates as a fraction of all transduced cells in the experiment (fig. S7B) grouped by whether they contain inhibitor (PLDLS) or control (PLASS). (E) Outline of SB1690CB competition in NSG mice. Before transplant, cells were separately transduced with PLDLS-Emerald or PLASS-mCherry and mixed in a 1:1 ratio. (F) Flow cytometric analysis of input and bone marrow of seven mice transplanted with SB1690. Percentage of 4× PLDLS-positive cells is indicated above each bar. (G) Diagram of procedure to engraft human MUTZ3 into NSG mice. Before transplantation, human bone marrow scaffolds are surgically implanted. Mice are injected with either MUTZ3-Luciferase-4× PLDLS inhibitor or MUTZ3-Luciferase-4× PLASS control. Upon injection with luciferin, mice are imaged in a luminescence scanner to monitor outgrowth (fig. S7E). (H) Tumor area of mice who received either a transplant of MUTZ3-Luciferase-4× PLDLS inhibitor or MUTZ3-Luciferase-4× PLASS control (n = 4 mice with two scaffolds each for PLDLS and n = 6 mice with two scaffolds each for PLASS). (I) Scaffolds of mice with engraftment of 4× PLASS or 4× PLDLS.

References

    1. Papaemmanuil E., Gerstung M., Bullinger L., Gaidzik V. I., Paschka P., Roberts N. D., Potter N. E., Heuser M., Thol F., Bolli N., Gundem G., van Loo P., Martincorena I., Ganly P., Mudie L., McLaren S., O’Meara S., Raine K., Jones D. R., Teague J. W., Butler A. P., Greaves M. F., Ganser A., Döhner K., Schlenk R. F., Döhner H., Campbell P. J., Genomic classification and prognosis in acute myeloid leukemia. N. Engl. J. Med. 374, 2209–2221 (2016). - PMC - PubMed
    1. Ottema S., Mulet-Lazaro R., Beverloo H. B., Erpelinck C., van Herk S., van der Helm R., Havermans M., Grob T., Valk P. J. M., Bindels E., Haferlach T., Haferlach C., Smeenk L., Delwel R., Atypical 3q26/MECOM rearrangements genocopy inv(3)/t(3;3) in acute myeloid leukemia. Blood 136, 224–234 (2020). - PubMed
    1. Groschel S., Sanders M. A., Hoogenboezem R., de Wit E., Bouwman B. A. M., Erpelinck C., van der Velden V. H. J., Havermans M., Avellino R., van Lom K., Rombouts E. J., van Duin M., Döhner K., Beverloo H. B., Bradner J. E., Döhner H., Löwenberg B., Valk P. J. M., Bindels E. M. J., de Laat W., Delwel R., A single oncogenic enhancer rearrangement causes concomitant EVI1 and GATA2 deregulation in leukemia. Cell 157, 369–381 (2014). - PubMed
    1. Smeenk L., Ottema S., Mulet-Lazaro R., Ebert A., Havermans M., Varea A. A., Fellner M., Pastoors D., van Herk S., Erpelinck-Verschueren C., Grob T., Hoogenboezem R. M., Kavelaars F. G., Matson D. R., Bresnick E. H., Bindels E. M., Kentsis A., Zuber J., Delwel R., Selective requirement of MYB for oncogenic hyperactivation of a translocated enhancer in leukemia. Cancer Discov. 11, 2868–2883 (2021). - PMC - PubMed
    1. Yamazaki H., Suzuki M., Otsuki A., Shimizu R., Bresnick E. H., Engel J. D., Yamamoto M., A remote GATA2 hematopoietic enhancer drives leukemogenesis in inv(3)(q21;q26) by activating EVI1 expression. Cancer Cell 25, 415–427 (2014). - PMC - PubMed

MeSH terms