. 2024 May 17;10(20):eadl0633.
doi: 10.1126/sciadv.adl0633. Epub 2024 May 15.

egr3 is a mechanosensitive transcription factor gene required for cardiac valve morphogenesis

Affiliations

egr3 is a mechanosensitive transcription factor gene required for cardiac valve morphogenesis

Agatha Ribeiro da Silva et al. Sci Adv. .

Abstract

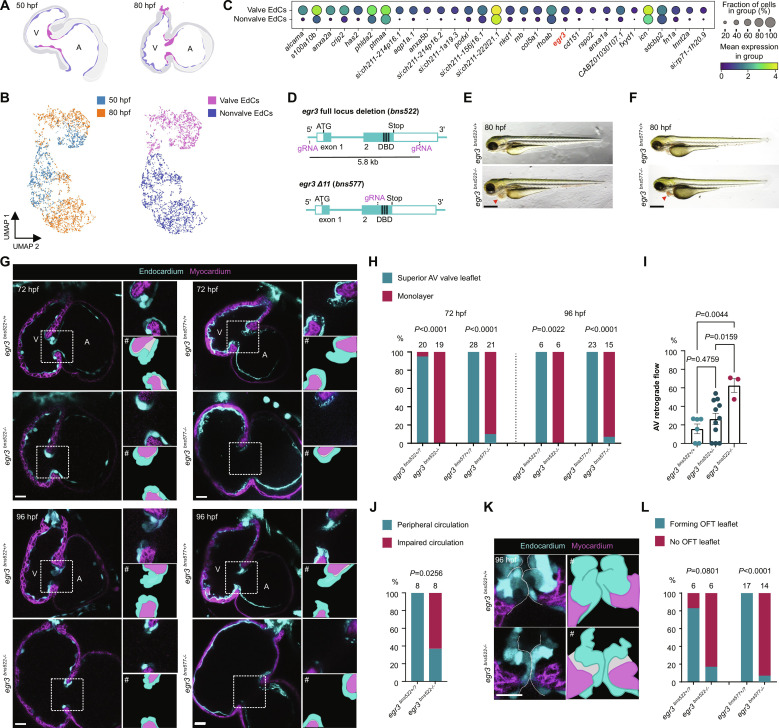
Biomechanical forces, and their molecular transducers, including key mechanosensitive transcription factor genes, such as KLF2, are required for cardiac valve morphogenesis. However, klf2 mutants fail to completely recapitulate the valveless phenotype observed under no-flow conditions. Here, we identify the transcription factor EGR3 as a conserved biomechanical force transducer critical for cardiac valve formation. We first show that egr3 null zebrafish display a complete and highly penetrant loss of valve leaflets, leading to severe blood regurgitation. Using tissue-specific loss- and gain-of-function tools, we find that during cardiac valve formation, Egr3 functions cell-autonomously in endothelial cells, and identify one of its effectors, the nuclear receptor Nr4a2b. We further find that mechanical forces up-regulate egr3/EGR3 expression in the developing zebrafish heart and in porcine valvular endothelial cells, as well as during human aortic valve remodeling. Altogether, these findings reveal that EGR3 is necessary to transduce the biomechanical cues required for zebrafish cardiac valve morphogenesis, and potentially for pathological aortic valve remodeling in humans.


Figures

Fig. 1.
Fig. 1.. Egr3 is required for cardiac valve formation.
(A) Schematic of hearts isolated for scRNA-seq; valve EdCs (magenta), nonvalve EdCs (blue). (B) scRNA-seq of EdCs from 50 and 80 hpf dissected zebrafish hearts. (C) Dot plot of 30 most differentially expressed genes in valve compared with nonvalve EdCs. (D) Schematic of generation of egr3 full locus deletion (bns522) and Δ11 (bns577) alleles. (E and F) Brightfield images of egr3+/+ and egr3−/− sibling larvae at 80 hpf; red arrowheads point to pericardial edema. (G) Confocal images of representative hearts from 72 and 96 hpf egr3+/+ and egr3−/− sibling larvae. (H) Percentage of egr3+/+ and egr3−/− sibling larvae with a superior valve leaflet and without a superior valve leaflet (i.e., endocardial monolayer) at 72 and 96 hpf; seven and four independent experiments, respectively. (I) AV retrograde blood flow shown as a fraction of three cardiac cycles; n = 6, 11, and 3; one experiment; mean ± SEM, one-way ANOVA followed by Tukey’s post hoc test. (J) Peripheral circulation in the caudal vein plexus at 80 hpf, one experiment. (K) Confocal images of representative OFT valves from 96 hpf egr3+/+ and egr3−/− sibling larvae. (L) Percentage of egr3+/+ and egr3−/− sibling larvae with and without forming OFT leaflets at 96 hpf; four independent experiments. (G and K) EdCs are marked by Tg(kdrl:eGFP) expression (cyan), and myocardial cells by Tg(myl7:BFP-CAAX) expression (magenta). # indicates illustrative vectorized cartoons of the valves. (H), (J), and (L) Fisher’s exact test. AV, atrioventricular; V, ventricle; A, atrium; OFT, OFT; DBD, DNA binding domain; EdC, EdC. Scale bars, 400 μm [(E) and (F)] and 20 μm [(G) and (K)].
Fig. 2.
Fig. 2.. Endothelial-specific deletion of egr3 recapitulates the global mutant phenotype.
(A) Schematic of the knock-in reporter [Pt(egr3:Gal4-VP16)] generated by inserting Gal4-VP16 in exon 2 of egr3. (B) Pt(egr3:Gal4-VP16); Tg(UAS:eGFP) expression (gray) at 72 hpf; EdCs are marked by Tg(kdrl:Hsa.HRAS-mCherry) expression (cyan) and myocardial cells by Tg(myl7:BFP-CAAX) expression (magenta); yellow arrowheads point to AV canal egr3 reporter+ cardiomyocytes. (B′) Maximum projection of Pt(egr3:Gal4-VP16); Tg(UAS:eGFP) expression with image segmentation of egr3 reporter+ AV canal EdCs (cyan), egr3 reporter+ AV canal myocardial cells (magenta), and egr3 reporter+ OFT cells (yellow). (C) Schematic of egr3 floxed allele Pt(egr3:loxP-egr3-loxP). (D) Confocal images of representative hearts from 72 hpf egr3+/+, endothelial cell–specific egr3−/−, and myocardial cell–specific egr3−/− larvae using the egr3 floxed allele line. (E and F) Percentage of 72 hpf egr3+/?, endothelial cell–specific egr3−/− (E), and myocardial cell–specific egr3−/− (F) larvae with a superior valve leaflet and without a superior valve leaflet (i.e., endocardial monolayer); one and two independent experiments, respectively; Fisher’s exact test. Scale bars, 20 μm.
Fig. 3.
Fig. 3.. egr3 is necessary for EdC migration, which is required for cardiac valve formation.
(A) RNA-seq heatmap analysis of differentially expressed genes; fold change ± 1.5, Padj < 0.05, mean > 5. (B) scRNA-seq endocardial expression pattern of Egr3 targets nr4a2b and spp1. (C) In situ hybridization for Egr3 targets nr4a2b and spp1 in egr3+/+ and egr3−/− siblings at 48 hpf. (D) Confocal images of representative hearts from 48 hpf egr3+/? and egr3−/− sibling embryos displaying, respectively, AV EdC protrusions toward the ECM and no protrusions; EdCs are marked by Tg(kdrl:eGFP) expression (cyan). (E) Percentage of hearts from 48 hpf egr3+/? and egr3−/− sibling embryos displaying AV EdC protrusions toward the ECM; three independent experiments. (F) Confocal images of representative hearts from 55 hpf egr3+/− and egr3−/− sibling embryos displaying, respectively, collective AV EdC migration and no migration; EdCs are marked by Tg(kdrl:NLS-mCherry) expression (gray) and AV EdCs by Pt(egr3:Gal4-VP16);Tg(UAS:eGFP) expression (green). (G) Percentage of hearts from 55 hpf egr3+/− and egr3−/− sibling embryos displaying AV EdC migration; three independent experiments. (H) Number of migrating AV EdCs per heart in 55 hpf egr3+/− and egr3−/− sibling embryos; n = 18 and 17 embryos; three independent experiments. Student’s t test, mean ± SEM. (E) and (G) Fisher’s exact test. Scale bars, 20 μm.
Fig. 4.
Fig. 4.. egr3 triggers EdC migration and Alcama expression.
(A) 3D reconstruction of representative hearts from control [Tg(fli1a:Gal4);Tg(UAS:Kaede)] and endothelial-specific egr3-overexpressing [Tg(fli1a:Gal4);Tg(UAS:Kaede);Tg(UAS:egr3-p2a-dTomato)] 72 hpf larvae; magnified regions show single z planes of the atrium from control and endothelial-specific egr3-overexpressing 72 hpf larvae; yellow arrowheads point to Tg(UAS:egr3-p2a-dTomato)+ atrial EdCs in the adjacent ECM. (B) Confocal images of representative AV VIC quantification through the spot render function in Imaris; VICs (magenta spots). (C) Quantification of EdCs present in the ECM per cardiac region in 72 hpf endothelial-specific egr3-overexpressing larvae; n = 9 control and 22 egr3 OE larvae, n = 0 and 0.14 EdCs (ventricle), n = 5 and 13.36 EdCs (AV canal), n = 0 and 0.59 EdCs (atrium). (D) Confocal images of representative hearts from control [Tg(fli1a:Gal4);Tg(UAS:Kaede)] and endothelial-specific egr3-overexpressing [Tg(fli1a:Gal4);Tg(UAS:Kaede);Tg(UAS:egr3-p2a-dTomato)] 54 hpf embryos immunostained for Alcama; magnified regions show Alcama+ cells in the AV canal of the control heart and in the atrium of the Tg(UAS:egr3-p2a-dTomato) heart. (E) Quantification of Alcama+ EdCs per cardiac region of control and endothelial-specific egr3-overexpressing embryos at 54 hpf; n = 13 control and 14 egr3 OE embryos, n = 0.07 and 3.28 EdCs (ventricle), n = 31.77 and 42.86 EdCs (AV canal), n = 0.38 and 4.71 EdCs (Atrium); three independent experiments. (F) Confocal images of representative hearts from control Pt(egr3:Gal4-VP16) and egr3-driven nr4a2b-overexpressing [Pt(egr3:Gal4-VP16); Tg(UAS:nr4a2b-p2a-dTomato)] egr3−/− larvae at 72 hpf. (G) Quantification of EdCs present in the AV canal ECM of control and nr4a2b-overexpressing egr3−/− larvae at 72 hpf; n = 16 and 15 larvae; two independent experiments. (C), (E), and (G) Student’s t test, mean ± SEM. Scale bars, 20 μm.
Fig. 5.
Fig. 5.. egr3 expression in the heart is regulated by biomechanical forces.
(A) In situ hybridization for egr3 expression in 48 hpf tnnt2a+/+ and tnnt2a−/− sibling embryos. (B) Illustration of bead insertion into a 48 hpf heart. (C) Pt(egr3:Gal4-VP16); Tg(UAS:eGFP) expression (gray) at 72 hpf in bead-inserted larva versus sham; myocardial cells are marked by Tg(myl7:BFP-CAAX) expression (magenta) and EdCs by Tg(kdrl:Hsa.HRAS-mCherry) expression (cyan). Red dotted circle highlights inserted bead; yellow arrowhead points to egr3+ cells near the bead. (D) Quantification of total volume of egr3 reporter+ cells in bead-inserted larvae and sham; n = 3 sham and 5 experimental larvae; one experiment. (E) Confocal images of representative hearts from control [Tg(fli1a:Gal4);Tg(UAS:Kaede)] and endothelial-specific egr3-overexpressing [Tg(fli1a:Gal4);Tg(UAS:Kaede);Tg(UAS:egr3-p2a-dTomato)] tnnt2a MO–injected embryos immunostained for Alcama at 54 hpf; magnified regions show the AV canal of tnnt2a MO–injected embryos with rescued Alcama expression in the Tg(UAS:egr3-p2a-dTomato) embryo. (F) Quantification of Alcama+ EdCs per cardiac region of tnnt2a MO–injected embryos at 54 hpf; n = 6 control and 6 egr3 OE embryos, n = 0.00 and 8.00 EdCs (ventricle), n = 0.00 and 13.00 EdCs (AV canal), n = 0.00 and 4.83 EdCs (Atrium); two independent experiments. (G) Oscillatory shear stress induces the expression of the mechanosensitive transcription factor gene egr3 in valve EdCs, where it orchestrates valvulogenesis by promoting Alcama expression and their migration via Nr4a2b. (H) Schematic of aortic valve collection from LVAD patients and control donors. (I) Relative mRNA levels of EGR3, KLF2, NR4A2, and SPP1 from aortic valves of LVAD patients and control donors; n = 4 and 4 to 6; one experiment. Ct values can be found in data S1. (D), (F), and (I) Student’s t test, mean ± SEM. (B) and (H) Illustrations were generated with Biorender.com. Scale bars, 20 μm.

References

    1. Vignes H., Vagena-Pantoula C., Vermot J., Mechanical control of tissue shape: Cell-extrinsic and -intrinsic mechanisms join forces to regulate morphogenesis. Semin. Cell Dev. Biol. 130, 45–55 (2022). - PubMed
    1. Priya R., Allanki S., Gentile A., Mansingh S., Uribe V., Maischein H. M., Stainier D. Y. R., Tension heterogeneity directs form and fate to pattern the myocardial wall. Nature 588, 130–134 (2020). - PubMed
    1. Daems M., Peacock H. M., Jones E. A. V., Fluid flow as a driver of embryonic morphogenesis. Development 147, dev185579 (2020). - PubMed
    1. Sidhwani P., Yelon D., Fluid forces shape the embryonic heart: Insights from zebrafish. Curr. Top. Dev. Biol. 132, 395–416 (2019). - PMC - PubMed
    1. Trimm E., Red-Horse K., Vascular endothelial cell development and diversity. Nat. Rev. Cardiol. 20, 197–210 (2023). - PMC - PubMed