. 2024 May 21;5(5):101570.
doi: 10.1016/j.xcrm.2024.101570. Epub 2024 May 14.

SARS-CoV-2 infection exacerbates the cellular pathology of Parkinson's disease in human dopaminergic neurons and a mouse model

Affiliations

SARS-CoV-2 infection exacerbates the cellular pathology of Parkinson's disease in human dopaminergic neurons and a mouse model

Bina Lee et al. Cell Rep Med. .

Abstract

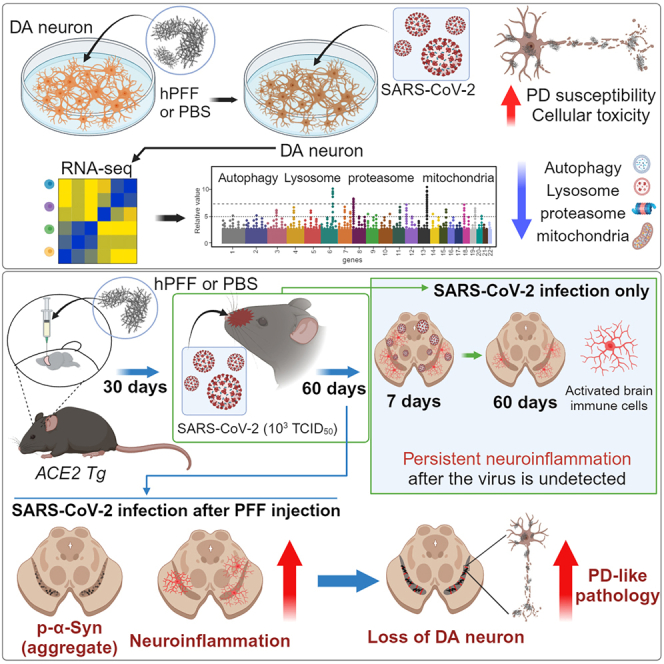
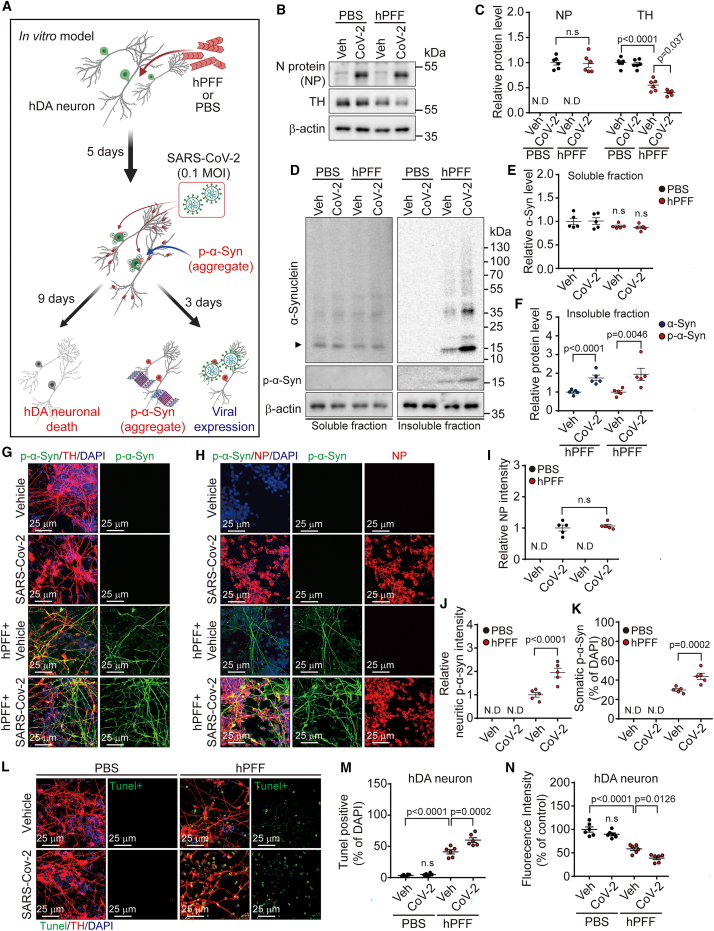
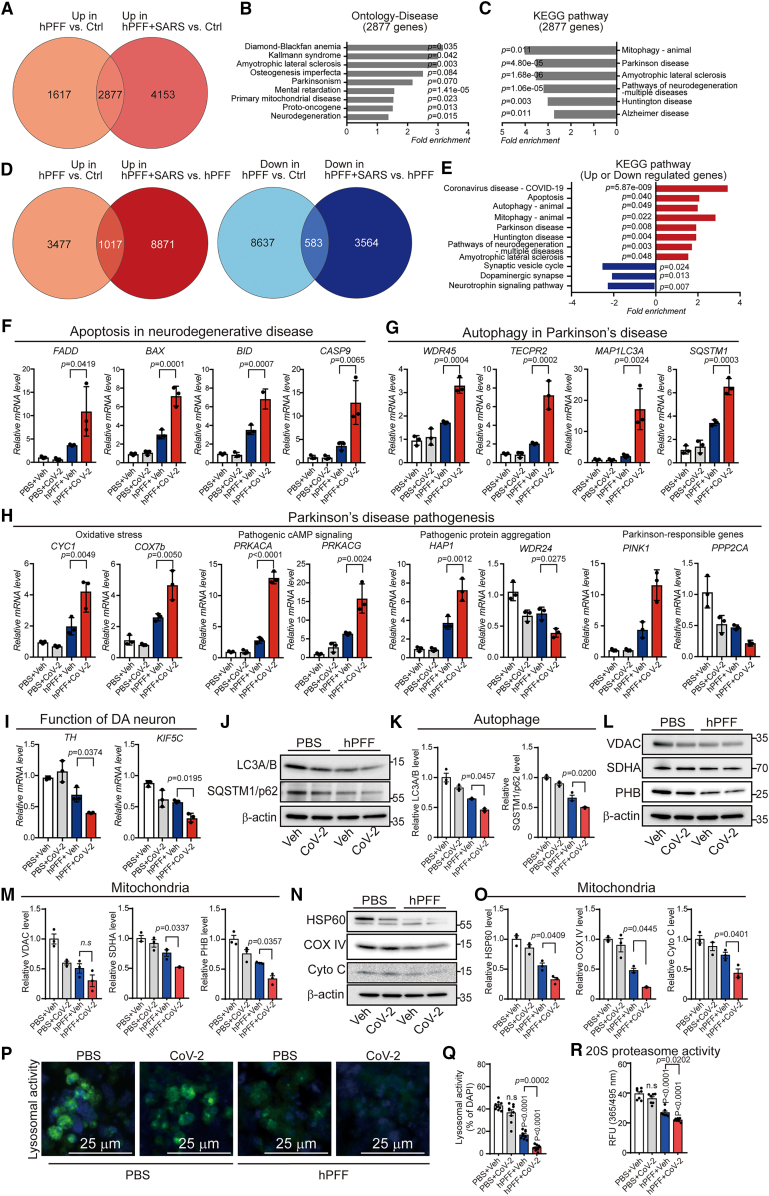
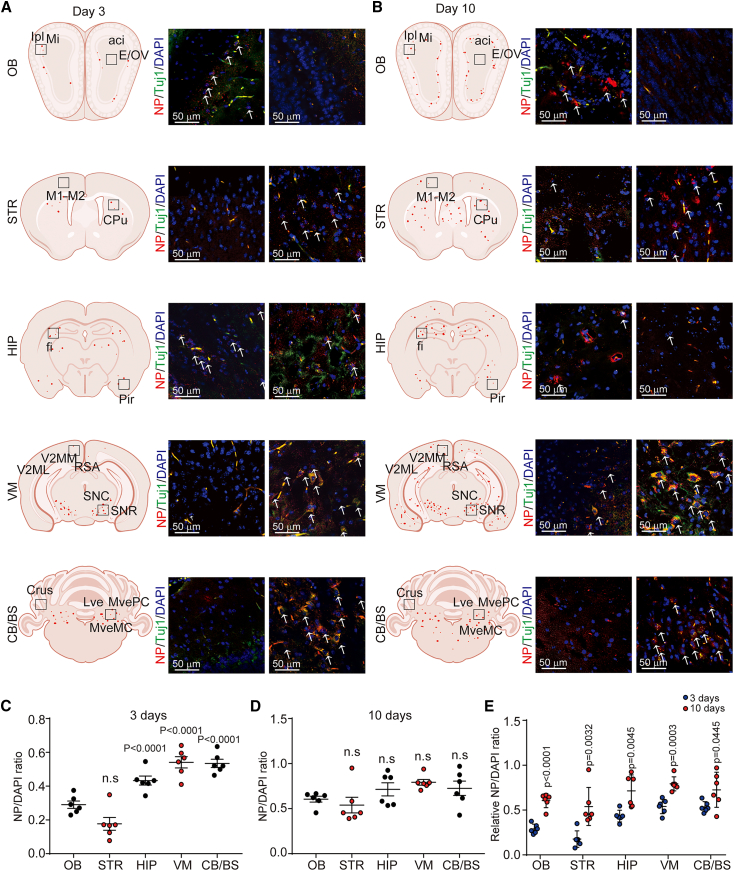
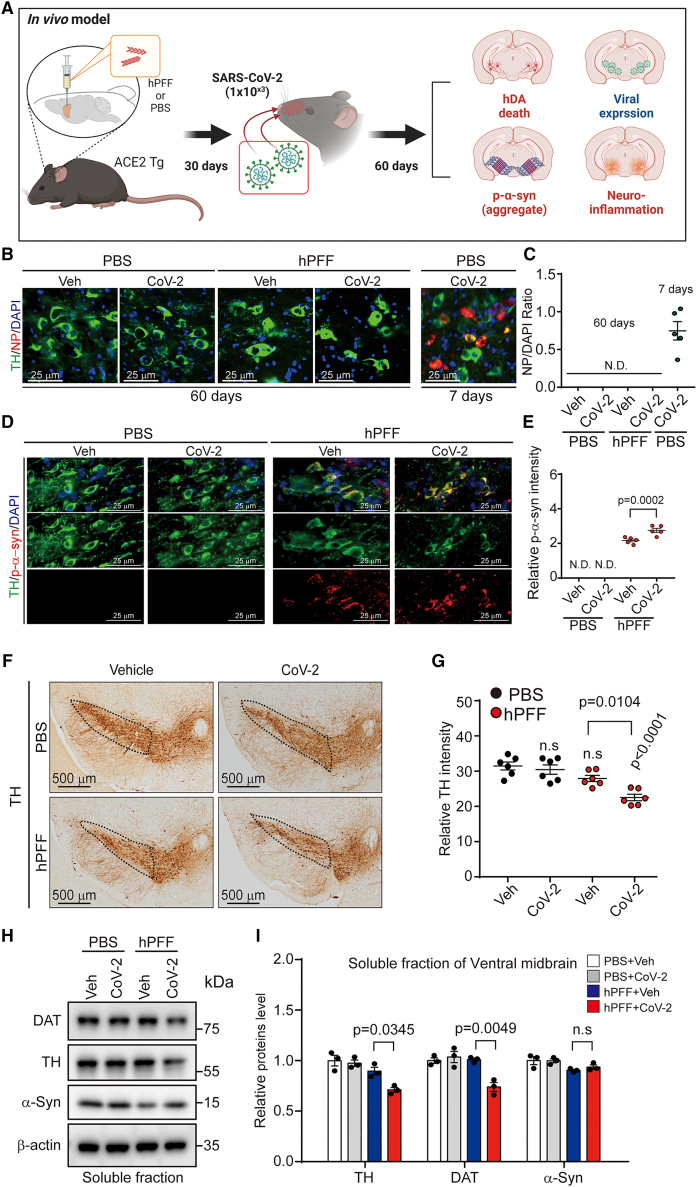
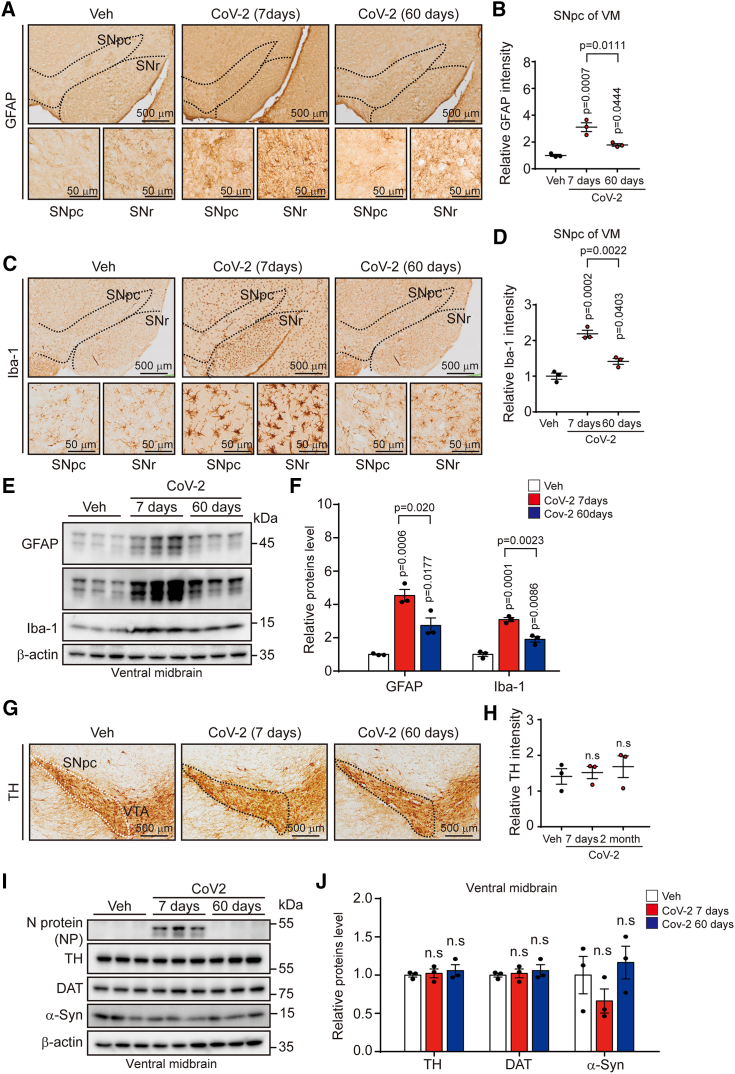
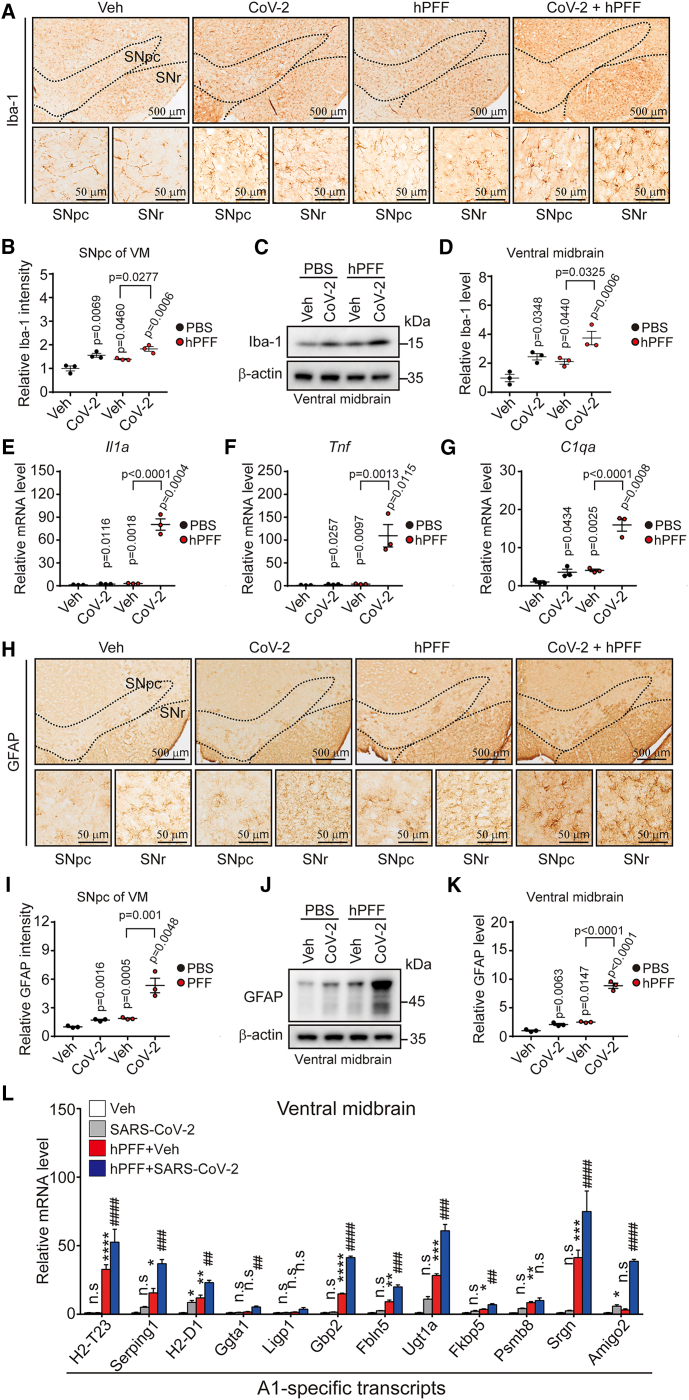
While an association between Parkinson's disease (PD) and viral infections has been recognized, the impact of severe acute respiratory syndrome coronavirus 2 (SARS-CoV-2) on PD progression remains unclear. Here, we demonstrate that SARS-CoV-2 infection heightens the risk of PD using human embryonic stem cell (hESC)-derived dopaminergic (DA) neurons and a human angiotensin-converting enzyme 2 (hACE2) transgenic (Tg) mouse model. Our findings reveal that SARS-CoV-2 infection exacerbates PD susceptibility and cellular toxicity in DA neurons pre-treated with human preformed fibrils (hPFFs). Additionally, nasally delivered SARS-CoV-2 infects DA neurons in hACE2 Tg mice, aggravating the damage initiated by hPFFs. Mice infected with SARS-CoV-2 display persisting neuroinflammation even after the virus is no longer detectable in the brain. A comprehensive analysis suggests that the inflammatory response mediated by astrocytes and microglia could contribute to increased PD susceptibility associated with SARS-CoV-2. These findings advance our understanding of the potential long-term effects of SARS-CoV-2 infection on the progression of PD.

Keywords: COVID-19 sequalae; DA neuron; PD; Parkinson’s disease; SARS-CoV-2; disease modeling; dopaminergic neuron; hACE2 transgenic mouse; neuroinflammation; neurological sequelae.


Conflict of interest statement

Declaration of interests The authors declare no competing interests.

Figures

None
Graphical abstract
Figure 1
Figure 1
Pathology of SARS-CoV-2 infection with hPFF-induced PD in hESC-derived DA neurons (A) Schematic experimental summary of DA neurons infected with SARS-CoV-2 (0.1 MOI) infection and treated with hPFFs. (B) Representative western blot bands of nucleocapsid protein (NP) and TH levels in hDA neurons infected with SARS-CoV-2 and then treated with hPFFs. (C) Quantification of NP and TH levels. n = 6, biological repeat. (D) Representative western blot expression of α-Syn and p-α-Syn in hDA neurons treated with SARS-CoV-2 and/or hPFFs. (E) Quantification of α-Syn western blot levels. n = 5, biological repeat. (F) Quantification of p-α-Syn western blot levels. n = 5, biological repeat, values are mean ± SEM, one-way ANOVA. (G) Representative immunofluorescence image of p-α-Syn (green) and TH (red). (H) Representative immunofluorescence image of p-α-Syn (green) and NP (red). (I) Quantification of NP. n = 5, biological repeat, values are mean ± SEM, unpaired two-tailed Student’s t tests. (J) The neuritic p-α-Syn intensity. The intensity excluding the somatic region of p-α-Syn was measured using ImageJ. n = 5, biological repeat. (K) The percentage of somatic p-α-Syn contrasted with DAPI. For the somatic p-α-Syn-positive cells, manual counting was conducted, considering only cells positive for both DAPI and p-α-Syn staining. n = 5, biological repeat. (L) Representative image of TUNEL staining of DA neurons infected with SARS-CoV-2 and treated with hPFFs. (M) Quantification of TUNEL-positive DA neuron cells. n = 6, biological repeat. (N) A graph showing the difference in cell viability measured with Alamar Blue. n = 6, biological repeat, values are mean ± SEM, one-way ANOVA. n.s., non-significance; N.D., non-detection. See also Figures S1–S3.
Figure 2
Figure 2
Molecular pathogenesis of SARS-CoV-2 infection with hPFF-induced PD progression in hESC-derived DA neurons (A) Venn diagram indicating upregulated genes related to hPFF-induced PD progression or hPFF-induced PD progression with SARS-CoV-2 (0.1 MOI) infection. (B) Results of Gene Ontology analysis using genes upregulated in hPFF-induced PD progression and hPFF-induced PD progression with SARS-CoV-2 infection. (C) Results of KEGG pathway analysis using genes upregulated in hPFF-induced PD progression and hPFF-induced PD progression with SARS-CoV-2 infection. (D) Venn diagram illustrating genes involved in the pathogenesis of hPFF-induced PD progression that are exacerbated by SARS-CoV-2 infection. (E) The results of KEGG pathway analysis employing genes that are exacerbated by SARS-CoV-2 infection among genes involved in hPFF-induced PD progression. (F) Validation of neuronal-apoptosis-related gene expression using quantitative real-time PCR. n = 3, biological replicates. (G) Validation of PD-associating autophagy-related gene expression using quantitative real-time PCR. n = 3, biological repeat. (H) Validation of PD pathogenesis-associated gene expression using quantitative real-time PCR n = 3, biological repeat. (I) Validation of DA neuron functional gene expression levels using quantitative real-time PCR. n = 3, biological repeat, values are mean ± SD, one-way ANOVA. (J) Representative western blot images of LC3A/B and SQSTM1/p62 to analyze autophagic function in human DA neurons. (K) Quantitative graphs of LC3A/B and SQSTM1/p62 from (J). n = 3, biological repeat, values are mean ± SEM, one-way ANOVA. (L) Representative western blot images of voltage-dependent anion channel (VDAC), succinate dehydrogenase (SDHA), and prohibitins (PHBs) to analyze mitochondrial function in cells. (M) Quantitative graph of VDAC, SDHA, and PHBs from (L). n = 3, biological repeat, values are mean ± SEM, one-way ANOVA. (N) Representative Western blot images of HSP60, cytochrome c oxidase (COX) IV, and cytochrome c (Cyto C) to analyze mitochondrial function in human DA neurons. (O) Quantitative graphs of HSP60, COX IV, and Cyto C from (N). (P) Fluorescent microscopy images of the lysosomal intracellular activity assay. (Q) Quantitative graph corresponding to the assay results from (P). n = 9, biological repeat, values are mean ± SEM, one-way ANOVA. (R) Results data from the 20S proteasome assay. n = 7, biological repeat, values are mean ± SEM, one-way ANOVA. n.s., non-significance.
Figure 3
Figure 3
Brain mapping of mice infected with SARS-CoV-2 (A and B) Brain mapping of mice (A) 3 and (B) 10 days after 103 TCID50 SARS-CoV-2 infection. Ipl, internal plexiform layer of the olfactory bulb (OB); Mi, mitral cell layer of the OB; eci, ependymal and subendymal layer/olfactory ventricle; E/OV, anterior commissure, intrabulbar part; M1, primary motor cortex; M2, secondary motor cortex; CPu, caudate putamen (STR); fi, fimbria of the hippocampus (HIP), Pri, piriform cortex; V2ML, secondary visual cortex, mediolateral area; V2MM, secondary visual cortex, mediomedial area; RSA, retrosplenial agranular cortex; SNC, substantia nigra, compact part; SNR, substantia nigra, reticular part; Crus, crus of the ansiform lobule; Lve, lateral vestibular nucleus; MvePC, medial vestibular nucleus, parvicellular; MveMC, medial vestibular nucleus, magnocellular. (C) NP infection/DAPI ratio cell count graph in OB, STR, HIP, VM, and cerebrum (CB)/brain stem (BS) regions on day 3. (D) NP infection/DAPI cell count ratio graph in the OB, STR, HIP, VM, and CB/BS regions on day 10. (E) Comparison graph between day 3/10 NP infection/DAPI cell count ratio graphs in the OB, STR, HIP, VM, and CB/BS regions. n = 3, biological repeat, values are mean ± SEM, one-way ANOVA. n.s., non-significance.
Figure 4
Figure 4
SARS-CoV-2 increased hPFF-induced PD-like pathology (A) Schematic diagram of the SARS-CoV-2 (103 TCID50) infection schedule in ACE2 Tg mice treated with hPFF. (B) Representative immunofluorescence image of TH (green) and NP (red). (C) NP/DAPI ratio of (B). (D) Representative immunofluorescence image of TH (green) and p-α-Syn (red). (E) Quantification of (D) p-α-Syn intensity in VM at 60 days. n = 5, biological repeat, values are mean ± SEM, one-way ANOVA. (F) Representative TH immunohistochemistry images of the VM region of ACE2 Tg mice. (G) Quantification of (F) TH intensity. n = 6, biological repeat, values are mean ± SEM, one-way ANOVA. (H) Representative western blot bands of DAT, TH, α-Syn, and β-actin in VM tissue. (I) Quantification of DAT, TH, and α-Syn levels from (H). n = 3, biological repeat, values are mean ± SEM, one-way ANOVA. n.s., non-significance; N.D., non-detection. See also Figure S4.
Figure 5
Figure 5
Infection with SARS-CoV-2 sustained the expression of GFAP and Iba-1 for 60 days (A) Representative GFAP immunochemistry images of the VM region of ACE2 Tg mice infected with SARS-CoV-2 (103 TCID50). (B) Quantification of GFAP in the SNpc region. n = 3, biological repeat, values are mean ± SEM, one-way ANOVA. (C) Representative Iba-1 immunochemistry images of the VM region of ACE2 Tg mice infected with SARS-CoV-2. (D) Quantification of Iba-1 in the SNpc region. n = 3, biological repeat, values are mean ± SEM, one-way ANOVA. (E) Representative western blot bands of GFAP and Iba-1 in the VM. (F) Quantification of GFAP and Iba-1 western blot bands in the VM. n = 3, biological repeat, values are mean ± SEM, one-way ANOVA. (G) Representative TH immunochemistry images of the VM region of ACE2 Tg mice infected with SARS-CoV-2. (H) Quantification of GFAP in the SNpc region. n = 3, biological repeat, values are mean ± SEM, one-way ANOVA. (I) Representative western blot bands of NP, TH, DAT, and α-Syn in VM after infection with SARS-CoV-2 for 7 and 60 days. (J) Quantification of (I). n = 3, biological repeat, values are mean ± SEM, one-way ANOVA. n.s., non-significance. See also Figures S5 and S6.
Figure 6
Figure 6
SARS-CoV-2 infection upregulates hPFF-induced Iba-1 and GFAP expression in the VM, and this effect persists even after 60 days (A) Representative Iba-1 IHC images of the VM SNpc and SNr regions. (B) Quantification of Iba-1 levels. n = 3, biological repeat, values are mean ± SEM, one-way ANOVA. (C) Representative western blot band of Iba-1 in the VM. (D) Quantification of Iba-1 expression levels from (C). n = 3, biological repeat, values are mean ± SEM, one-way ANOVA. (E‒G) qPCR analysis of the VM in hPFF-injected mice treated with vehicle or SARS-CoV-2 for Il1a, Tnf, and C1qa. n = 3, biological repeat, values are mean ± SEM, one-way ANOVA. (H) Representative GFAP immunochemistry images of the SNpc and SNr regions. (I) Quantification of GFAP levels. n = 3, biological repeat, values are mean ± SEM, one-way ANOVA. (J) Representative western blot band of GFAP in the VM. (K) Quantification of GFAP expression levels from (J). n = 3, biological repeat, values are mean ± SEM, one-way ANOVA. (L) qPCR analysis of the VM in hPFF-injected mice treated with vehicle or SARS-CoV-2 for A1-specific transcripts. n = 3, biological repeat, values are mean ± SEM, one-way ANOVA. n.s., non-significance. See also Figures S7–S10.

Similar articles

Cited by

References

    1. Krammer F. SARS-CoV-2 vaccines in development. Nature. 2020;586:516–527. doi: 10.1038/s41586-020-2798-3. - DOI - PubMed
    1. Benameur K., Agarwal A., Auld S.C., Butters M.P., Webster A.S., Ozturk T., Howell J.C., Bassit L.C., Velasquez A., Schinazi R.F., et al. Encephalopathy and Encephalitis Associated with Cerebrospinal Fluid Cytokine Alterations and Coronavirus Disease, Atlanta, Georgia, USA, 2020. Emerg. Infect. Dis. 2020;26:2016–2021. doi: 10.3201/eid2609.202122. - DOI - PMC - PubMed
    1. Zhang P.P., He Z.C., Yao X.H., Tang R., Ma J., Luo T., Zhu C., Li T.R., Liu X., Zhang D., et al. COVID-19-associated monocytic encephalitis (CAME): histological and proteomic evidence from autopsy. Signal Transduct. Target. Ther. 2023;8:24. doi: 10.1038/s41392-022-01291-6. - DOI - PMC - PubMed
    1. Sonneville R., Dangayach N.S., Newcombe V. Neurological complications of critically ill COVID-19 patients. Curr. Opin. Crit. Care. 2023;29:61–67. doi: 10.1097/MCC.0000000000001029. - DOI - PubMed
    1. Guilmot A., Maldonado Slootjes S., Sellimi A., Bronchain M., Hanseeuw B., Belkhir L., Yombi J.C., De Greef J., Pothen L., Yildiz H., et al. Immune-mediated neurological syndromes in SARS-CoV-2-infected patients. J. Neurol. 2021;268:751–757. doi: 10.1007/s00415-020-10108-x. - DOI - PMC - PubMed

MeSH terms

Substances