. 2024 Jun 6;187(12):3090-3107.e21.
doi: 10.1016/j.cell.2024.04.018. Epub 2024 May 14.

An age-progressive platelet differentiation path from hematopoietic stem cells causes exacerbated thrombosis

Affiliations

An age-progressive platelet differentiation path from hematopoietic stem cells causes exacerbated thrombosis

Donna M Poscablo et al. Cell. .

Abstract

Platelet dysregulation is drastically increased with advanced age and contributes to making cardiovascular disorders the leading cause of death of elderly humans. Here, we reveal a direct differentiation pathway from hematopoietic stem cells into platelets that is progressively propagated upon aging. Remarkably, the aging-enriched platelet path is decoupled from all other hematopoietic lineages, including erythropoiesis, and operates as an additional layer in parallel with canonical platelet production. This results in two molecularly and functionally distinct populations of megakaryocyte progenitors. The age-induced megakaryocyte progenitors have a profoundly enhanced capacity to engraft, expand, restore, and reconstitute platelets in situ and upon transplantation and produce an additional platelet population in old mice. The two pools of co-existing platelets cause age-related thrombocytosis and dramatically increased thrombosis in vivo. Strikingly, aging-enriched platelets are functionally hyper-reactive compared with the canonical platelet populations. These findings reveal stem cell-based aging as a mechanism for platelet dysregulation and age-induced thrombosis.

Keywords: aging; cardiovascular disorder; genetic lineage tracing; hematopoietic stem cells; megakaryocyte progenitor cells; platelet differentiation pathway; platelet dysregulation; thrombocytosis; thrombosis; transplantation.


Conflict of interest statement

Declaration of interests The authors declare no competing interests.

Figures

Figure 1.
Figure 1.. Aging of FlkSwitch mice leads to progressive enrichment of Tomato+ megakaryocyte progenitors and platelets
A. Schematic of the mTmG and Flk2-Cre constructs that serve as the basis for the color composition of hematopoietic cells in the FlkSwitch mouse model. Cre expression in Flk2+ cells leads to irreversible deletion of Tomato and a switch to GFP-expression in all descendent cells. B. Young FlkSwitch mice show very high, equal floxing of mature cells (3-month old, top), whereas Tom+ Plts, but not erythroid, GM, B or T cells, increase in aged mice (24-month old, bottom). C. The proportion of GFP+ Plts progressively decrease beyond 12 months of age, whereas the vast majority of erythroid, GM, B and T cells remain GFP+ for life. Quantification of data from B and additional intervening time points are shown. Data represent mean ± SEM of 6 independent experiments, n=21 mice. Statistics: unpaired t-test compared to baseline 3 months old. ***P<0.0005 D. HSCs remain Tom+ for life. Tom versus GFP expression in young and old HSCs. E. MkPs are GFP+ in young mice and Tom+ MkPs are enriched in old mice. Tom versus GFP expression in young and old MkPs. F. All progenitors except MkPs maintain efficient switching to GFP-expression throughout life. Fold difference in percent GFP+ classical myeloid, erythromyeloid, and lymphoid progenitor cells compared to MPPs in the BM of young and old FlkSwitch mice. G. Multipotent progenitor subfractions in young (Y) and old (O) FlkSwitch mice remain GFP+ during aging. Percent GFP labeling of MPP2, MPP3, MPP4, and ST-HSC, gated as in Figure S2. Data represent mean ± SEM of 3 independent experiments, n=5 young mice, n=5 old mice. Statistics: t-test. Comparisons of young to old were not statistically different. H. Percent GFP+ cells in hematopoietic populations from ten individual Old FlkSwitch mice. I. Aging-induced shortcut megakaryopoiesis. Schematic of youthful differentiation pathways in FlkSwitch mice (left) and altered megakaryopoiesis in old FlkSwitch mice (right). In young adult and old FlkSwitch mice, HSCs express Tom. Only aging mice have Tom+ MkPs and Plts; cells of all other hematopoietic lineages remain GFP+ throughout life.
Figure 2.
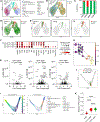
Figure 2.. Bulk RNA sequencing revealed a distinct molecular profile of Tom+ MkPs
A. Volcano plots showing DEGs between MkPs. Dotted lines indicate P=0.05. B. GO term analysis of DEGs in Tom+ MkPs compared to GFP+ MkPs. C. Tom+ oMkPs highly express genes associated with HSC function. mRNA levels of specific DEGs by RNAseq read count in Tom+ oMkPs compared to GFP+ oMkPs. **P<0.005, ***P<0.0001. D. Differential cell-surface expression of CD105 and CD119 by old MkPs. Flow cytometry analysis to test RNAseq results. Data represent 3 independent experiments with n=4 young, n=4 old mice. Statistics: paired t-test. *P<0.05. E. Tom+ oMkPs are located closest to oHSCs in transcriptional space. Principal Components 1 and 2 capture 93.6% of the total transcriptional variance across MkPs and HSCs, demonstrating that Tom+ oMkPs are most similar to oHSCs in PC1 and according to Euclidean distance calculated from centroids (diamonds). F. Kmeans-clustered heatmap of gene expression Z-score for DEGs between Tom+ oMkPs (up) and GFP MkPs (down) demonstrates shared transcriptional signal in oHSCs and Tom+ oMkPs that is diminished or absent in other MkP populations.
Figure 3.
Figure 3.. Single-cell transcriptomics provided independent evidence of the aging-induced, distinct cluster of Tom+ MkPs
A. UMAP representation of scRNAseq data from combined cKit+CD150+/− cells from young and old FlkSwitch mice. B. UMAP occupancy of young and old cells in the scRNAseq data. Circled area represents a population of cells enriched in old mice. C. Old MkPs, but not young MkPs or young or old GMPs, express Tomato. Quantification of the number of GFP+ and Tom+ MkPs and GMPs by scRNAseq data demonstrating strong concordance with Tom/GFP profiles by flow cytometry. D. GFP and Tom-expression in the scRNAseq data demonstrating that the population of cells only present in old BM is Tom+ (red), whereas all other cells in both young and old FlkSwitch mice express GFP (green). E. GFP and Tom-expression among annotated MkPs in the scRNAseq data. Only old MkPs possess Tom-expressing cells. F. Dot plot of selected genes among young and old MkP populations. MkP lineage genes (left) and the top 10 DEGs (right, top five upregulated and top five downregulated) between MkPs. Data is scaled by gene. G. Volcano plots showing DEGs between MkPs based on pseudobulk analysis of scRNAseq. Dotted lines indicate where P=0.05. H-J. Two “classical” trajectory inference models, DPT and PAGA, are unable to transcriptomically identify the aging-induced branchpoint. H. PAGA analysis. Tom+ MkPs are shown as a probable link from HSCs. I. DPT analysis. DPT values (left) and cell cluster annotation (right). J. Investigation of GFP+ and Tom+ MkPs via DPT further indicates no apparent transcriptome-based branch point. K. DPT analysis of scRNAseq data revealed that Tom+ oMkPs are generated faster than GFP+ MkPs from HSCs. HSCs and MkPs are displayed as subsets of all annotated clusters. The median for each group is indicated by the line within the box plot. HSC n=189 cells, Tom+ MkP n=402 cells, and GFP+ MkP n=832 cells. Statistical analysis was conducted with a one-way ANOVA adjusted for multiple comparisons (Tukey). ****P<0.0001
Figure 4.
Figure 4.. Age-enriched MkPs have greater expansion, clonal, and platelet reconstitution potential upon transplantation compared to GFP+ Young or Old MkPs.
A. Schematic of in vitro expansion assay of MkPs from FlkSwitch mice. 1000 MkPs were plated per well and quantified by flow cytometry after 3 days of expansion. B. Tom+ oMkPs displayed greater expansion capacity in vitro compared to both GFP+ yMkPs and GFP+ oMkPs. Left: Representative images of MkP in vitro cultures at day 3. Right: Quantification revealed significantly greater number of cells from Tom+ MkPs compared to both GFP+ MkPs. Data represent mean ± SEM of 3 independent experiments, n=9 GFP+ yMkP wells, n=9 GFP+ oMkP wells and n=17 Tom+ oMkP wells. Statistics: one-way ANOVA,Tukey’s multiple comparisons test. ****P<0.001 C. Gating strategy and summary of immunophenotypic analysis of cultured MkPs from B. Tom+ oMkP cultures contain significantly more phenotypic MkPs compared to the two GFP+ MkPs. D. Schematic of MkP CFU-S analysis. 2,000 MkPs from FlkSwitch mice were transplanted into lethally irradiated mice and spleens were analyzed for CFU-S at day 8.5. E-F. Tom+ MkPs harbors greater clonal potential compared to GFP+ MkPs. Representative fluorescence microscopy images (E) and enumeration (F) of colony number per spleen positive for colonies. Data represent mean and SEM from 3 independent experiments. GFP+ yMkP n=4; GFP+ oMkP n=5; Tom+ oMkP n=8. Statistics: one-way ANOVA, Tukey’s multiple comparisons test. *P<0.05. G. Summary of CFU-S experiments. All transplanted mice: GFP+ yMkP n=7; GFP+ oMkP n=6; Tom+ oMkP n=10. H. Schematic of MkP transplantation from FlkSwitch mice. 22,000 MkPs were isolated by FACS and transplanted into young WT recipient mice. PB analysis by flow cytometry was done to monitor repopulation of mature cells. I. Tom+ oMkPs demonstrated greater contribution to Plts compared to both GFP+ yMkPs and GFP+ oMkPs. Donor-derived Plts in PB of recipients presented as percent donor-chimerism. Data represent mean ± SEM of 3 independent experiments, n=6 GFP+ yMkP recipients, n=4 GFP+ oMkP recipients, and n=13 Tom+ oMkP recipients. Statistics: unpaired two-tailed t-test. T-tests between GFP+ yMkP and GFP+ oMkP were not statistically significant. T-tests between GFP+ oMkP and Tom+ oMkP *P<0.05, **P<0.005, ***P<0.0005.
Figure 5.
Figure 5.. Age-enriched MkPs serve as first responders to acute platelet depletion
A. Schematic of anti-GPIbα-mediated Plt depletion and subsequent time-course analysis of cellular response. BM analysis was performed 24 hours post-depletion. B. A single injection of anti-GPIbα antibodies led to rapid and robust Plt depletion followed by gradual restoration of circulating Plt numbers. Plt numbers/microliter PB are indicated at each time point. Grey inset shows Plt numbers with a different y-axis scale during the period of lowest Plt numbers. C-D. Analysis of Tom:GFP Plts demonstrated reduction in floxing in young (C) and old (D) mice during Plt restoration. Data in C-D represent mean ± SEM of 4 independent experiments with n=6 young mice, n=4 old mice. Statistics: unpaired t-test. *P<0.05, **P<0.005, ***P<0.0005, ****P<0.00005. E-F. Quantification of BM cellularity 24 hours post-depletion revealed a significant decrease in frequencies of yMkPs, while yHSCs and yMPPs were unaltered (E). A similar pattern was observed in old mice, albeit an insignificant trend in oMkP cellularity upon Plt-depletion (F). G. Floxing of MkPs were unaltered 24 hours post-depletion compared to control mice. H. pMegE numbers and floxing were unaltered in the BM 24 hours post-depletion compared to control mice. I. Schematic of EdU-incorporation analysis. Proliferation rates in control and Plt-depleted mice were pulsed for 24 hours with EdU, with or without simultaneous administration of anti-GPIbα antibodies. J-K. Plt depletion selectively induced MkP proliferation. Short-term in vivo EdU incorporation revealed that HSCs and MkPs, but not MPPs, in young and old mice respond to Plt depletion, with Tom+ oMkPs dominating the response in old mice (K). Data represent mean ± SEM of 4 independent experiments with n=4 young mice, n=4 old mice. Statistics: paired t-test. *P<0.05, ***P<0.0005.
Figure 6.
Figure 6.. The age-induced shortcut platelet pathway contributes to platelet hyper-reactivity in old FlkSwitch mice
A. Aging leads to thrombocytosis due to accumulation of Tom+ Plts. Absolute quantification of circulating cells presented as total cells/microliter of PB. While changes to the absolute number of other mature cells in the PB result from cells derived via GFP+ differentiation pathways, the numerical increase in Plts is a consequence of the Tom+ differentiation path in aged FlkSwitch mice. Statistics: unpaired t-test. *P<0.05, **P<0.005, ***P<0.0005. T-tests between Tom+ yPlts and Tom+ oPlts: ***P<0.0005. T-tests between all other Tom+ young and old cells were insignificant. B. Tom+ oPlts express traditional Plt markers. Frequency of Plts expressing known Plt surface markers: CD41, CD9, CD42a, CD42b. C. Schematic of experimental design for measuring Plt lifespan. Using flow cytometry, the lifespan of GFP+ and Tom+ Plts was monitored by tracking the disappearance of in vivo CD42c-DyLight649 labeling over time. D. The lifespan of Tom+ and GFP+ Plts in old FlkSwitch are equivalent. Top: Representative histograms of Plt-labeling and B220+ labeled B-cell controls (grey=unlabeled). Bottom: Summary of Plt lifespan kinetics. Data represent 2 independent experiments with n=4 young WT for B cell analysis and n=8 old FlkSwitch mice for Plt analysis. Statistics: one-way ANOVA, Tukey’s multiple comparisons test. **P<0.001, **** P<0.0001 E. Schematic of the laser-induced thrombosis model to monitor thrombus formation upon vascular injury. F. Tom+ oPlts contribute to excessive thrombus formation in old mice. Representative images of clot formation in young (top) and old (bottom) FlkSwitch mice displaying participation of GFP+ and Tom+ Plt in thrombi. Also see Supplemental Movies. G. Tom+ and GFP+ cells are major contributors to greater thrombus formation in old FlkSwitch mice, while the smaller thrombi in young FlkSwitch mice consist exclusively of GFP+ cells. Dynamics of clot formation at time points post-vascular injury were quantified by MFI of thrombi, comparing GFP+ (left) or Tom+ (right) accumulation. Data represent mean ± SEM of 3 independent experiments with n=3 young, and n=3 old mice, with 9–12 injuries per mouse. Statistics: unpaired t-test of area under the curve. *P<0.01, ****P<0.0001, H. Fibrin content increased in thrombi in old mice. Dynamics of fibrin formation in thrombi at time points post-vascular injury were analyzed by change in MFI conferred by A647-conjugated anti-fibrin antibodies. Representative images of fibrin formation (left) and quantification of fibrin MFI within thrombi (right) in FlkSwitch mice. Data represent 3 independent experiments with n=3 young, and n=3 old mice. Statistics: unpaired t-test of area under the curve. ****P<0.0001 I. Platelet-leukocyte aggregate formation is greater in old compared to young blood. Quantification of myeloid cell aggregation with Plts (Gr1+CD41+, left) and B-cell aggregation with Plts (B220+CD41+, right) with and without thrombin-mediated activation (0.1 U/mL). + indicate thrombin-stimulated. Data represent 3 independent experiments with n=7 Y mice, n=8 Y+, mice n=22 O mice, n=8 O+ mice. Statistics: one-way ANOVA, Tukey’s multiple comparisons test. *P<0.05, ***P<0.0005, ****P<0.0005 J-K. oPlts demonstrated higher activation of integrin αIIb/β3 (left) and P-selectin (right) surface display upon stimulation by ADP (10 μM) (J) and thrombin (0.1 U/mL) (K). Quantification of Plt frequency and MFI within CD9+ Plts. Data represent 3 independent experiments with n=5 young mice, n=5 old mice. Statistics: unpaired t-test. *P<0.05, **P<0.005, ***P<0.0005. Quantification of P-selectin+ Plt frequency (left) and P-selectin MFI (right) within CD9+ Plts. Data represent 3 independent experiments with n=7 young mice, n=7 old mice. Statistics: unpaired t-test. *P<0.05, ***P<0.0005, ****P<0.0005 Y, young; O, old
Figure 7.
Figure 7.. Age-enriched platelets are functionally hyper-reactive compared to GFP+ old platelets
A. Tom+ oPlts undergo more rapid P-selectin neo-exposure compared to GFP+ oPlts and yPlts in response to 0.2 U/mL thrombin. Real time flow cytometry analysis of P-selectin exposure upon activation ex vivo. Representative flow plot and corresponding quantification of MFI rate and kinetics. (A-C) Underlaying faded lines represent sample controls without thrombin stimulation. Data represent 4 independent experiments with n=4 young WT, and n=10 old FlkSwitch mice. Statistics: one-way ANOVA, Tukey’s multiple comparisons test. **P<0.001, **** P<0.0001 B. Tom+ oPlts undergo more rapid ESAM neo-exposure compared to GFP+ oPlts and yPlts in response to 0.2 U/mL thrombin. Real time flow cytometry analysis of ESAM exposure upon activation ex vivo. Representative flow plot and corresponding quantification of MFI rate and kinetics. Data represent 3 independent experiments with n=3 young WT, and n=8 old FlkSwitch mice. Statistics: one-way ANOVA, Tukey’s multiple comparisons test. *P<0.05, ** P<0.001 C. Degranulation of Tom+ oPlts, GFP+ oPlts, and yPlts during activation is equivalent. Real time flow cytometry analysis of side scatter measurements of Plts upon stimulation. Representative flow plot and corresponding quantification of MFI rate and kinetics. Data represent 4 independent experiments with n=4 young WT, and n=10 old FlkSwitch mice. Statistics: one-way ANOVA, Tukey’s multiple comparisons test. D. Representative images of adherent and spreading Plts on immobilized fibrinogen at 5, 15, 30, and 45 minutes after 0.2 U/mL thrombin stimulation. E. Tom+ and GFP+ oPlts undergo four distinct phases of Plt spreading. Representative images of (I) adhesion, (II) filopodia, (III) filopodia and lamellipodia and (IV) only lamellipodia. F. Tom+ oPlts more efficiently undergo shape change to achieve full spreading upon stimulation compared to GFP+ oPlts. Distribution of GFP+ and Tom+ oPlt phases of spreading in 5, 15, 30, and 45 minutes after thrombin stimulation. Data represent a summary of multiple images at each time point: 5 min=7 images/mouse, 15 min=7 images/mouse, 30 min=5 images/mouse, 45 min=5 images/mouse. Statistics: two-Way ANOVA, Sidak’s multiple comparisons test *P≤0.05, **P<0.001, ***P<0.0001 G. Tom+ and GFP+ oPlts generate equivalent numbers of filopodia structures. Enumeration of filopodia/Plt at phase II of spreading. Each data point represents one platelet. H. Tom+ oPlts exhibit greater spreading capacity compared to GFP+ oPlts. Enumeration of average spreading area per Plt at 5, 15, 30, and 45 minutes after thrombin stimulation. Data represent 4 independent experiments with n=5 old FlkSwitch mice. Each data point is average of multiple images at each time point: 5 min=7 images/mouse, 15 min=7 images/mouse, 30 min=5 images/mouse, 45 min=5 images/mouse. Statistics: two-way ANOVA, Sidak’s multiple comparisons test *P≤0.05, **P<0.001.

Comment in

References

    1. Kim S-H, Im J-A, Lee J-W, and Lee D-C (2006). Age Related Increase of Platelet Activation. Biomedical Science Letters 12, 337–341.
    1. Dayal S, Wilson KM, Motto DG, Miller FJ, Chauhan AK, and Lentz SR (2013). Hydrogen peroxide promotes aging-related platelet hyperactivation and thrombosis. Circulation 127, 1308–1316. 10.1161/CIRCULATIONAHA.112.000966. - DOI - PMC - PubMed
    1. Gleerup G, and Winther K (1995). The Effect of Ageing on Platelet Function and Fibrinolytic Activity. Angiology 46, 715–718. 10.1177/000331979504600810. - DOI - PubMed
    1. Virani SS, Alonso A, Benjamin EJ, Bittencourt MS, Callaway CW, Carson AP, Chamberlain AM, Chang AR, Cheng S, Delling FN, et al. (2020). Heart disease and stroke statistics—2020 update: A report from the American Heart Association. Circulation 141, E139–E596. 10.1161/CIR.0000000000000757. - DOI - PubMed
    1. Moulis G, Palmaro A, Montastruc JL, Godeau B, Lapeyre-Mestre M, and Sailler L (2014). Epidemiology of incident immune thrombocytopenia: a nationwide population-based study in France. Blood 124, 3308–3315. 10.1182/BLOOD-2014-05-578336. - DOI - PubMed