. 2024 Jun 3;34(11):2418-2433.e4.
doi: 10.1016/j.cub.2024.04.043. Epub 2024 May 14.

Ultrastructural differences impact cilia shape and external exposure across cell classes in the visual cortex

Affiliations

Ultrastructural differences impact cilia shape and external exposure across cell classes in the visual cortex

Carolyn M Ott et al. Curr Biol. .

Abstract

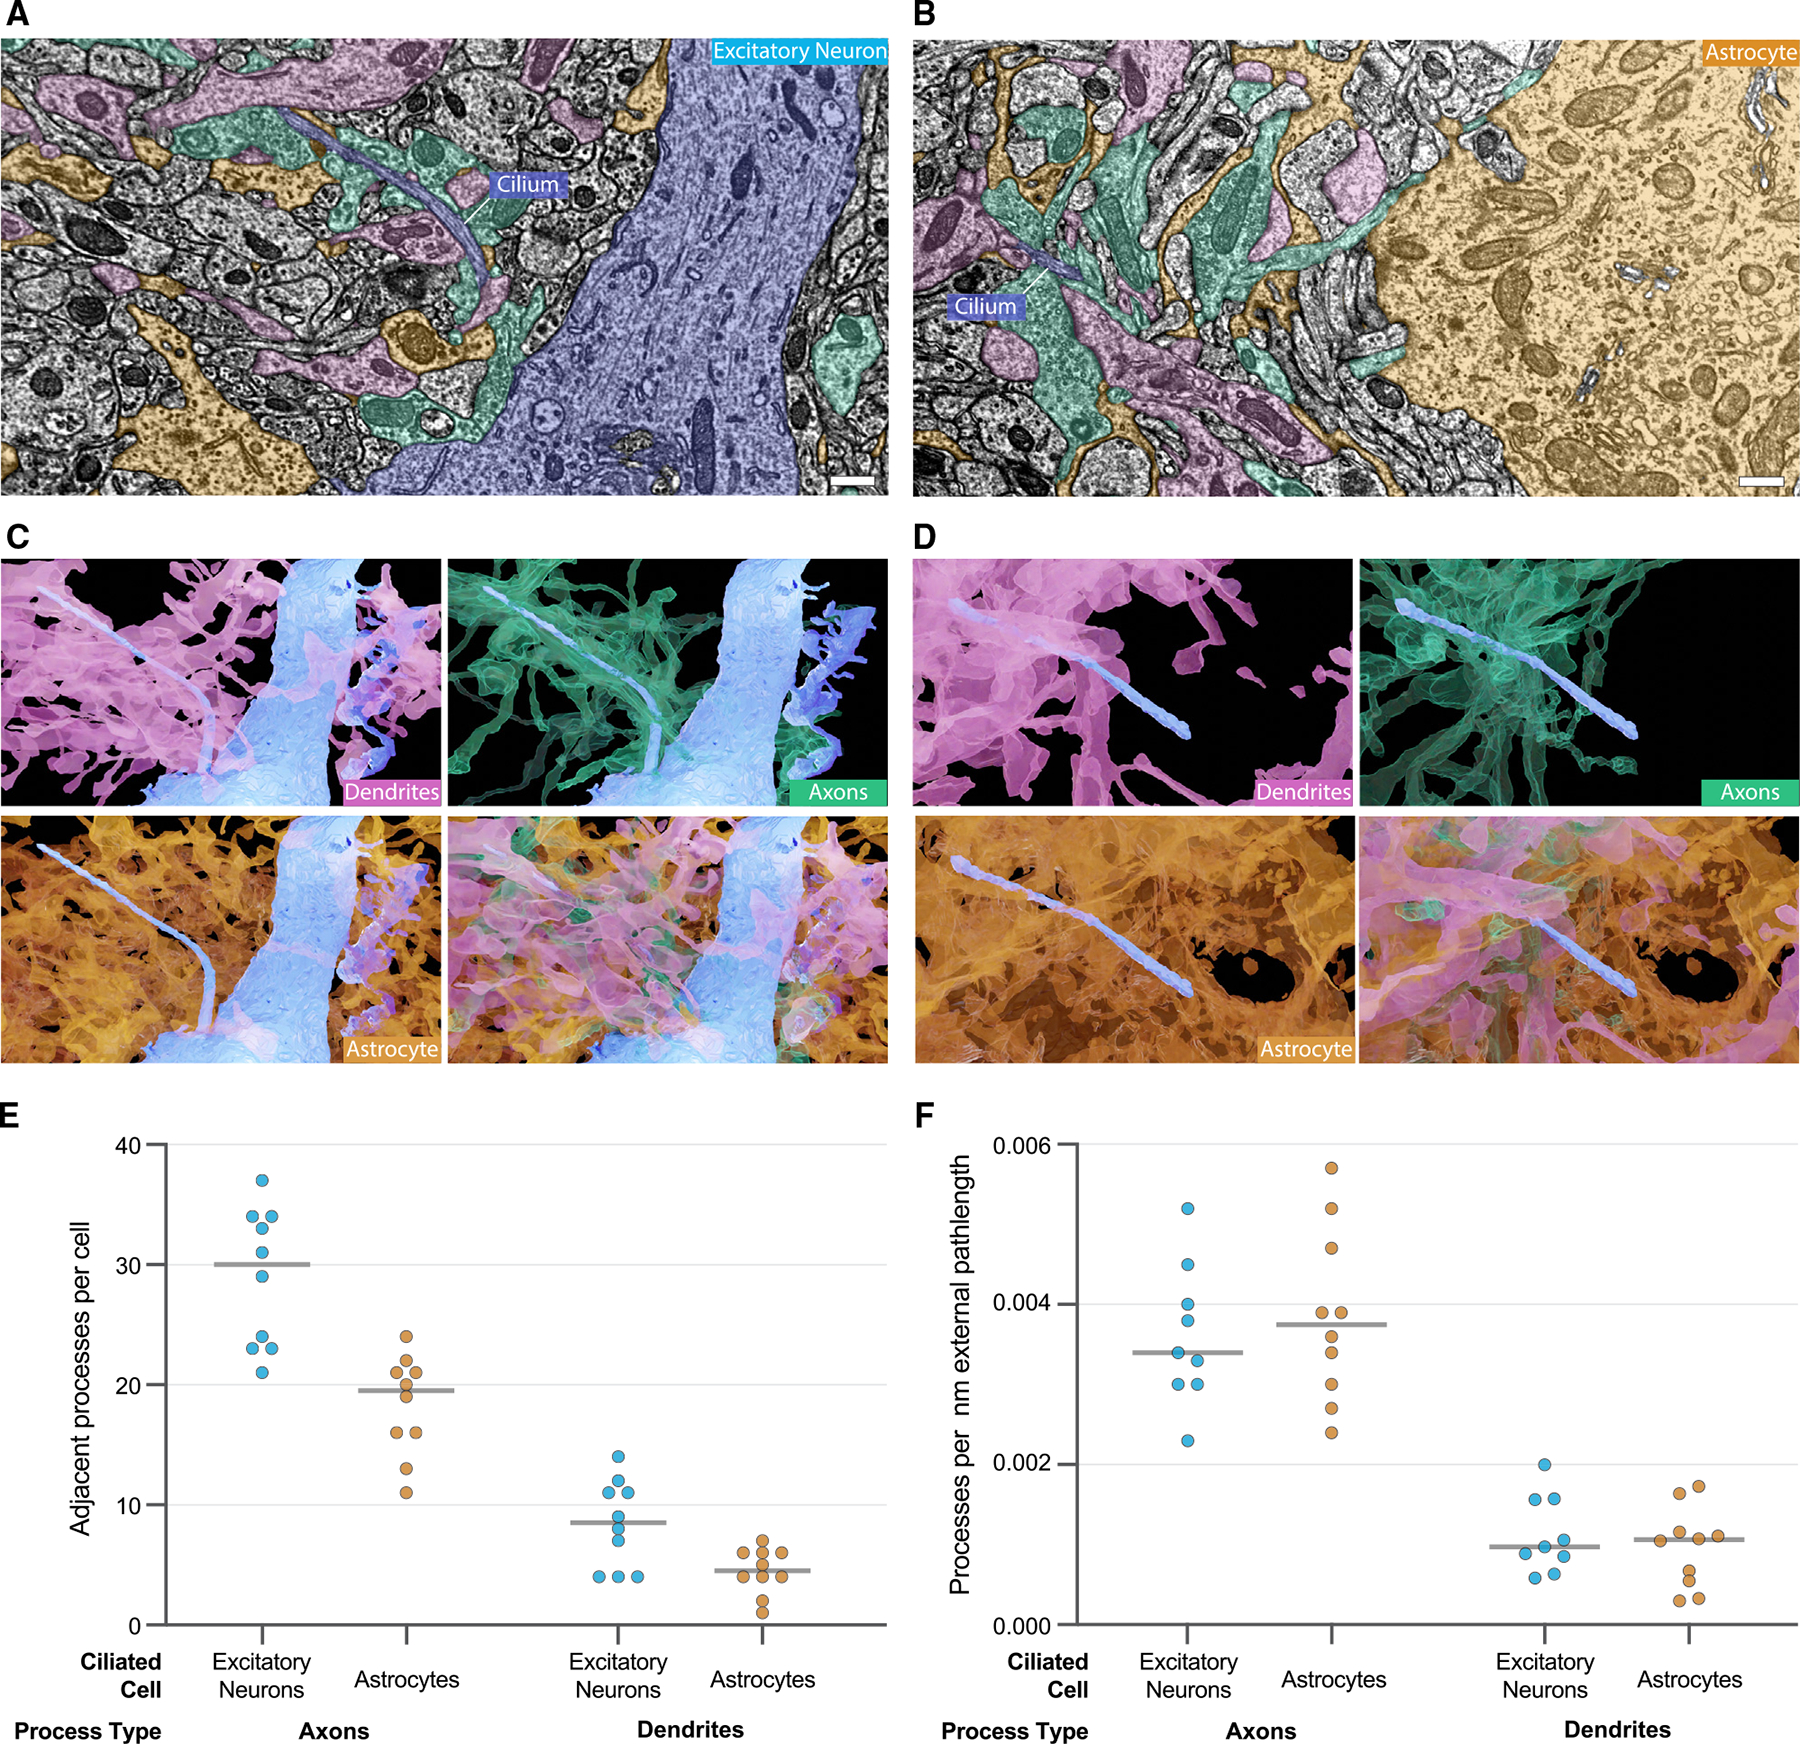
A primary cilium is a membrane-bound extension from the cell surface that contains receptors for perceiving and transmitting signals that modulate cell state and activity. Primary cilia in the brain are less accessible than cilia on cultured cells or epithelial tissues because in the brain they protrude into a deep, dense network of glial and neuronal processes. Here, we investigated cilia frequency, internal structure, shape, and position in large, high-resolution transmission electron microscopy volumes of mouse primary visual cortex. Cilia extended from the cell bodies of nearly all excitatory and inhibitory neurons, astrocytes, and oligodendrocyte precursor cells (OPCs) but were absent from oligodendrocytes and microglia. Ultrastructural comparisons revealed that the base of the cilium and the microtubule organization differed between neurons and glia. Investigating cilia-proximal features revealed that many cilia were directly adjacent to synapses, suggesting that cilia are poised to encounter locally released signaling molecules. Our analysis indicated that synapse proximity is likely due to random encounters in the neuropil, with no evidence that cilia modulate synapse activity as would be expected in tetrapartite synapses. The observed cell class differences in proximity to synapses were largely due to differences in external cilia length. Many key structural features that differed between neuronal and glial cilia influenced both cilium placement and shape and, thus, exposure to processes and synapses outside the cilium. Together, the ultrastructure both within and around neuronal and glial cilia suggest differences in cilia formation and function across cell types in the brain.

Keywords: astrocyte; axoneme; centrosome; cilia; ciliary pocket; electron microscopy; neuronal cilia; oligodendrocyte precursor cell; transition zone.


Conflict of interest statement

Declaration of interests The authors have no competing financial interests to declare.

Figures

Figure 1.
Figure 1.. Neurons, astrocytes, and OPCs have primary cilia
(A) Cell class exemplars annotated in this study. (B) Electron micrographs of basal bodies/centrosomes from cells in (A). Scale bars, 1 μm. (C) Fraction of ciliated cells by class. (D) Cilia on cells in (A). Astrocyte and OPC were cut away to reveal the cilium. (E) Cilium length graphed as a distribution (left) and individual values (right). See also Figure S1 and Video S1.
Figure 2.
Figure 2.. Neurons have surface cilia and most glial cilia have a ciliary pocket
(A and B) Surface and pocket cilia illustrations and segmented representations of an excitatory neuron (A) and an astrocyte (B) cilium. Scale bars, 200 nm. (C) The fraction of cells with ciliary pockets. (D) Distribution of path lengths, external and in total. (E–G) Segmented OPC cilium (E), concealed cilium (F), or ciliary vesicle (G). Enlarged regions of interest (ROIs) illustrate that the cilium barely emerges (E) or is completely concealed (F). Scale bars, 200 nm; ROI width: 1,085 nm. (H) OPC classifications are plotted by dataset. (I) Vesicles inside OPC cilia. Scale bar, 200 nm. (J) The percentage of cilia with internal cilia vesicles was graphed for each cell class in each dataset. In (A) and (B) and (E)–(G), cilium, cyan; cell interior, pink; overlaid onto a single EM plane. See also Figure S2.
Figure 3.
Figure 3.. Astrocytic cilia TZs are shorter than neuronal cilia TZs
(A) To improve resolution, cilia from P>270 were located on the original EM grids and reimaged at higher resolutions (left, original; right, reimaged; yellow arrowhead, an IFT particle). Scale bars, 100 nm. (B) Serial images of the base of an excitatory neuronal cilium and an astrocytic cilium (yellow bracket, TZ visible in alternating slices; yellow box, ROI in (A). Scale bars, 100 nm. (C) The Y-links (yellow arcs) of the TZ are resolved in high-resolution images of excitatory neuronal and astrocytic cilia cross-sections. Scale bars, 100 nm. (D) The distribution of mean TZ lengths measured in sequential images of lengthwise-sectioned cilia in P>270 is plotted (weighted mean, solid white line; dashed lines, standard deviation of the weighted mean). See also Figure S3.
Figure 4.
Figure 4.. Astrocytic and neuronal cilia microtubule organization differs
(A) Microtubule transitions: microtubules emerge as doublets with A- and B-tubules. Density within the A-tubule ends leaving translucent lumens in both tubules. Some microtubules transition to singlets. Both doublet and singlet microtubules terminated. (B and C) Cross-sections of an excitatory neuron (B) and an astrocytic cilium base (C). Yellow arrowheads track the position of the same microtubule through the volume. Orange arrowheads indicate densities between deviant microtubules and adjacent doublets. Scale bars, 100 nm. (D) The diameter along the central path length of the proximal cilium was measured in P54 (solid lines: average diameter of a binned path length; shading: 95% CI of that bin). (E) Cross-sections near tips of cilia display the diversity of microtubule configurations. Scale bars, 100 nm. (F) Serial cross-sections of an excitatory neuron distal cilium re-imaged at higher resolution. Images were inverted in the lower panel (yellow: bridging electron densities; cyan: microtubules). Scale bars, 100 nm. See also Figure S4 and Videos S2 and S3.
Figure 5.
Figure 5.. Cilia immersed in the neuropil
(A and B) Cilia on an excitatory neuron (A) or astrocyte (B) in P36 are shown in blue. Every process in the neuropil that passes adjacent to any portion of the cilium was colored by the processes’ type (dendrites: pink; axons: teal; astrocyte: orange). Scale bars, 500 nm. (C and D) 3D renderings of dendrites, axons, and astrocytic processes adjacent to each cilium from (A) and (B). (E) Adjacent processes’ identities were determined for 10 excitatory neurons and 10 astrocytes in P36 and the totals graphed. (F) Process total from each cell was divided by its external cilium path length and graphed by cell class. See also Figure S5 and Videos S3 and S4.
Figure 6.
Figure 6.. Cilium length and synapse abundance determined frequency of synapses near cilia
(A) Representative volumetric rendering of synapses near an inhibitory neuronal cilium (cilium, green; synaptic clefts, bright pink). Insets: EM images of an adjacent synapses (upper) and a proximal synapse (lower). Scale bars, 300 nm. (B) Euclidean distance to the synapse closest to each cilium in P54 (left y axis: bar graph; bar width represents binning distances; right y axis: line shows cumulative fraction of cells that have a synapse within that distance; red line, half of cilia have a nearby synapse). (C) The mean number of synapses adjacent to either cilia or axon fragments of equal length are graphed for both inhibitory and excitatory neurons. (D) The fraction of cilia or axon fragments with adjacent synapses from (C) is graphed. Error bars in (C) and (D) represent 95% CI. (E and F) The number of adjacent (E) or proximal (F) synapses divided by cilium/axon path length graphed using a box-and-whisker plot where the 95% CI is represented by the magnitude of the box indentation at the mean value. For (C)–(F), n = 89 excitatory cilia or excitatory axon fragments and 46 inhibitory cilia or axon fragments. (G) The number of synapses within 1 μm of each P54 cilium graphed relative to external cilium length (solid line: linear regression fit across the dataset with β = 4.08, R2 = 0.668; shading: 95% CI). Dashed line is the linear regression fit of the mean number of synapses adjacent to cilia randomly placed in 1,000 positions/ orientations (β = 3.59 R2 = 0.996, utilized external portion of cilia path). Top histogram: class distributions of cilia lengths. Right histograms: class distributions of the measured or calculated (random) synapses within 1 μm. OPCs, pink; astrocytes, orange; excitatory neurons, blue; inhibitory neurons, green. See also Figure S6.
Figure 7.
Figure 7.. Cilium shape, placement, and orientation can be stereotyped within a cell class
(A) Gross tortuosity plotted relative to cilium length. (B) Average cilium diameter in P54 (left y axis, solid line) and local curvature (right y axis, dashed line) along the cilium length. Shading indicates the 95% CI. (C) The centrosome vector originates at the center of the nucleus and extends to the mother centriole. The cilium vector extends from the base of the cilium to the tip. The azimuth is represented by the angle 4 and the elevation by the angle q. The spherical coordinate system is defined by a zenith representing an axis from white matter to pia. (D) Polar plots show the distribution of centrosome and cilia vectors for each cell in each class in P54 (solid black line: the circular mean; dashed lines: the circular standard deviation around the mean). (E) Centrosome and cilium vectors of excitatory neurons in each layer. See also Figure S7.

Update of

References

    1. Allen RA (1965). Isolated cilia in inner retinal neurons and in retinal pigment epithelium. J. Ultrastruct. Res 12, 730–747. 10.1016/s0022-5320(65)80058-2. - DOI - PubMed
    1. Barnes BG (1961). Ciliated secretory cells in the pars distalis of the mouse hypophysis. J. Ultrastruct. Res 5, 453–467. 10.1016/s0022-5320(61)80019-1. - DOI - PubMed
    1. Higginbotham H, Eom T-Y, Mariani LE, Bachleda A, Hirt J, Gukassyan V, Cusack CL, Lai C, Caspary T, and Anton ES (2012). Arl13b in Primary Cilia Regulates the Migration and Placement of Interneurons in the Developing Cerebral Cortex. Dev. Cell 23, 925–938. 10.1016/j.devcel.2012.09.019. - DOI - PMC - PubMed
    1. Higginbotham H, Guo J, Yokota Y, Umberger NL, Su C-Y, Li J, Verma N, Hirt J, Ghukasyan V, Caspary T, and Anton ES (2013). Arl13b-regulated cilia activities are essential for polarized radial glial scaf-fold formation. Nat. Neurosci 16, 1000–1007. 10.1038/nn.3451. - DOI - PMC - PubMed
    1. Koemeter-Cox AI, Sherwood TW, Green JA, Steiner RA, Berbari NF, Yoder BK, Kauffman AS, Monsma PC, Brown A, Askwith CC, and Mykytyn K (2014). Primary cilia enhance kisspeptin receptor signaling on gonadotropin-releasing hormone neurons. Proc. Natl. Acad. Sci. USA 111, 10335–10340. 10.1073/pnas.1403286111. - DOI - PMC - PubMed

Publication types

LinkOut - more resources