ChIP-Atlas 3.0: a data-mining suite to explore chromosome architecture together with large-scale regulome data
- PMID: 38749504
- PMCID: PMC11223792
- DOI: 10.1093/nar/gkae358
ChIP-Atlas 3.0: a data-mining suite to explore chromosome architecture together with large-scale regulome data
Abstract
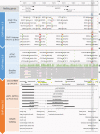
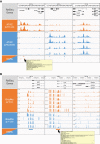
ChIP-Atlas (https://chip-atlas.org/) presents a suite of data-mining tools for analyzing epigenomic landscapes, powered by the comprehensive integration of over 376 000 public ChIP-seq, ATAC-seq, DNase-seq and Bisulfite-seq experiments from six representative model organisms. To unravel the intricacies of chromatin architecture that mediates the regulome-initiated generation of transcriptional and phenotypic diversity within cells, we report ChIP-Atlas 3.0 that enhances clarity by incorporating additional tracks for genomic and epigenomic features within a newly consolidated 'annotation track' section. The tracks include chromosomal conformation (Hi-C and eQTL datasets), transcriptional regulatory elements (ChromHMM and FANTOM5 enhancers), and genomic variants associated with diseases and phenotypes (GWAS SNPs and ClinVar variants). These annotation tracks are easily accessible alongside other experimental tracks, facilitating better elucidation of chromatin architecture underlying the diversification of transcriptional and phenotypic traits. Furthermore, 'Diff Analysis,' a new online tool, compares the query epigenome data to identify differentially bound, accessible, and methylated regions using ChIP-seq, ATAC-seq and DNase-seq, and Bisulfite-seq datasets, respectively. The integration of annotation tracks and the Diff Analysis tool, coupled with continuous data expansion, renders ChIP-Atlas 3.0 a robust resource for mining the landscape of transcriptional regulatory mechanisms, thereby offering valuable perspectives, particularly for genetic disease research and drug discovery.
© The Author(s) 2024. Published by Oxford University Press on behalf of Nucleic Acids Research.
Figures


Similar articles
-
ChIP-Atlas 2021 update: a data-mining suite for exploring epigenomic landscapes by fully integrating ChIP-seq, ATAC-seq and Bisulfite-seq data.Nucleic Acids Res. 2022 Jul 5;50(W1):W175-W182. doi: 10.1093/nar/gkac199. Nucleic Acids Res. 2022. PMID: 35325188 Free PMC article.
-
ChIP-Atlas: a data-mining suite powered by full integration of public ChIP-seq data.EMBO Rep. 2018 Dec;19(12):e46255. doi: 10.15252/embr.201846255. Epub 2018 Nov 9. EMBO Rep. 2018. PMID: 30413482 Free PMC article.
-
Profiling the Epigenetic Landscape of the Spermatogonial Stem Cell: Part 2-Computational Analysis of Epigenomics Data.Methods Mol Biol. 2023;2656:109-125. doi: 10.1007/978-1-0716-3139-3_6. Methods Mol Biol. 2023. PMID: 37249868
-
Methods for ChIP-seq analysis: A practical workflow and advanced applications.Methods. 2021 Mar;187:44-53. doi: 10.1016/j.ymeth.2020.03.005. Epub 2020 Mar 30. Methods. 2021. PMID: 32240773 Review.
-
Review and Evaluate the Bioinformatics Analysis Strategies of ATAC-seq and CUT&Tag Data.Genomics Proteomics Bioinformatics. 2024 Sep 13;22(3):qzae054. doi: 10.1093/gpbjnl/qzae054. Genomics Proteomics Bioinformatics. 2024. PMID: 39255248 Free PMC article. Review.
Cited by
-
Generic and queryable data integration schema for transcriptomics and epigenomics studies.Comput Struct Biotechnol J. 2024 Nov 19;23:4232-4241. doi: 10.1016/j.csbj.2024.11.022. eCollection 2024 Dec. Comput Struct Biotechnol J. 2024. PMID: 39660218 Free PMC article.
-
Temporal Transcriptomic Analysis of Periodontal Disease Progression and Its Molecular Links to Systemic Diseases.Int J Mol Sci. 2025 Feb 25;26(5):1998. doi: 10.3390/ijms26051998. Int J Mol Sci. 2025. PMID: 40076622 Free PMC article.
-
O-GlcNAcylation on serine 40 of histone H2A promotes proliferation and invasion in triple-negative breast cancer.Sci Rep. 2025 Mar 24;15(1):10170. doi: 10.1038/s41598-025-95394-z. Sci Rep. 2025. PMID: 40128346 Free PMC article.
-
The WWP1-JARID1B axis sustains acute myeloid leukemia chemoresistance.Proc Natl Acad Sci U S A. 2025 Jul 15;122(28):e2421159122. doi: 10.1073/pnas.2421159122. Epub 2025 Jul 8. Proc Natl Acad Sci U S A. 2025. PMID: 40627385 Free PMC article.
-
Update of the FANTOM web resource: enhancement for studying noncoding genomes.Nucleic Acids Res. 2025 Jan 6;53(D1):D419-D424. doi: 10.1093/nar/gkae1047. Nucleic Acids Res. 2025. PMID: 39592010 Free PMC article.
References
MeSH terms
Substances
Grants and funding
LinkOut - more resources
Full Text Sources

