Multicenter Study
. 2024 May 15;12(5):e008927.
doi: 10.1136/jitc-2024-008927.

Development and interpretation of a pathomics-driven ensemble model for predicting the response to immunotherapy in gastric cancer

Affiliations
Multicenter Study

Development and interpretation of a pathomics-driven ensemble model for predicting the response to immunotherapy in gastric cancer

Zhen Han et al. J Immunother Cancer. .

Abstract

Background: Only a subset of patients with gastric cancer experience long-term benefits from immune checkpoint inhibitors (ICIs). Currently, there is a deficiency in precise predictive biomarkers for ICI efficacy. The aim of this study was to develop and validate a pathomics-driven ensemble model for predicting the response to ICIs in gastric cancer, using H&E-stained whole slide images (WSI).

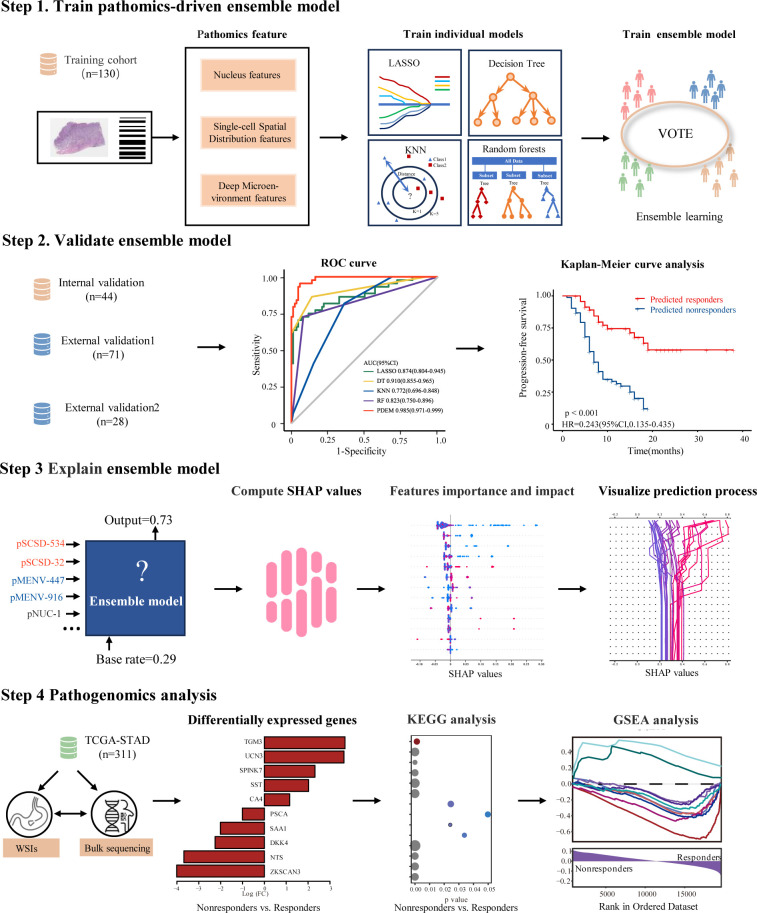
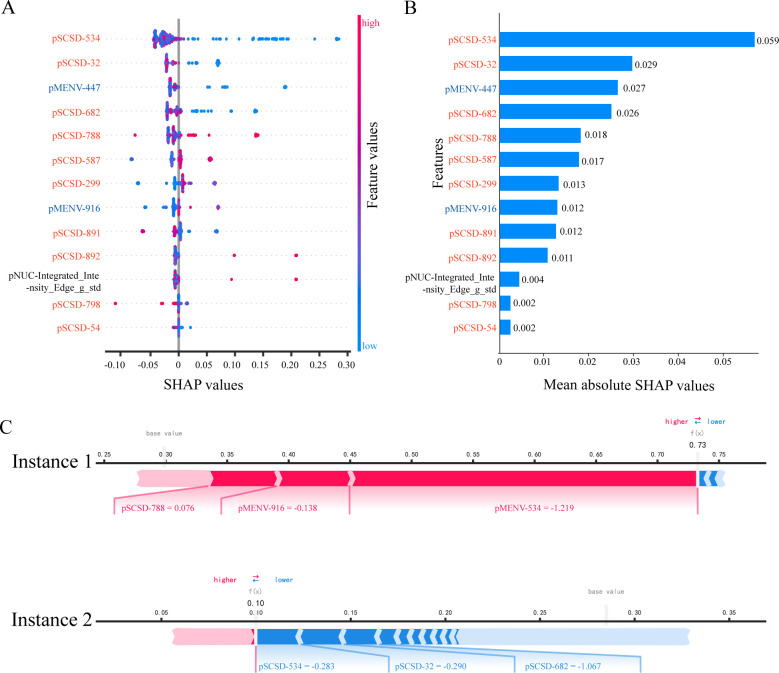
Methods: This multicenter study retrospectively collected and analyzed H&E-stained WSIs and clinical data from 584 patients with gastric cancer. An ensemble model, integrating four classifiers: least absolute shrinkage and selection operator, k-nearest neighbors, decision trees, and random forests, was developed and validated using pathomics features, with the objective of predicting the therapeutic efficacy of immune checkpoint inhibition. Model performance was evaluated using metrics including the area under the curve (AUC), sensitivity, and specificity. Additionally, SHAP (SHapley Additive exPlanations) analysis was used to explain the model's predicted values as the sum of the attribution values for each input feature. Pathogenomics analysis was employed to explain the molecular mechanisms underlying the model's predictions.

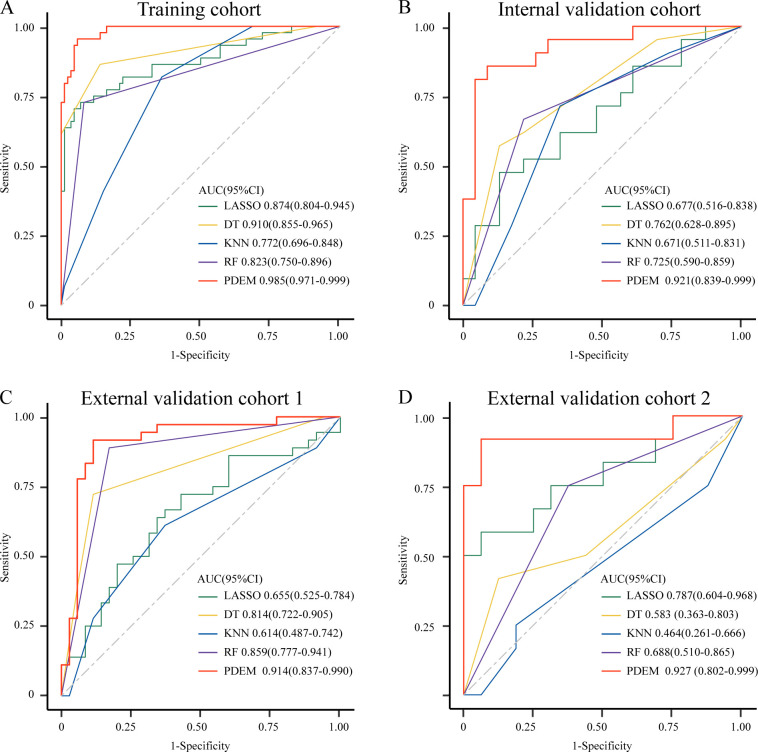
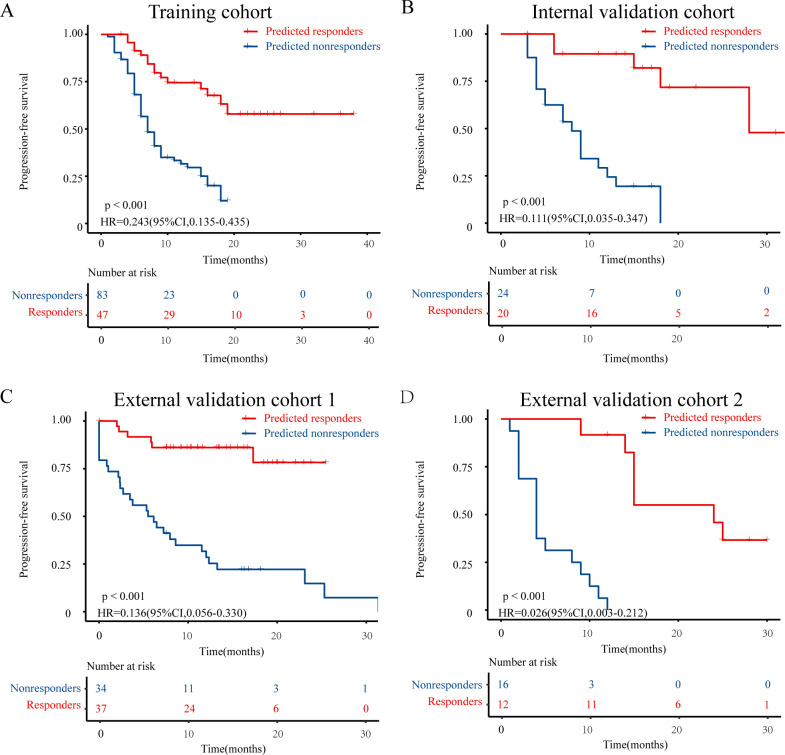
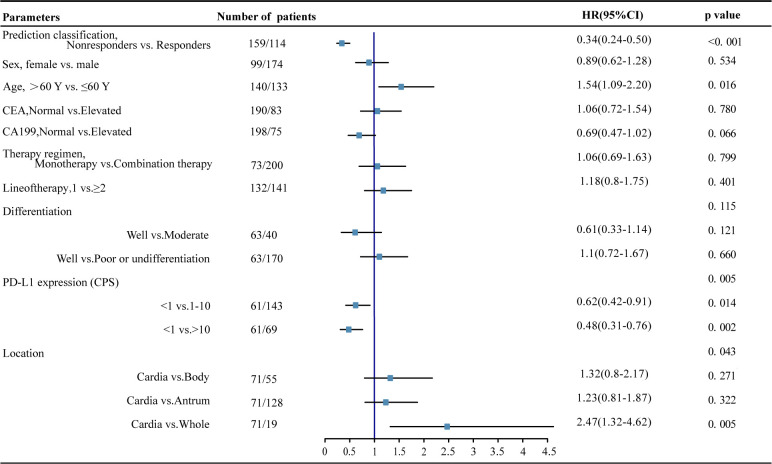
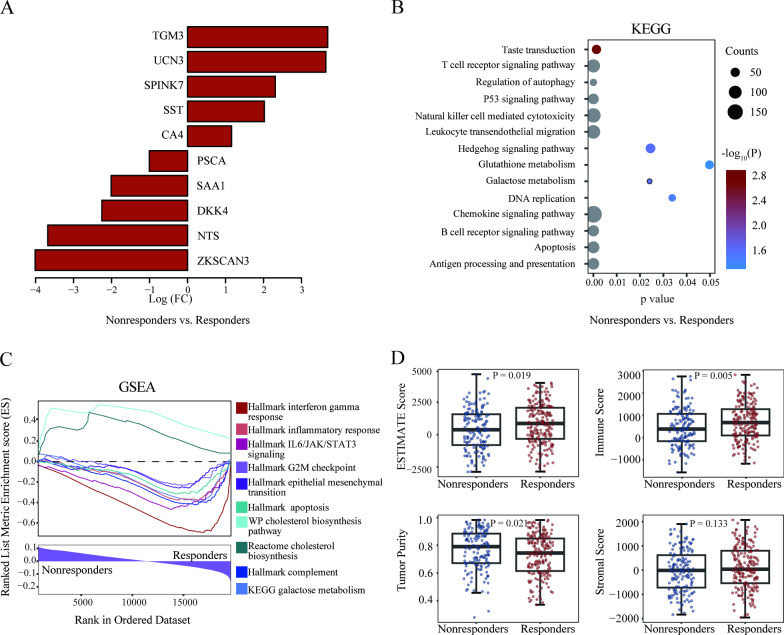
Results: Our pathomics-driven ensemble model effectively stratified the response to ICIs in training cohort (AUC 0.985 (95% CI 0.971 to 0.999)), which was further validated in internal validation cohort (AUC 0.921 (95% CI 0.839 to 0.999)), as well as in external validation cohort 1 (AUC 0.914 (95% CI 0.837 to 0.990)), and external validation cohort 2 (0.927 (95% CI 0.802 to 0.999)). The univariate Cox regression analysis revealed that the prediction signature of pathomics-driven ensemble model was a prognostic factor for progression-free survival in patients with gastric cancer who underwent immunotherapy (p<0.001, HR 0.35 (95% CI 0.24 to 0.50)), and remained an independent predictor after multivariable Cox regression adjusted for clinicopathological variables, (including sex, age, carcinoembryonic antigen, carbohydrate antigen 19-9, therapy regime, line of therapy, differentiation, location and programmed death ligand 1 (PD-L1) expression in all patients (p<0.001, HR 0.34 (95% CI 0.24 to 0.50)). Pathogenomics analysis suggested that the ensemble model is driven by molecular-level immune, cancer, metabolism-related pathways, and was correlated with the immune-related characteristics, including immune score, Estimation of STromal and Immune cells in MAlignant Tumor tissues using Expression data score, and tumor purity.

Conclusions: Our pathomics-driven ensemble model exhibited high accuracy and robustness in predicting the response to ICIs using WSIs. Therefore, it could serve as a novel and valuable tool to facilitate precision immunotherapy.

Keywords: Gastric Cancer; Immune Checkpoint Inhibitor; Pathology.


Conflict of interest statement

Competing interests: None declared.

Figures

Figure 1
Figure 1
Study design overview. In this multicenter study, a retrospective collection and analysis of whole-slide H&E images and clinical data were conducted for 584 patients. An ensemble learning model was developed and validated using pathomics features with the objective of predicting the therapeutic efficacy of immune checkpoint inhibition in gastric cancer. Model performance was assessed using metrics such as area under the curve, sensitivity, specificity, positive predictive value, and negative predictive value. Additionally, SHAP (SHapley Additive exPlanations) analysis was employed to explain the model’s predicted values as the sum of the attribution values for each input feature, and pathogenomics analysis was employed to explain the molecular mechanisms underlying the predictions made by the model. GSEA, Gene Set Enrichment Analysis; KEGG, Kyoto Encyclopedia of Genes and Genomes; KNN, k-nearest neighbors; LASSO, least absolute shrinkage and selection operator; pMENV, pathomics deep microenvironment features; pNUC, pathomics nucleus features; pSCSD, pathomics single-cell spatial distribution features; ROC curve, receiver operating characteristic curve; TCGA-STAD, The Cancer Genome Atlas-stomach adenocarcinoma.
Figure 2
Figure 2
Comparison of prediction performance between the pathomics-driven ensemble model and individual prediction models in the training and validation cohorts. The ensemble model integrated LASSO, KNN, decision trees, and random forests model. Receiver operating characteristic curves of predictive performance for immunotherapy effect in patients with gastric cancer among the four individual predictions (LASSO, KNN, decision trees, random forests) and the pathomics-driven ensemble model in the training cohort (A) internal validation cohort (B) external validation cohort 1 (C) and external validation cohort 2 (D). AUC, area under curve; DT, decision trees; KNN, k-nearest neighbors; LASSO, least absolute shrinkage and selection operator; PDEM, the pathomics-driven ensemble model; RF, random forests.
Figure 3
Figure 3
Progression-free survival Kaplan-Meier curve analysis of prediction populations. Patients identified as “predicted responders” by pathomics-driven ensemble model presented favorable progression-free survival than that of patients identified as “predicted nonresponders” in the training cohort (A) internal validation cohort (B) external validation cohort 1 (C) and external validation cohort 2 (D).
Figure 4
Figure 4
Forest plot for the multivariate cox regression analysis of progression-free survival. CA19-9, carbohydrate antigen 19-9; CEA, carcinoembryonic antigen; CPS, Combined Positive Score of PD-L1 expression;PD-L1, programmed death-ligand 1.
Figure 5
Figure 5
Interpretation of pathomics-driven ensemble model by SHAP. (A) Beeswarm summary plot of feature importance from SHAP analysis. The beeswarm plot is designed to display an information-dense summary of how the top features in a data set impact the model’s output. Each observation in the data is represented by a single dot on each feature row. The vertical axis indicates the features, ordered from top to bottom, based on their importance as predictors. The placement of the dot along the feature row is dictated by the corresponding feature’s SHAP value, and the accumulation of dots within each feature row illustrates its density. The feature values determined the color of the dots, with pink representing a direct association with the response to immune checkpoint inhibitors, while blue indicating an inverse association with the response to immune checkpoint inhibitors. (B) Feature importance plot. Passing a matrix of SHAP values to the bar plot function creates a global feature importance plot, where the global importance of each feature is taken to be the mean absolute value for that feature across all the given samples. The model’s predictions of the response to immune checkpoint inhibitors are significantly influenced by predictors exhibiting large mean SHAP values. (C) SHAP force plots. The force plots show how the model arrived at its decision. The ensemble model predicts the probability of response to immune checkpoint inhibitors, with the bolded value indicating the likelihood. Pink represents predictors that are positively associated with response, while blue represents predictors that are negatively associated. Instance 1: the SHAP force plot reveals the identification of a “responder” case that was correctly predicted. Instance 2: the SHAP force plot reveals the identification of a case as “nonresponder” by pathomics-driven ensemble model. pMENV, pathomics deep microenvironment features; pNUC, pathomics nucleus features; pSCSD, pathomics single-cell spatial distribution features; SHAP, SHapley Additive exPlanations.
Figure 6
Figure 6
Pathogenomics analysis of the pathomics-driven ensemble model. (A) The differentially expressed genes between responders and non-responders. (B) Visualization of the top enriched KEGG pathways by gene counts along with p values in responders versus non-responders. (C) Gene Set Enrichment Analysis delineated the molecular pathways significantly associated with the pathomics-driven ensemble model. (D) Associations between the pathomics-driven ensemble model and immune-related characteristics. ESTIMATE score, immune score, stroma score, and tumor purity were presented in responders versus non-responders. ESTIMATE, Estimation of STromal and Immune cells in MAlignant Tumor tissues using Expression data; GSEA, Gene Set Enrichment Analysis; KEGG, Kyoto Encyclopedia of Genes and Genomes.

References

    1. Sung H, Ferlay J, Siegel RL, et al. . Global cancer Statistics 2020: GLOBOCAN estimates of incidence and mortality worldwide for 36 cancers in 185 countries. CA A Cancer J Clinicians 2021;71:209–49. 10.3322/caac.21660 - DOI - PubMed
    1. Shitara K, Van Cutsem E, Bang Y-J, et al. . Efficacy and safety of pembrolizumab or pembrolizumab plus chemotherapy vs chemotherapy alone for patients with first-line, advanced gastric cancer: the KEYNOTE-062 phase 3 randomized clinical trial. JAMA Oncol 2020;6:1571–80. 10.1001/jamaoncol.2020.3370 - DOI - PMC - PubMed
    1. Janjigian YY, Shitara K, Moehler M, et al. . First-line nivolumab plus chemotherapy versus chemotherapy alone for advanced gastric, gastro-oesophageal junction, and oesophageal adenocarcinoma (Checkmate 649): a randomised, open-label, phase 3 trial. Lancet 2021;398:27–40. 10.1016/S0140-6736(21)00797-2 - DOI - PMC - PubMed
    1. Salas-Benito D, Pérez-Gracia JL, Ponz-Sarvisé M, et al. . Paradigms on immunotherapy combinations with chemotherapy. Cancer Discov 2021;11:1353–67. 10.1158/2159-8290.CD-20-1312 - DOI - PubMed
    1. Kono K, Nakajima S, Mimura K. Current status of immune checkpoint inhibitors for gastric cancer. Gastric Cancer 2020;23:565–78. 10.1007/s10120-020-01090-4 - DOI - PubMed

Publication types