. 2024 May 15;15(1):4112.
doi: 10.1038/s41467-024-48475-y.

Risk assessment of a highly pathogenic H5N1 influenza virus from mink

Affiliations

Risk assessment of a highly pathogenic H5N1 influenza virus from mink

Katherine H Restori et al. Nat Commun. .

Abstract

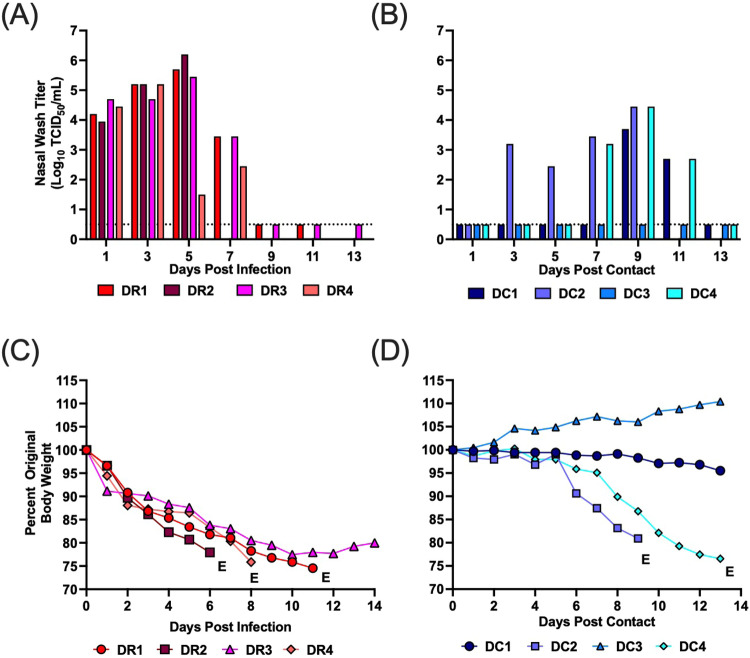
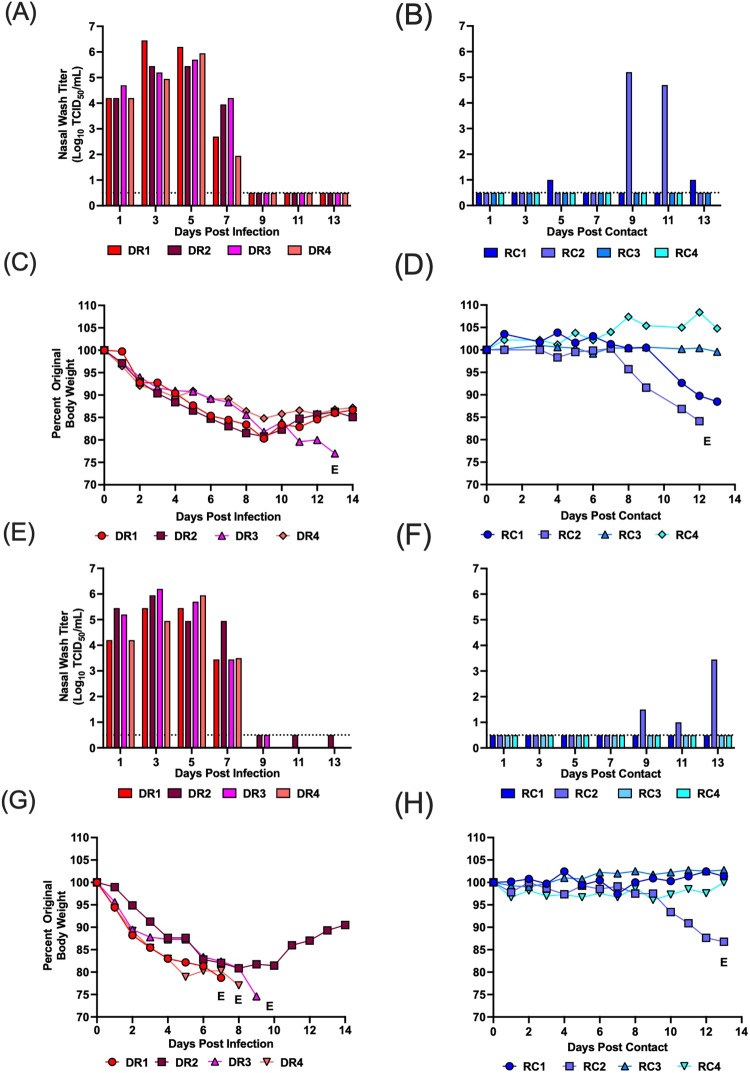
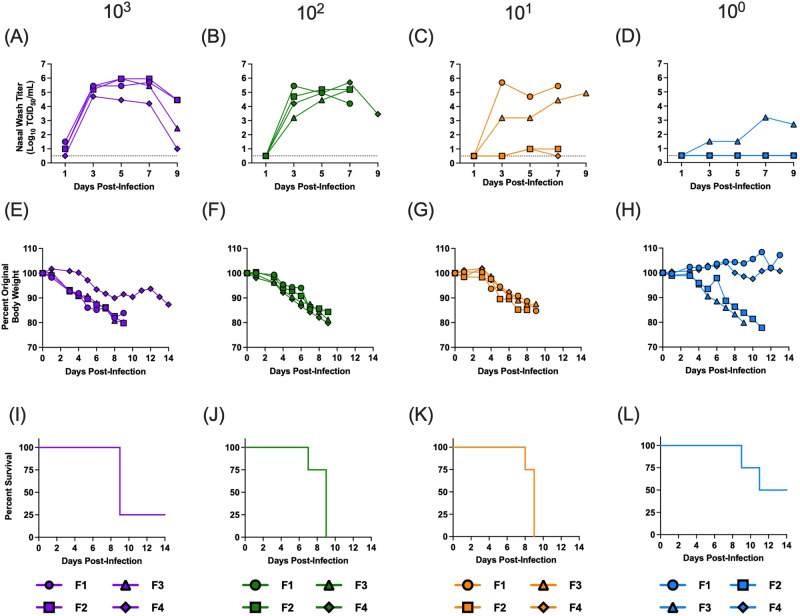
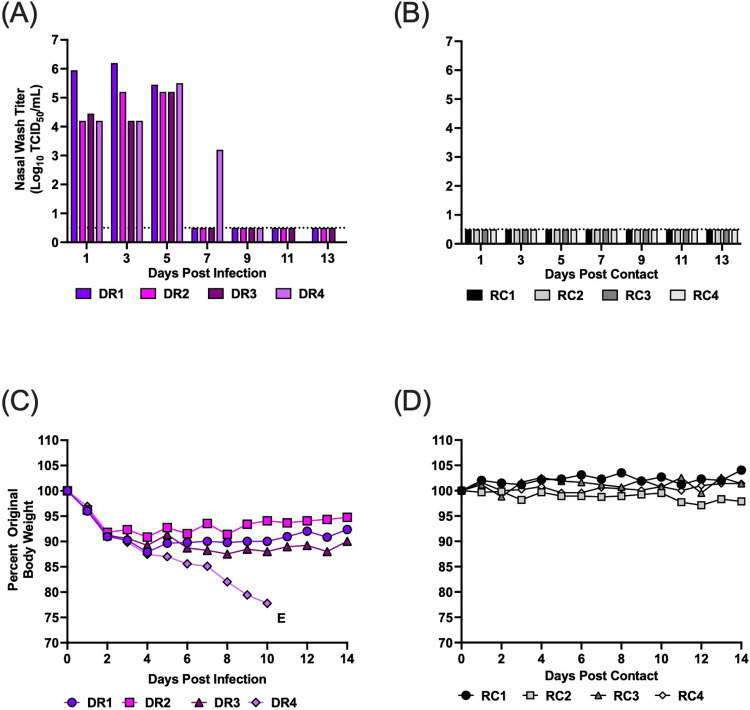
Outbreaks of highly pathogenic H5N1 clade 2.3.4.4b viruses in farmed mink and seals combined with isolated human infections suggest these viruses pose a pandemic threat. To assess this threat, using the ferret model, we show an H5N1 isolate derived from mink transmits by direct contact to 75% of exposed ferrets and, in airborne transmission studies, the virus transmits to 37.5% of contacts. Sequence analyses show no mutations were associated with transmission. The H5N1 virus also has a low infectious dose and remains virulent at low doses. This isolate carries the adaptive mutation, PB2 T271A, and reversing this mutation reduces mortality and airborne transmission. This is the first report of a H5N1 clade 2.3.4.4b virus exhibiting direct contact and airborne transmissibility in ferrets. These data indicate heightened pandemic potential of the panzootic H5N1 viruses and emphasize the need for continued efforts to control outbreaks and monitor viral evolution.


Conflict of interest statement

The authors declare no competing interests.

Figures

Fig. 1
Fig. 1. Direct contact transmission, weight loss, and survival for ferrets infected with A/mink (H5N1).
Four donor ferrets were inoculated with A/mink (H5N1) and 24 h later each donor was paired with a contact in the same cage. Nasal wash samples were collected every other day for 13 days, and weight loss and clinical signs were monitored. A, B display viral titers from donor and direct contacts, respectively. C, D show weight loss from donors and direct contacts, respectively. DR and DC denote donors and direct contacts, respectively. Each bar or line represents an individual ferret. Males are DR1, DR2, DC1 and DC2, and females are DR3, DR4, DC3 and DC4. E denotes euthanasia. Ferrets DR1, DR2, and DR4, were euthanized on day 11, 6, and 8, respectively due to pronounced weight loss, diarrhea, and nasal discharge. DC2 and DC4 were euthanized on day 9 and 13, respectively, due to pronounced weight loss. Dotted line denotes limit of detection. Source data are provided as a Source Data file.
Fig. 2
Fig. 2. Airborne transmission, weight loss and survival for ferrets infected with A/ mink (H5N1).
Two separate airborne transmission studies were performed. In each study, four donor ferrets were inoculated with A/mink (H5N1) and 24 h later each donor (DR) was paired with a single respiratory contact (RC) in a transmission cage. Nasal wash samples were collected every other day for 14 days, and weight loss and clinical signs were monitored. Transmission study 1 is depicted in (AD), and transmission study 2 is shown in (EH). Transmission study 1: A, B display viral titers from DR and RCs, respectively. C, D show weight loss from DR and RCs, respectively. Transmission study 2: E, F display viral titers from DR and RCs, respectively. G, H show weight loss from DR and RCs, respectively. Each bar or line represents an individual ferret. Males are DR1, DR2, RC1, and RC2 and females are DR3, DR4, RC3 and RC4. E denotes euthanasia. Study 1: ferret DR3 was euthanized on day 13 due to pronounced weight loss and RC2 was euthanized on day 12 post-contact due to neurological symptoms (hind-limb paralysis). Study 2: ferret DR1, DR3, DR4 were euthanized on days 7, 9, and 8, respectively, due to pronounced weight loss, and RC2 was euthanized on day 13 post-contact due to nasal hemorrhage. Dotted line denotes limit of detection. Source data are provided as a Source Data file.
Fig. 3
Fig. 3. A/mink (H5N1) virus has a low infectious dose in ferrets and remains virulent at low doses.
Groups of ferrets (n = 4/group) were inoculated with 103 (purple), 102 (green), 101 (orange) or 100 (blue) TCID50 of A/mink (H5N1). Nasal wash samples were collected every other day for 9 days and clinical signs were monitored for 14 days. The inoculation dose for each group of ferrets is indicated at the top of the figure. AD Viral titers in the nasal wash samples at each inoculation dose, EH weight loss in each ferret after virus inoculation, and IL percent survival in each group of ferrets. For (AH), each line represents an individual ferret. Males are F1 and F2 and females are F3 and F4. Nasal wash samples were titrated on MDCK cells and results are expressed as tissue culture infectious dose 50% (TCID50). Dotted line denotes limit of detection. Source data are provided as a Source Data file.
Fig. 4
Fig. 4. PB2 A271T exhibits decreased polymerase activity in vitro and decreased mortality in ferrets relative to wild-type A/mink (H5N1).
Polymerase activity was determined by performing mini-genome assays in 293T cells at 33 and 37 °C. A Activity of the wild-type polymerase versus the polymerase with the mutation PB2 A271T at 24 h post-transfection. B Activity of the polymerase carrying the PB2 A271T mutation expressed as a percent of the activity of the wild-type polymerase. Data shown are mean ± SD from 1 of 3 representative independent experiments with n = 3 biologically independent samples/experiment. CE display ferret studies. Four ferrets per group were inoculated with 102 TCID50/mL of either wild-type A/mink (H5N1) (i.e., PB2 271A) or A/mink (H5N1) with PB2 A271T mutation. Nasal wash samples were collected every other day, and weight loss and clinical signs were monitored daily for 14 days. C Displays viral titers as mean ± SD, D shows weight loss for individual animals, and E depicts survival (n = 4/group). Blue and green bars and lines represent wild-type PB2 and PB2 A271T, respectively. Dotted line denotes limit of detection. *p = 0.015 and **p = 0.018 using a two-tailed unpaired Student’s t test with Welch’s correction. Source data are provided as a Source Data file.
Fig. 5
Fig. 5. Airborne transmission, weight loss and survival for ferrets infected with PB2 A271T A/mink (H5N1).
Four donor ferrets were inoculated with A/mink (H5N1) PB2 A271T and 24 h later each donor was paired with a single respiratory contact in a transmission cage. Nasal wash samples were collected every other day for 14 days, and weight loss and clinical signs were monitored. A, C, and B, D display viral titers and weight loss from individual donor and respiratory contacts, respectively. DR and RC denote donor and respiratory contact, respectively. Each bar or line represents an individual animal. Males are DR1, DR2, RC1 and RC2 and females are DR3, DR4, RC3 and RC4. E denotes euthanasia. Ferret DR4 was euthanized on day 10 due to pronounced weight loss. Dotted line denotes limit of detection. Source data are provided as a Source Data file.
Fig. 6
Fig. 6. Analyses of peak titers and total viral shedding for ferrets inoculated with wild-type or PB2 A271T A/mink (H5N1) virus.
AD display peak viral titers and total viral shedding, respectively, for ferrets infected with either wild-type A/mink (H5N1) or A/mink (H5N1) with the PB2 A271T mutation. A, C show peak titers and total viral shedding, respectively, for ferrets infected at a dose of 102 TCID50 (n = 4/virus) in studies comparing viral shedding, weight loss, and survival (Fig. 4). B, D compared donor ferrets from both airborne transmission study 1 and 2 (combined n = 8) that were inoculated with wild-type A/mink (H5N1) to the donor ferrets for the transmission study with PB2 A271T A/mink (H5N1) (n = 4) virus. For all transmission studies, the inoculation dose in donors was 106 TCID50. Total viral shedding was determined via area under the curve (AUC) analyses of viral titers in the nasal wash from days 1–7. Values shown are mean ± SE. Peak titers and AUC values for each virus were compared using a two-tailed unpaired Student’s t test with Welch’s correction. *p = 0.039. Blue and green represent wild-type and PB2 A271T A/mink (H5N1), respectively, at an inoculation of 102, while red and purple represent the same viruses, respectively, at an inoculation dose of 106. Source data are provided as a Source Data file.

References

    1. Chan PK. Outbreak of avian influenza A(H5N1) virus infection in Hong Kong in 1997. Clin. Infect. Dis. 2002;34:S58–S64. doi: 10.1086/338820. - DOI - PubMed
    1. Shortridge KF. Poultry and the influenza H5N1 outbreak in Hong Kong, 1997: abridged chronology and virus isolation. Vaccine. 1999;17:S26–S29. doi: 10.1016/S0264-410X(99)00102-4. - DOI - PubMed
    1. Subbarao K, et al. Characterization of an avian influenza A (H5N1) virus isolated from a child with a fatal respiratory illness. Science. 1998;279:393–396. doi: 10.1126/science.279.5349.393. - DOI - PubMed
    1. Centers for Disease Control and Prevention. Past Reported Global Human Cases with Highly Pathogenic Avian Influenza A(H5N1) (HPAI H5N1) by Country, 1997-2023.https://www.cdc.gov/flu/avianflu/chart-epi-curve-ah5n1.html (2023).
    1. European Food Safety Authority et al. Avian influenza overview December 2022–March 2023. EFSA J. 2023;21:e07917. doi: 10.2903/j.efsa.2023.7917. - DOI - PMC - PubMed