

Macro-scale relationship between body mass and timing of bird migration
- PMID: 38750018
- PMCID: PMC11096376
- DOI: 10.1038/s41467-024-48248-7
Macro-scale relationship between body mass and timing of bird migration
Abstract
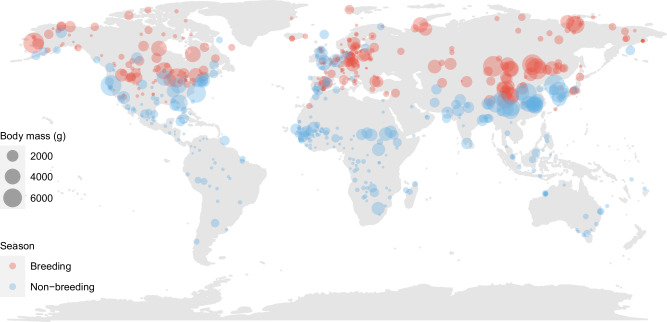
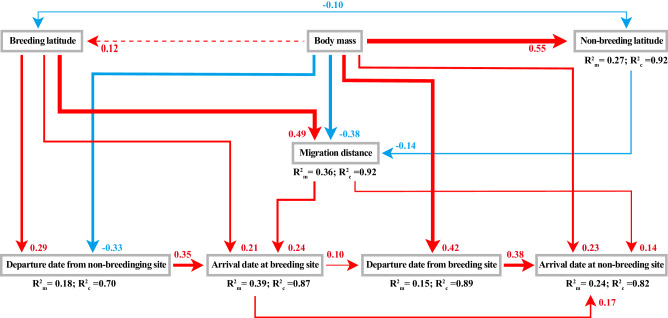
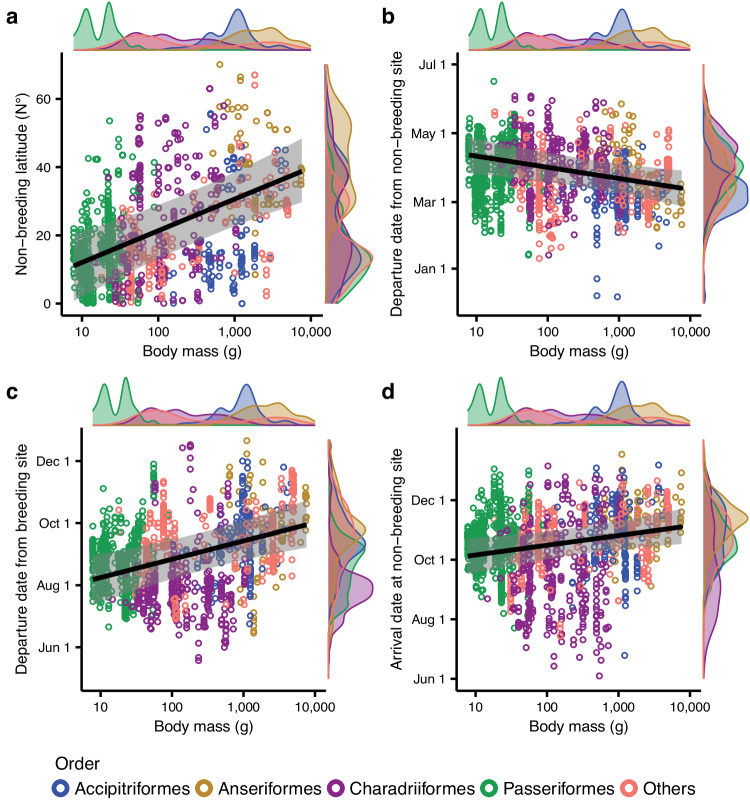
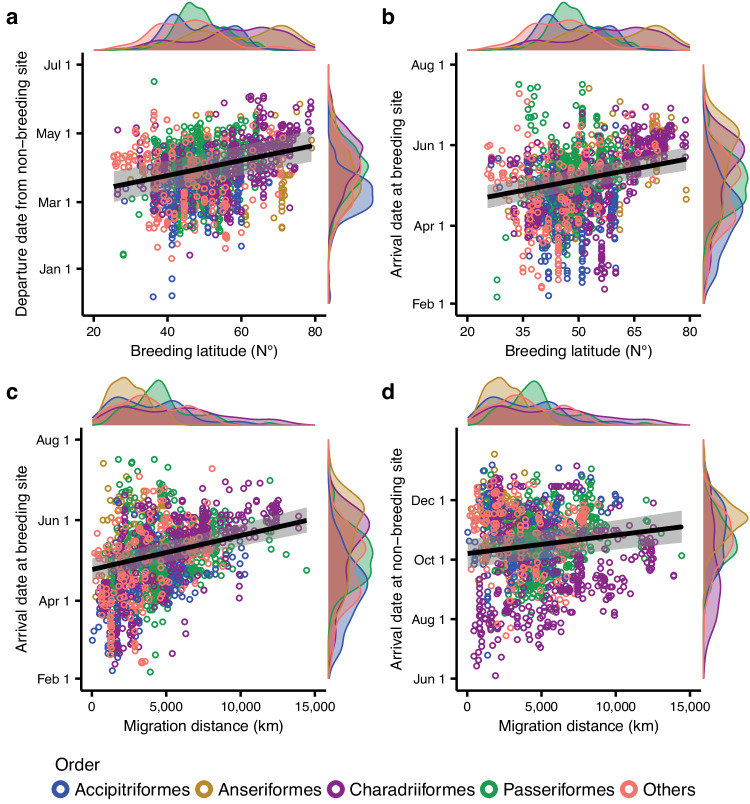
Clarifying migration timing and its link with underlying drivers is fundamental to understanding the evolution of bird migration. However, previous studies have focused mainly on environmental drivers such as the latitudes of seasonal distributions and migration distance, while the effect of intrinsic biological traits remains unclear. Here, we compile a global dataset on the annual cycle of migratory birds obtained by tracking 1531 individuals and 177 populations from 186 species, and investigate how body mass, a key intrinsic biological trait, influenced timings of the annual cycle using Bayesian structural equation models. We find that body mass has a strong direct effect on departure date from non-breeding and breeding sites, and indirect effects on arrival date at breeding and non-breeding sites, mainly through its effects on migration distance and a carry-over effect. Our results suggest that environmental factors strongly affect the timing of spring migration, while body mass affects the timing of both spring and autumn migration. Our study provides a new foundation for future research on the causes of species distribution and movement.
© 2024. The Author(s).
Conflict of interest statement
The authors declare no competing interests.
Figures
Similar articles
-
Among-species variation in six decades of changing migration timings explained through ecology, life-history and local migratory abundance.Glob Chang Biol. 2024 Jul;30(7):e17400. doi: 10.1111/gcb.17400. Glob Chang Biol. 2024. PMID: 39007244
-
A full annual perspective on sex-biased migration timing in long-distance migratory birds.Proc Biol Sci. 2019 Feb 27;286(1897):20182821. doi: 10.1098/rspb.2018.2821. Proc Biol Sci. 2019. PMID: 30963841 Free PMC article.
-
Experimental reduction of winter food decreases body condition and delays migration in a long-distance migratory bird.Ecology. 2015 Jul;96(7):1933-42. doi: 10.1890/14-1365.1. Ecology. 2015. PMID: 26378315
-
Individual repeatability of avian migration phenology: A systematic review and meta-analysis.J Anim Ecol. 2022 Jul;91(7):1416-1430. doi: 10.1111/1365-2656.13697. Epub 2022 Apr 18. J Anim Ecol. 2022. PMID: 35385132 Free PMC article.
-
Understanding the ecological and evolutionary function of stopover in migrating birds.Biol Rev Camb Philos Soc. 2022 Aug;97(4):1231-1252. doi: 10.1111/brv.12839. Epub 2022 Feb 8. Biol Rev Camb Philos Soc. 2022. PMID: 35137518 Review.
Cited by
-
Migratory herbivorous waterfowl track multiple resource waves during spring migration.Proc Biol Sci. 2024 Jan;291(2030):20241448. doi: 10.1098/rspb.2024.1448. Epub 2024 Sep 11. Proc Biol Sci. 2024. PMID: 39257318 Free PMC article.
-
The Fragile First Year: GPS Tracking Identifies Post-Release Survival Risks in Migratory Geese.Ecol Evol. 2025 Jul 4;15(7):e71725. doi: 10.1002/ece3.71725. eCollection 2025 Jul. Ecol Evol. 2025. PMID: 40625318 Free PMC article.
References
-
- Newton, I. The Migration Ecology of Birds (Elsevier, 2008).
-
- Åkesson S, Helm B. Endogenous programs and flexibility in bird migration. Front. Ecol. Evol. 2020;8:78. doi: 10.3389/fevo.2020.00078. - DOI
MeSH terms
Grants and funding
LinkOut - more resources
Full Text Sources
