. 2024 May 15;15(1):4096.
doi: 10.1038/s41467-024-48422-x.

Octyl itaconate enhances VSVΔ51 oncolytic virotherapy by multitarget inhibition of antiviral and inflammatory pathways

Affiliations

Octyl itaconate enhances VSVΔ51 oncolytic virotherapy by multitarget inhibition of antiviral and inflammatory pathways

Naziia Kurmasheva et al. Nat Commun. .

Erratum in

  • Author Correction: Octyl itaconate enhances VSVΔ51 oncolytic virotherapy by multitarget inhibition of antiviral and inflammatory pathways.
    Kurmasheva N, Said A, Wong B, Kinderman P, Han X, Rahimic AHF, Kress A, Carter-Timofte ME, Holm E, van der Horst D, Kollmann CF, Liu Z, Wang C, Hoang HD, Kovalenko E, Chrysopoulou M, Twayana KS, Ottosen RN, Svenningsen EB, Begnini F, Kiib AE, Kromm FEH, Weiss HJ, Di Carlo D, Muscolini M, Higgins M, van der Heijden M, Arulanandam R, Bardoul A, Tong T, Ozsvar A, Hou WH, Schack VR, Holm CK, Zheng Y, Ruzek M, Kalucka J, de la Vega L, Elgaher WAM, Korshoej AR, Lin R, Hiscott J, Poulsen TB, O'Neill LA, Roy DG, Rinschen MM, van Montfoort N, Diallo JS, Farin HF, Alain T, Olagnier D. Kurmasheva N, et al. Nat Commun. 2024 Dec 19;15(1):10698. doi: 10.1038/s41467-024-55044-w. Nat Commun. 2024. PMID: 39702301 Free PMC article. No abstract available.

Abstract

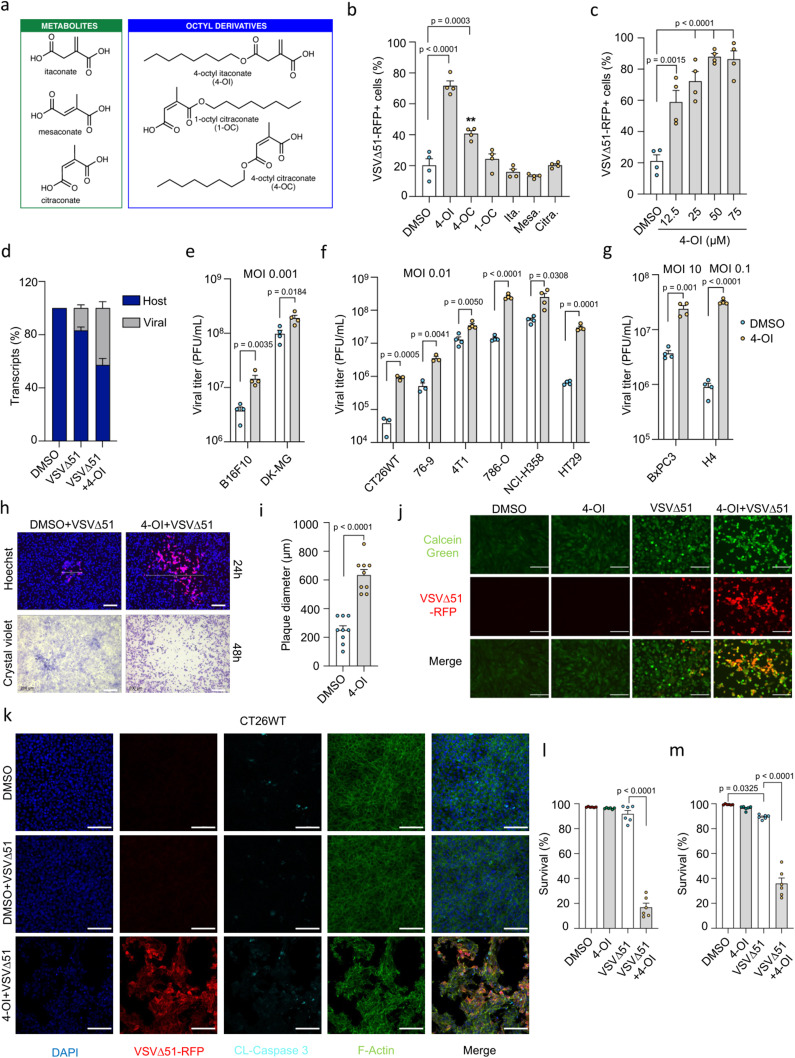
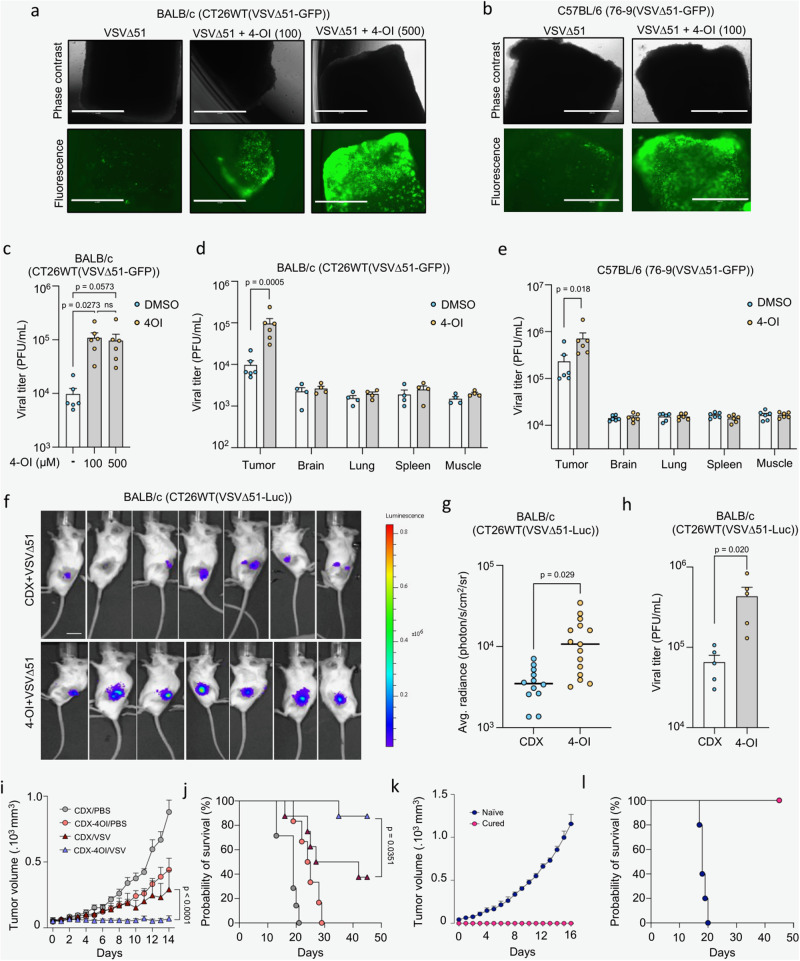
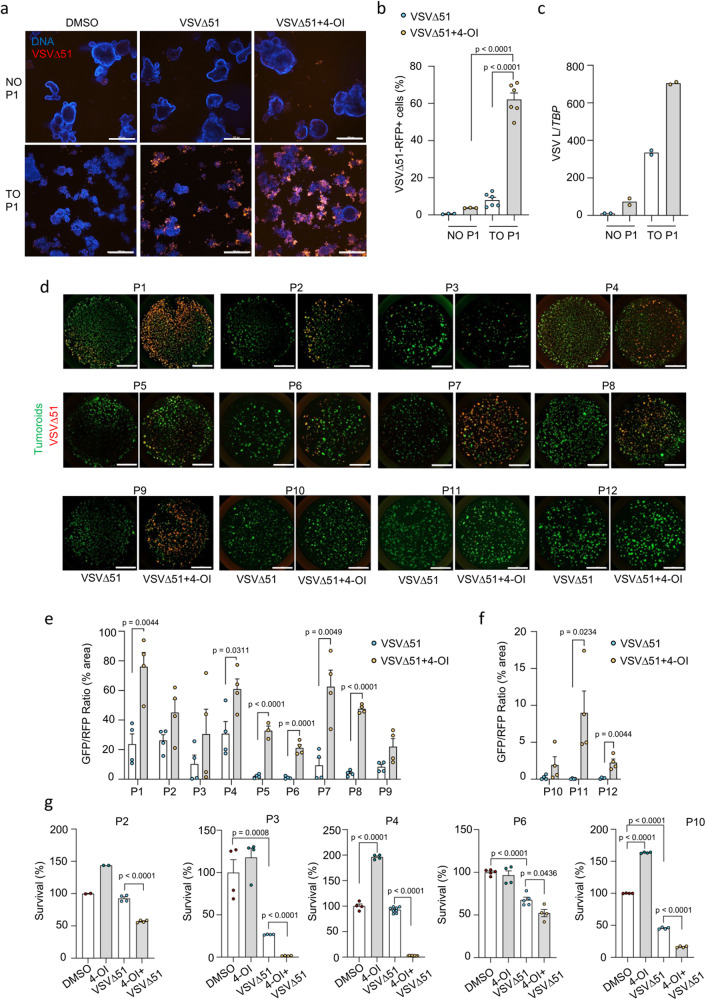
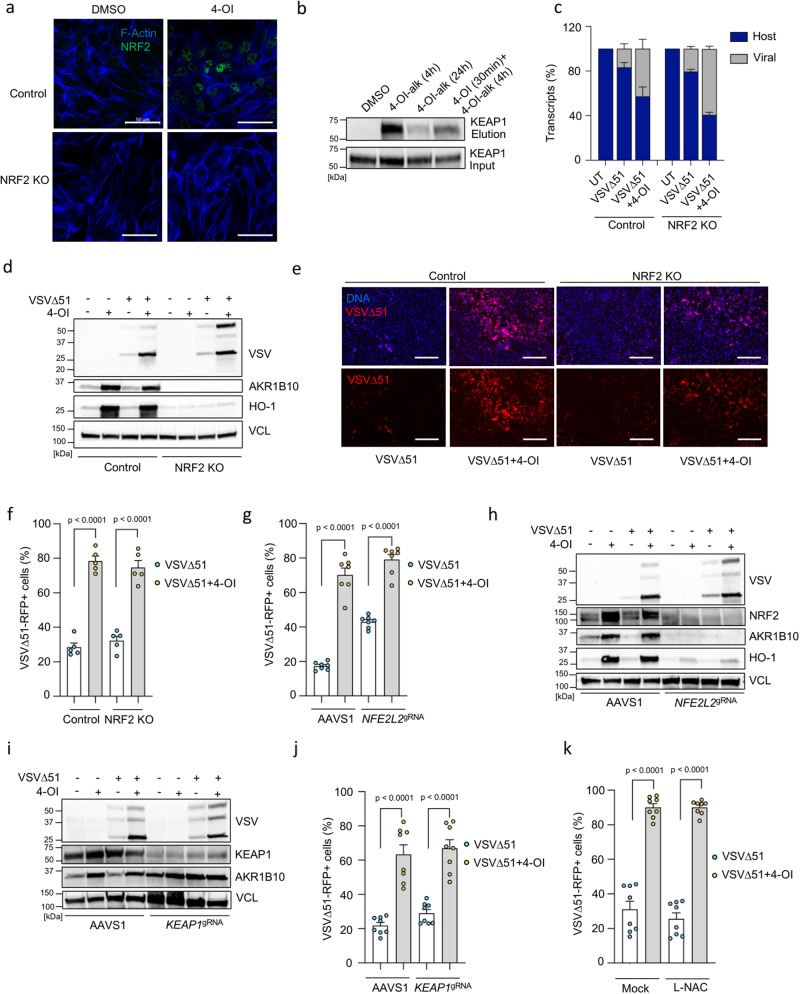
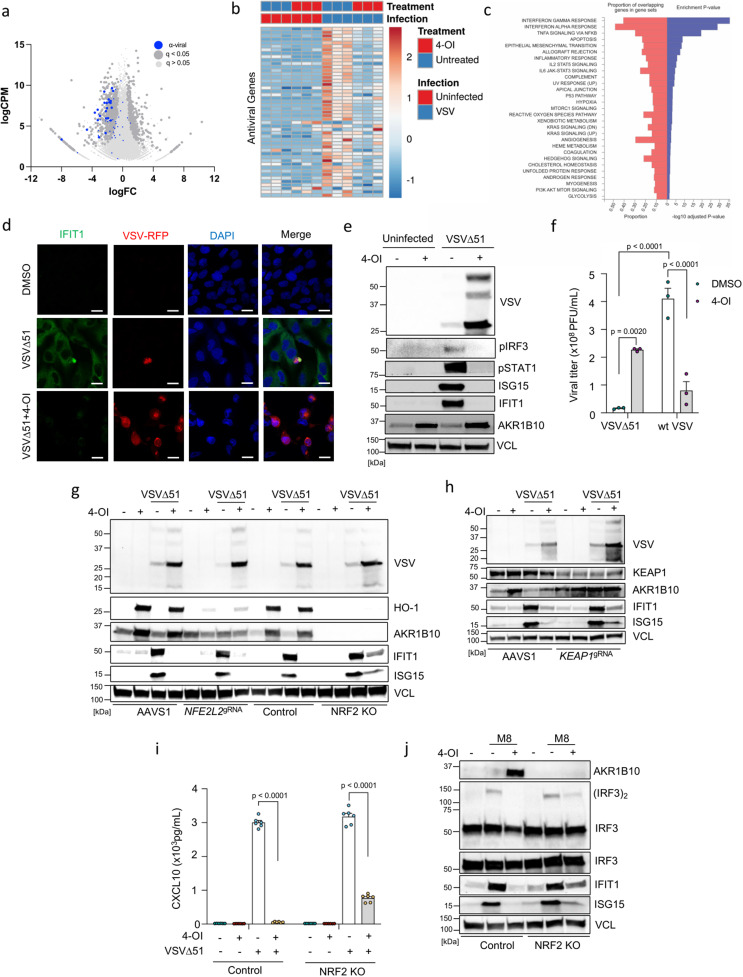
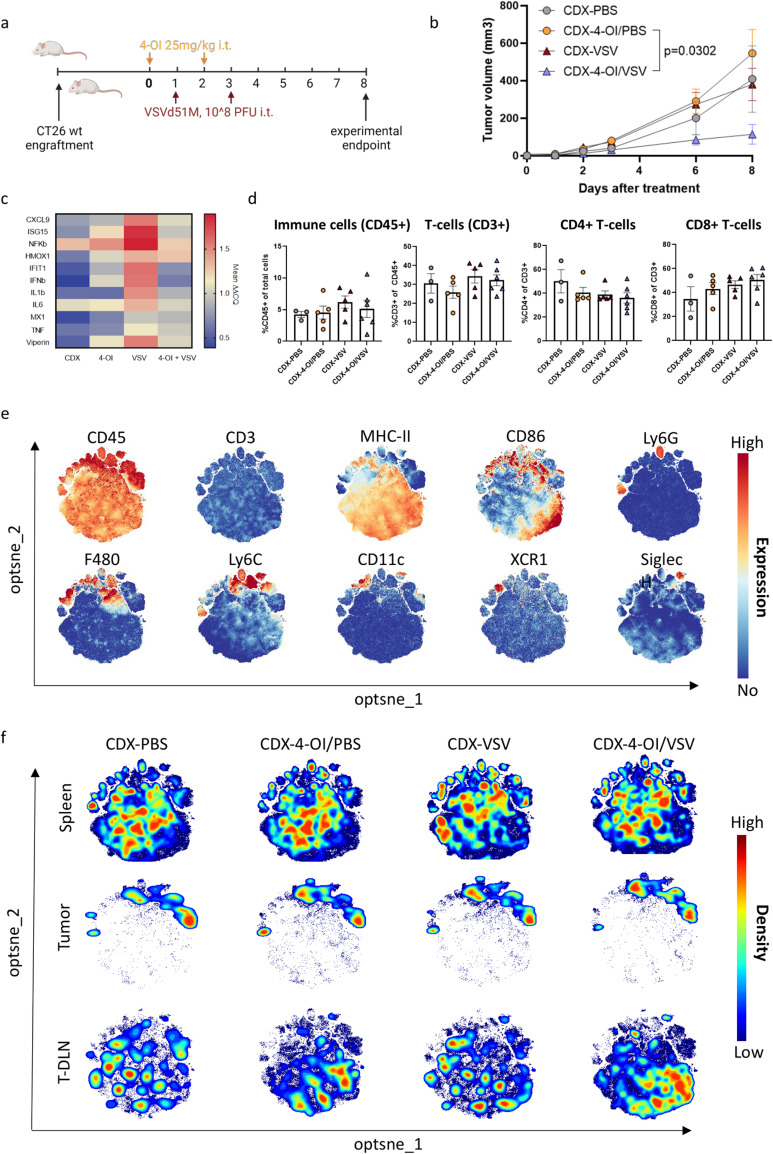
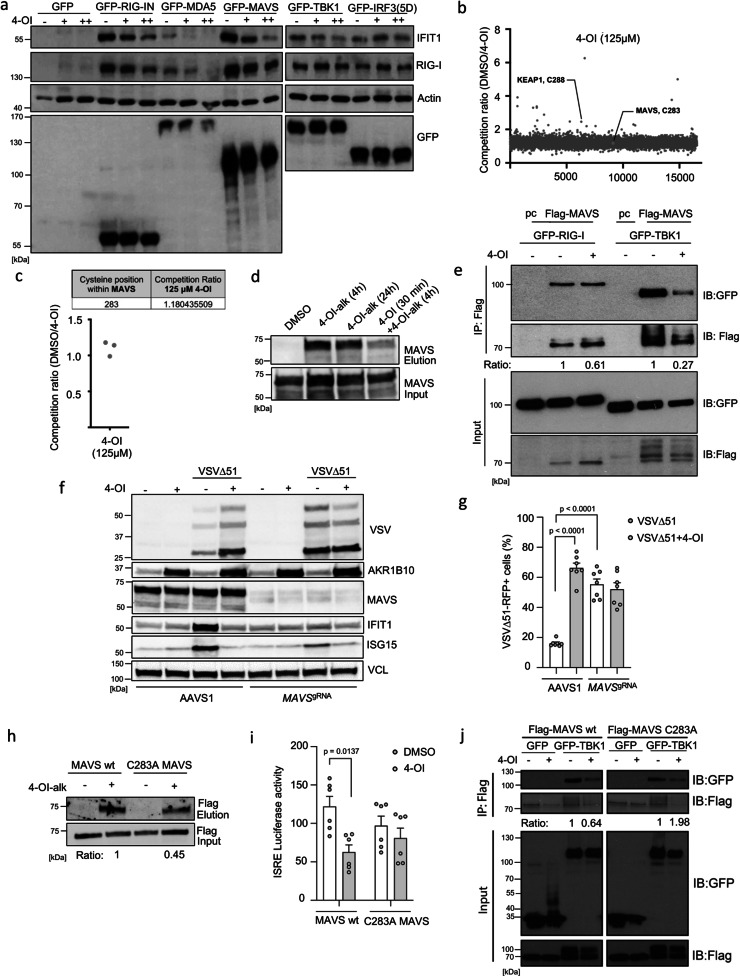
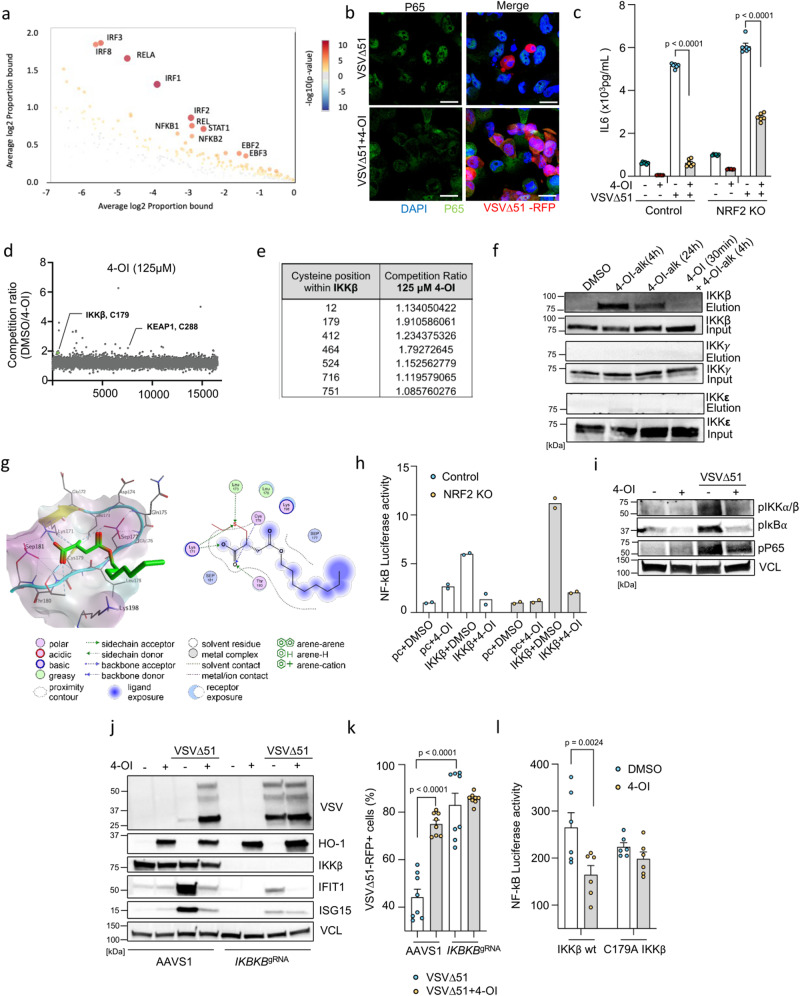
The presence of heterogeneity in responses to oncolytic virotherapy poses a barrier to clinical effectiveness, as resistance to this treatment can occur through the inhibition of viral spread within the tumor, potentially leading to treatment failures. Here we show that 4-octyl itaconate (4-OI), a chemical derivative of the Krebs cycle-derived metabolite itaconate, enhances oncolytic virotherapy with VSVΔ51 in various models including human and murine resistant cancer cell lines, three-dimensional (3D) patient-derived colon tumoroids and organotypic brain tumor slices. Furthermore, 4-OI in combination with VSVΔ51 improves therapeutic outcomes in a resistant murine colon tumor model. Mechanistically, we find that 4-OI suppresses antiviral immunity in cancer cells through the modification of cysteine residues in MAVS and IKKβ independently of the NRF2/KEAP1 axis. We propose that the combination of a metabolite-derived drug with an oncolytic virus agent can greatly improve anticancer therapeutic outcomes by direct interference with the type I IFN and NF-κB-mediated antiviral responses.


Conflict of interest statement

M.M.R. reports research funding from Novo Nordisk A/S. The remaining authors declare no competing interests.

Figures

Fig. 1
Fig. 1. 4-OI promotes VSVΔ51 infection and oncolysis.
a Structures of itaconate, isomers and octyl-derivatives b 786-O cells pretreated with octyl-derivatives (80 μM) or metabolites (25 mM) for 24 h, then infected with VSVΔ51 (MOI of 0.01). Virus-infected cells quantified by flow cytometry at 17 h post-infection. c Flow cytometry analysis of virus-infected cells in 786-O cells treated with increasing 4-OI concentrations at 17  h post-infection. d Host vs viral RNA ratio in VSVΔ51-infected 786-O cells (MOI of 0.01) with or without 4-OI (75 μM). eg Cancer lines pretreated with 4-OI (125 μM or 75 μM for 786-O cells) for 24 h, then infected with VSVΔ51 at varying MOIs. Viral titers determined from supernatants 24 h post-infection. h 786-O cells pretreated with 4-OI (75 μM) for 24 h and infected with VSVΔ51 (MOI of 0.0001), followed by plaque imaging. Scale bars, 200 μm. i Plaque diameters measured 24 h after infection. j 786-O cellular layer integrity assessed by Calcein green staining after treatment with 4-OI (75 μM) and VSVΔ51 infection (MOI 0.01) for 24 h. Scale bars, 100 μm. k CT26WT cells treated with 4-OI (125 μM) for 24 h post-infection with VSVΔ51 (MOI 0.01) for 48 h. Cleaved caspase 3 in cyan blue, nuclei in dark blue stained with DAPI, and actin filaments with phalloidin in green. Scale bars, 100 μm. l, m CT26WT and 786-O cells pretreated with 4-OI (125 μM) and (75 μM), respectively, for 24 h, then infected with VSVΔ51 at a MOI of 0.01. Percentage of viable cells determined by flow cytometry at 30 h post-infection. Data are means ± SEM of two independent experiments in duplicates in (b, c, eg) (except for CT26WT and 76-9, from one experiment in triplicates); one experiment in triplicates for (d); one experiment in multiple replicates for (I); and two experiments in triplicates for (l, m). Images are from one experiment in (h), one representative experiment out of two in (j), and one out of two in (k). Statistical significance indicated by one-way ANOVA for (b, c, l, m); and two-tailed Student’s t-test for (eg, i). Source data provided in a Source Data file.
Fig. 2
Fig. 2. 4-OI enhances VSVΔ51 infection ex vivo in murine tumor cores and improves its efficacy in vivo.
ac BALB/c-derived CT26WT tumor cores pretreated with 4-OI at different concentrations for 4 h before VSVΔ51-GFP challenge (3 × 104 PFU). Representative fluorescence images (scale bars, 1000 μm) shown in (a) with viral titers determined from supernatants at 24 h post-infection in (c). C57BL/6-derived 76-9 tumor cores pretreated with 4-OI (100 μM) for 4 h before VSVΔ51-GFP challenge (3 × 104 PFU). Representative fluorescence images (scale bars, 1000 μm) in (b). d, e CT26WT implanted subcutaneously in BALB/c (d) and 76-9 cells in C57BL/6 mice (e), Tumors explanted and cored with surrounding healthy tissues, pretreated with 4-OI (100 μM) or DMSO before VSVΔ51-GFP infection (3 × 104 PFU). Viral titers were determined 48 h post-infection. fh CT26WT tumor-bearing BALB/c mice intratumorally treated with vehicle or 4-OI (25 mg/kg/dose) for 24 h before VSVΔ51-luciferase challenge (108 PFU). Bioluminescent images taken and luminescence quantified 24 h post-infection (f, g), and viral titers determined at 48 h post-infection (h). i, j Tumor volume (I) and survival (j) monitored after intratumoral injection of 4-OI prior to VSVΔ51 challenge, treatment regimen was repeated twice (n = 7 in CDX-PBS group; n = 6 in CDX-4-OI/PBS group, n = 8 in CDX-VSVΔ51 and CDX-4-OI/VSVΔ51 groups). k, l Tumor volume (k) and survival (l) monitored after reimplantation of CT26WT cells in cured animals from CDX-4-OI/VSVΔ51 group from (c) and naïve mice. n = 5 animals per group. Data are depicted as means ± SEM in (ce, g–i, k). Data points in (ce) are from 4–6 animals. Data in (g) are from two independent experiments performed on 12–15 animals and from one experiment on 5 animals in (h). Pictures are from one representative experiment out of two in (a, b), and from 7 representative animals out of 12–15 per group in (f). Statistics indicate significance by one-way ANOVA for (c); two-way ANOVA for (d, e, I); two-tailed Student’s t-test for (g, h); log-rank (Mantel–Cox) test for (j). Source data are provided as a Source Data file.
Fig. 3
Fig. 3. 4-OI promotes selective replication of VSVΔ51 in colon tumor organoids.
a Confocal imaging of colon normal (NO) and tumor organoids (TO) pretreated with 4-OI (125 μM) for 24 h, then infected with VSVΔ51-RFP (1 × 106 pfu/well). Images taken two days post-infection using Hoescht dye as a DNA staining agent. Scale bars, 300 μm. b Flow cytometry counts of infected RFP-positive cells in enzymatically digested colon NO and TO organoids from patient 1 (P1) at two days post-infection with VSVΔ51-RFP (1 × 106 pfu/well), with or without 4-OI (125 μM). c qPCR analysis of VSV L gene expression normalized to a housekeeping gene (TBP) in colon NO and TO organoids from patient 1 (P1) at one-day post-infection with VSVΔ51 (1 × 106 pfu/well), with or without 4-OI (125 μM). d Imaging setup in a 48-well plate to evaluate the infectivity of VSVΔ51-RFP infection (1 × 106 pfu/well) solely and in combination with 4-OI in colon cancer organoids from 12 patients (P1 to P12) at 48 h post-infection. Organoid area evaluated either by GFP transduction or calcein green staining. Scale bars, 3000 μm. e, f Representative values from the imaging setup expressed as a percentage of RFP fluorescence from VSVΔ51 normalized to total GFP area from tumor organoids. g Remaining luciferase activity to assess in vitro cytotoxicity of VSVΔ51 alone or combined with 4-OI towards luciferase-expressing colon tumor organoids from different patients at 4 days of post-infection is presented as “survival”. Data are depicted as means ± SEM from two independent experiments performed in biological triplicates from one patient in (b), from one experiment performed in biological duplicates from one patient in (c), from one experiment performed in biological triplicates on tumoroids from 12 individual patients in (e, f), from one experiment performed in biological quadruplicates from 5 individual patients in (g). Pictures are from one representative experiment out of two in (a), and from one experiment performed on all individual patient material in (d). Statistics indicate significance by one-way ANOVA for (b, g), and two-tailed Student’s t-test for (e, f). Source data are provided as a Source Data file.
Fig. 4
Fig. 4. 4-OI enhances VSVΔ51 infectivity independently of NRF2 and KEAP1 in cancer cells.
a NRF2 protein levels in control and NRF2 knockout (KO) 786-O cells treated with 4-OI (75 μM) for 24 h using confocal microscopy. Blue: actin filaments, green: NRF2. Scale bars, 50 μm. b KEAP1 levels analyzed in 786-O cells treated with alkynated 4-OI (4-OI-alk) (125 μM) for 4 or 24 h with or without non-alkynated 4-OI (125 μM) by anti-KEAP1 immunoblotting. c Viral RNA content assessed by RNA sequencing in VSVΔ51-infected (MOI of 0.01) control and NRF2 KO 786-O cells with or without 4-OI (75 μM) pretreatment. df Immunoblot analysis in control and NRF2 KO cells pretreated with 4-OI (75 μM) before VSVΔ51 challenge (MOI of 0.01) (d). Fluorescence microscopy showing VSVΔ51-RFP spread and cellular layer integrity with Hoechst stain overlay (Scale bars, 300 μm) (e) and quantification of infected cells by flow cytometry at 17 h post-infection (f). gj Quantification of virus-infected cells by flow cytometry in 786-O cells transiently KO for NRF2 (g) or KEAP1 (j). Immunoblot analysis in NRF2 KO (h) and KEAP1 KO cells (i) pretreated with 4-OI (75 μM) before VSVΔ51 challenge (MOI of 0.01). k 786-O cells incubated with L-NAC (1 mM) for 3 h before 4-OI challenge (75 μM) for 24 h, then infected with VSVΔ51-RFP (MOI of 0.01). Quantification of infected cells by flow cytometry at 17 h post-infection. Data are means ± SEM from two independent experiments in biological duplicates and triplicates in (f), and in biological triplicates and quadruplicates in (g). Two experiments in biological quadruplicates in (j) and (k). Images from one representative experiment in triplicates in (a) and (e). Data in (b) and (d) from one representative of three independent experiments. Data as means ± SEM from one experiment in biological triplicates in (c). Statistics indicate significance by one-way ANOVA for (f, g, j, k). Vertical stacks of bands are not derived from the same membrane in (d, h, I). Source data provided in the Source Data file.
Fig. 5
Fig. 5. 4-OI impairs VSVΔ51-induced antiviral immune responses.
ac 786-O cells pretreated with 4-OI (75 μM) for 24 h and infected with VSVΔ51 (MOI 0.01) for 17 h. RNA sequencing analysis emphasizing on antiviral genes (blue dots) in the volcano plot (a), differentially expressed interferon-stimulated genes (ISGs) in the heat map (b), and top KEGG pathways affected by 4-OI during viral infection (one-sided hypergeometric test, Benjamini–Hochberg method was applied to adjust the p-value for multiple testing) (c). d, e 786-O cells pretreated with 4-OI (125 μM) for 24 h and infected with VSVΔ51-RFP (MOI 0.01) for 24 h. IFIT1 levels assessed by fluorescence microscopy (d), and Western blot performed on cell lysates for antiviral proteins (e). f 786-O cells pretreated with 4-OI (75 μM) for 24 h infected with wild-type VSV (wt VSV) or VSVΔ51 at MOI 0.01. Viral titers determined 24 h post-infection. gi Control and NRF2 KO 786-O cells, as well as 786-O cells transiently KO for NRF2 or KEAP using CRISPR/Cas9, pretreated with 4-OI (75 μM) for 24 h and infected with VSVΔ51 (MOI 0.01) for 17 h. Immunoblots in (g, h). CXCL10 release measured by ELISA from supernatants in (I). j Control and NRF2 KO 786-O cells pretreated with 4-OI (75 μM) for 24 h and stimulated with the RIG-I agonist M8 (3.5 ng/mL) for 5 h. Western blot performed on cell lysates. Data are from one experiment performed in triplicate in (ac). Images are from one experiment in (d). Data are from one representative experiment performed at least three times in (e). Data are depicted as means ± SEM from one experiment performed in triplicate in (f). Data are from one representative experiment out of three in (g), out of two in (h) and (j). Data are depicted as means ± SEM from two experiments performed in triplicate in (I). Statistics indicate significance by two-way ANOVA for (f, I). Vertical stacks of bands are not derived from the same membrane in (e, g, h, j). Source data provided as a Source Data file.
Fig. 6
Fig. 6. 4-OI dampens innate antiviral immunity in vivo but does not affect the distribution of immune cells in the tumor.
a BALB/c mice were injected subcutaneously with 1 × 105 CT26WT tumor cells. Treatment via intratumoral (i.t.) injections with vehicle (40% CDX) in PBS or with 4-OI (25 mg/kg/dose) in 40% CDX in PBS for 24 h prior challenge with VSVΔ51 expressing firefly luciferase (108 PFU) was given as indicated by arrows. Mice were euthanized seven days after the first VSVΔ51 injection for analysis. b Mean ( ± SEM) tumor growth of the groups followed the start of the treatment regimen (n = 3 in the CDX-PBS group; n = 5 in the CDX-4-OI/PBS group, n = 6 in CDX-VSV and CDX-4-OI/VSV groups). Statistics on tumor volumes at day 8 indicate significance by one-way ANOVA followed by Šídák’s multiple comparisons test on tumor sizes at day 8. c Relative expression analyzed by RT-qPCR of RNA isolated from bulk tumor samples. n = 3 in the CDX-PBS group; n = 5 in the CDX-4-OI/PBS group, n = 6 in CDX-VSV and n = 4 CDX-4-OI/VSV groups (two samples excluded due to insufficient tumor material) d Flow cytometry data indicating the distribution of main T-cell populations within tumors upon different treatments analyzed by manual gating in FlowJo software. Mean ± SEM is displayed and compared per treatment group. Each data point represents one animal. n = 3 in the CDX-PBS group; n = 5 in the CDX-4-OI/PBS group, n = 5 in CDX-VSV (one sample lost during acquisition), and n = 6 CDX-4-OI/VSV groups. e Expression intensity profile of myeloid markers on clustered live, CD45+, CD3− cells from merged samples (n = 60, 3 different organs) to distinguish the regional expression of single myeloid markers. Relative expression is indicated by color where red indicates high expression and blue represents no expression within the cluster. f Opt-SNE cluster plots of live, CD45+, CD3− cells from indicated organs and treatment group (n = 3 in the CDX-PBS group; n = 5 in the CDX-4-OI/PBS group, n = 6 in CDX-VSV and CDX-4-OI/VSV groups). Cell density is indicated by color where red indicates high density and blue indicates low density within the cluster. Analysis generated using OMIQ software. (a) was created using BioRender.com. Source data are provided as a Source Data file.
Fig. 7
Fig. 7. MAVS modification by 4-OI suppresses antiviral immunity.
a HEK293 cells pretreated with increasing 4-OI concentrations (75 and 125 μM) and transfected with GFP-tagged plasmids. Immunoblotting analyzes antiviral proteins. b, c Data from Runtsch et al.. THP1 cells treated with 4-OI (125 μM), prior challenge with IA-DTB, cell lysis, and measurement of modified cysteines by LC-MS. d 786-O cells treated with 125 μM of 4-OI-alk (4 or 24 h) with or without 4-OI (125 μM), followed by click chemistry and biotin enrichment. Samples before and after enrichment analyzed by anti-MAVS immunoblotting. e HEK293 cells pretreated or not with 4-OI (125 μM) and transfected with Flag-tagged MAVS together with GFP-tagged RIG-I or TBK1 as indicated. Whole-cell extracts prepared and immunoprecipitated with anti-Flag antibody M2; immunoprecipitated complexes or 5% input run on SDS-PAGE and probed with anti-GFP/anti-Flag antibodies. f, g Transient MAVS KO 786-O cells treated with 4-OI, then infected with VSVΔ51, analyzed by Western blot (f) and flow cytometry (g). h HEK293 cells transfected with a plasmid encoding Flag-tagged MAVS wt or mutant Flag-tagged MAVS C283A for 24 h. Subsequently, cells treated with 125 μM of alkynated 4-OI (4-OI-alk) for 4 h, followed by click chemistry and biotin enrichment. Samples before and after enrichment analyzed by anti-Flag immunoblotting. i HEK293 cells stimulated with 4-OI prior to transfection with MAVS wt or mutant C283A MAVS, analyzed by ISRE promoter luciferase activity. j HEK293 cells transfected with MAVS wt or mutant together with TBK1, treated with 4-OI, analyzed by immunoprecipitation and immunoblotting. Data from one representative experiment in (a), three independent experiments in (b, c), one representative experiment performed three times in (d), one experiment in (e, h, j). Data from one representative experiment out of two in (f). Data depicted as means ± SEM from two independent experiments performed in triplicates and quadruplicates in (g), two independent experiments in triplicates in (I). Statistical significance by one-way ANOVA for (g) and two-way ANOVA for (I). Vertical stacks of bands are not derived from the same membrane in (a, e, f, j). Source data provided in Source Data file.
Fig. 8
Fig. 8. 4-OI suppresses NF-κB activation via direct alkylation of IKKβ.
a CiiiDER analysis to identify overrepresented transcription factor binding sites in 786-O cells treated or not with 4-OI (75 µM) prior VSVΔ51 (MOI 0.01 for 17 h). b, c Confocal microscopy of p65 nuclear translocation in 786-O cells treated or not with 4-OI following VSVΔ51 (Scale, 20 μm) (b); IL-6 levels measured by ELISA (c). d, e Data from Runtsch et al.. THP1 cells treated with 4-OI following IA-DTB, cell lysis, and LC-MS measurements of modified cysteines. f 786-O cells upon 4-OI-alk with or without 4-OI (both 125 µM). Immunoblotting of IKKβ, IKKγ, and IKKε before and after biotin enrichment. g Illustration of 4-OI binding (green) to IKKβ at Cys179 (left) and 2D ligand-protein interactions (right). Lipophilicity protein surface: lipophilic (cyan), hydrophilic (violet), neutral (white), α-helices (cyan), β-sheets (yellow), loops (cyan). h Luciferase NF-kB promotor activity in control and NRF2 KO 786-O treated or not with 4-OI prior to control (pc) or IKKβ plasmid transfection. i Immunoblotting of IKKα/β, IκBα, and P65 phosphorylation in 786-O cells treated or not with 4-OI prior VSVΔ51. j, k IKKβ KO 786-O cells treated or not with 4-OI following VSVΔ51, immunoblotting (j) and flow (k) analyses. l Luciferase assay of NF-κB promotor activity in HEK293 cells stimulated or not with 4-OI prior to IKKβ wt or IKKβ C179A plasmid transfection. Data from one representative experiment in (a), two independent experiments in (b). Data are depicted as means ± SEM from two experiments in triplicates in (c), three independent experiments in (d, e). Data from one representative experiment out of three in (f). Data are depicted as means from one experiment in duplicates in (h). Data from one representative experiment performed twice in (I, j). Data are the means ± SEM from two experiments performed in quadruplicates in (k). Data are the means ± SEM from two experiments in triplicates in (l). Statistical significance by two-way ANOVA for (c, l) and one-way ANOVA for (k). Vertical stacks of bands are not derived from the same membrane in (f, i, j). Source data are provided in Source Data file.

Similar articles

Cited by

References

    1. Swift, S. L. & Stojdl, D. F. Big data offers novel insights for oncolytic virus immunotherapy. Viruses8, 45 (2016). - PMC - PubMed
    1. Macedo, N., Miller, D. M., Haq, R. & Kaufman, H. L. Clinical landscape of oncolytic virus research in 2020. J. Immunother. Cancer8, e001486 (2020). - PMC - PubMed
    1. Cook, M. & Chauhan, A. Clinical application of oncolytic viruses: a systematic review. Int. J. Mol. Sci.21, 7505 (2020). - PMC - PubMed
    1. Pol, J. G., Workenhe, S. T., Konda, P., Gujar, S. & Kroemer, G. Cytokines in oncolytic virotherapy. Cytokine Growth Factor Rev.56, 4–27 (2020). - PubMed
    1. Twumasi-Boateng, K., Pettigrew, J. L., Kwok, Y. Y. E., Bell, J. C. & Nelson, B. H. Oncolytic viruses as engineering platforms for combination immunotherapy. Nat. Rev. Cancer18, 419–432 (2018). - PubMed

MeSH terms