. 2024 May 15;15(1):4095.
doi: 10.1038/s41467-024-48580-y.

Nuclear actin structure regulates chromatin accessibility

Affiliations

Nuclear actin structure regulates chromatin accessibility

Buer Sen et al. Nat Commun. .

Abstract

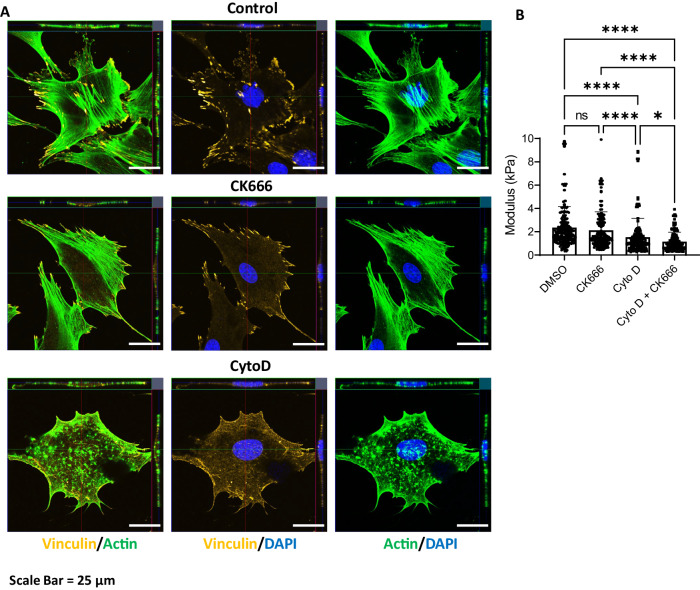
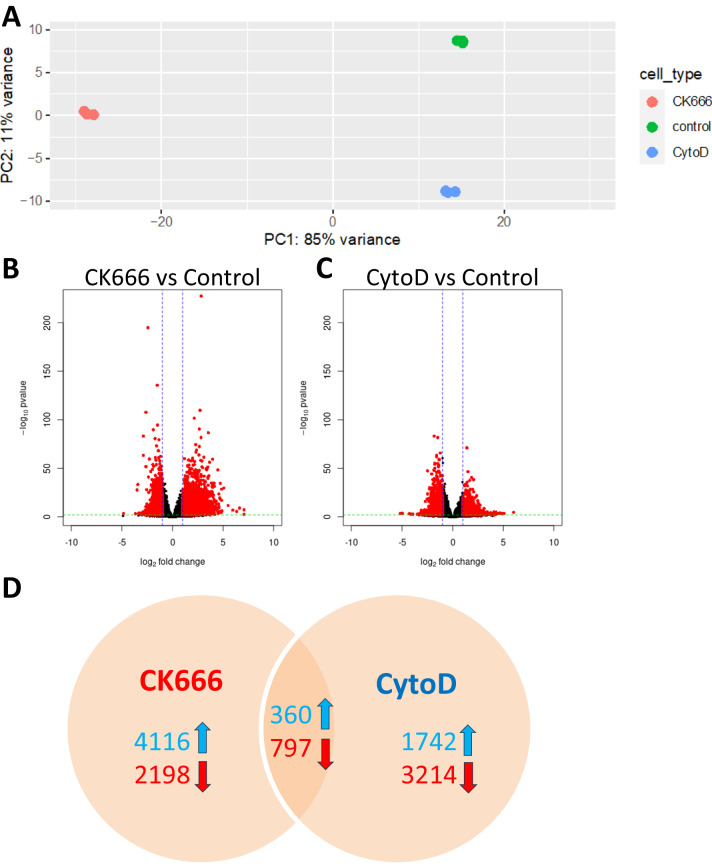
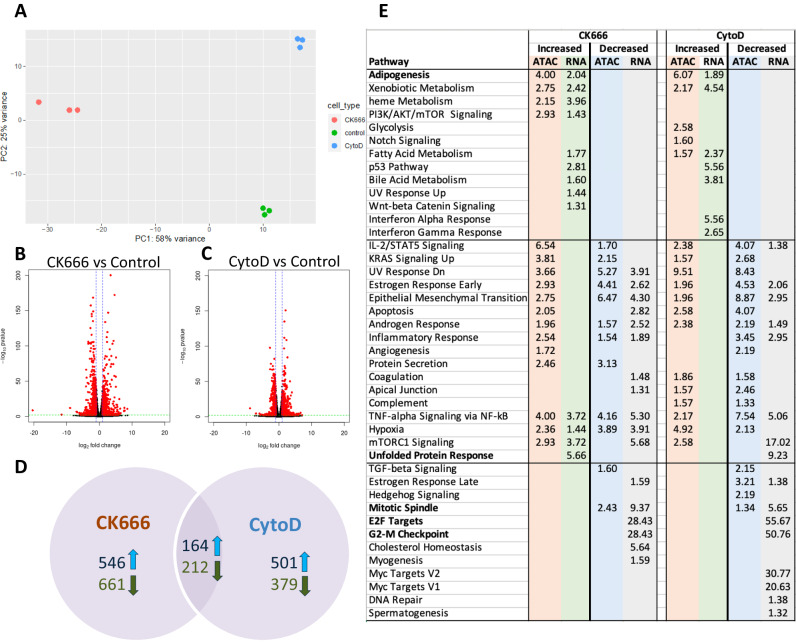
Polymerized β-actin may provide a structural basis for chromatin accessibility and actin transport into the nucleus can guide mesenchymal stem cell (MSC) differentiation. Using MSC, we show that using CK666 to inhibit Arp2/3 directed secondary actin branching results in decreased nuclear actin structure, and significantly alters chromatin access measured with ATACseq at 24 h. The ATAC-seq results due to CK666 are distinct from those caused by cytochalasin D (CytoD), which enhances nuclear actin structure. In addition, nuclear visualization shows Arp2/3 inhibition decreases pericentric H3K9me3 marks. CytoD, alternatively, induces redistribution of H3K27me3 marks centrally. Such alterations in chromatin landscape are consistent with differential gene expression associated with distinctive differentiation patterns. Further, knockdown of the non-enzymatic monomeric actin binding protein, Arp4, leads to extensive chromatin unpacking, but only a modest increase in transcription, indicating an active role for actin-Arp4 in transcription. These data indicate that dynamic actin remodeling can regulate chromatin interactions.


Conflict of interest statement

The authors declare no competing interests.

Figures

Fig. 1
Fig. 1. Actin structure In the nucleus is altered by CK666 and CytoD.
Mouse marrow-derived mesenchymal stem cell (MSC) were treated with CK666 (100 μM) or CytoD (0.1 μg/ml) for 4 h. A, B The cells were stained for Lamin A/C (red) and F-actin (green, phalloidin) and then examined using a model LSM 880 confocal microscope (Zeiss, Thornwood, NY) and (B) visualized using Airyscan. C Cells were transfected with the nuclear actin chromobody and imaged 4 h after treatment as specified. D The cells were stained for Arp3 (yellow, cy5), Lamin A/C (red) and F-actin (green, phalloidin). For images, a random cell in each of 6 HPF was selected for imaging, and representative image shown; scale bar: 25 μm. Imaging was performed in 3 separate experiments. E Nuclear G- and F-actin immunoblot analysis using G/F actin assay kit (Cytoskeleton, Inc.) for control, CK666 and Cyto D-treated MSCs. Data points represent mean densitometry ±SEM relative to vehicle-treated samples for n = 5 biologically independent samples; two way ANOVA with Sidak post-hoc adjusted for multiple comparison,; p = 0.0002 for CK666 and <0.0001 for CytoD. Source data are provided as a Source Data file.
Fig. 2
Fig. 2. Actin connections to nucleus are altered by CK666 and CytoD.
A MSC were treated with CK666 or CytoD same as Fig. 1, and then stained focal adhesion (yellow, cy5), F-actin (green; phalloidin), and nucleus (blue; NucBlue). Images are representative of at least 3 biological repeats; scale bar: 25 μm. B Measurement of cell modulus, data for each condition acquired from 5 measures per each of 60 independent cells and presented as mean ± SEM; one way ANOVA with Tukey post hoc test adjusted for multiple comparisons; between group differences are shown as ****p < 0.0001, *p < 0.05. Source data are provided as a Source Data file.
Fig. 3
Fig. 3. Chromatin accessibility altered by CK666 and CytoD.
A PCA shows CK666 (red) alters chromatin accessibility relatively more than CytoD (blue) when compared to the baseline control state (green). B Addition of CK666 results in more regions with significantly (p < 0.01; DESeq2 Wald test; adjusted using Benjamini-Hochberg correction) increased accessibility with greater magnitudes than regions with decreased accessibility. C Addition of CytoD results in more regions with significantly (p < 0.01; DESeq2 Wald test; adjusted using Benjamini-Hochberg correction) decreased accessibility. D Most chromatin changes are unique to a given condition (85% of CK666 regions; 81% of CytoD regions).
Fig. 4
Fig. 4. Gene expression altered relatively less than chromatin by CK666 and CytoD.
A PCA shows CK666 (red) alters gene expression relatively more than CytoD (blue) when compared to the baseline control state (green), similar to chromatin accessibility. B Addition of CK666 results in similar numbers of genes with significantly (p < 0.01; DESeq2 Wald test; adjusted using Benjamini-Hochberg correction) increased and decreased expression and of similar magnitudes. C Addition of CytoD also results in similar numbers of genes with significantly (p < 0.01; DESeq2 Wald test; adjusted using Benjamini-Hochberg correction) increased and decreased expression, but with lower magnitudes than CK666. D The number of differentially expressed genes is less than altered chromatin regions, and relatively more are shared between conditions (24% of CK666 genes; 30% of CytoD genes). E Pathway enrichment for genes near differentially accessible chromatin (ATAC) and differentially expressed genes (RNA). Values are −log10 (adjusted p value of enrichment). See also Supplementary Fig. 1 which shows that CK666 induces adipogenesis at 3 days, while CytoD induces an osteoblast phenotype.
Fig. 5
Fig. 5. Histone mark locations change with alterations in nuclear actin structure.
The cells were treated with/without CK666 or CytoD for 4 h. A The cells stained for H3K9me3 and foci counted for heterochromatin called as “K9foci”, data for each condition was acquired from 50 independent cells and presented as mean ± SEM; one way ANOVA with Tukey post hoc test adjusted for multiple comparisons, between group differences are shown if p < 0.0001. B K9foci redistributed with CK666 to inner nuclear region; data acquired from 50 independent cells for each condition and presented as mean ± SEM, two-tailed t-test with p < 0.0001. C The cells were stained for H3K27me3. D H3K9me3 distribution in nucleus, data for each condition was acquired from 28 independent cells and presented as mean ± SEM; one way ANOVA with Tukey post hoc test adjusted for multiple comparisons, between group differences are shown if p < 0.0001. E Total H3K9me3 and H3K9me3 protein level was measured by Western blot; data points represent mean densitometry, relative to vehicle-treated samples for n = 3 biologically independent samples are presented as mean ± SEM, between group differences were not significant. Source data are provided as a Source Data file.
Fig. 6
Fig. 6. Knockdown of Arp4 changes nuclear structure and prevents adipogenesis.
The cells were stained for Arp4 (yellow, cy5), F-actin (green, phalloidin) and nucleus (blue; NucBlue). A The cells were treated with/without CK666 or CytoD for 4 h. B Arp4 was knocked-down and treated with/without CK666. For images (A, B), 6 HPF were imaged, and representative image shown; scale bar: 25 μm. Imaging was performed in 3 separate experiments. C K9foci counted; data for each condition was acquired from 28 independent cells and presented mean ± SEM; two way ANOVA with Tukey post hoc test adjusted for multiple comparisons shows group differences, ***p < 0.0001, **p = 0.003. D, E Arp4 was knocked-down and the cells treated with/without CK666 or A medium for 3 days. Western blot for Arp4, aP2 and Apn. Source data are provided as a Source Data file.
Fig. 7
Fig. 7. Arp4 knockdown affects chromatin accessibility more than transcription.
A PCA of ATAC-seq data (B, C) Volcano plots of ATAC-seq data (DESeq2 Wald test; p values adjusted using Benjamini-Hochberg correction) (D) Overlaps of ATAC-seq data (E) PCA of RNA-seq data (F, G) Volcano plots of RNA-seq data (DESeq2 Wald test; p values adjusted using Benjamini-Hochberg correction) (H) Overlaps of RNA-seq data (I) Combined pathway analysis.

References

    1. Sen B, et al. mTORC2 regulates mechanically induced cytoskeletal reorganization and lineage selection in marrow-derived mesenchymal stem cells. J. Bone Miner. Res. 2014;29:78–89. doi: 10.1002/jbmr.2031. - DOI - PMC - PubMed
    1. Soto, J. et al. Reduction of intracellular tension and cell adhesion promotes open chromatin structure and enhances cell reprogramming. Adv. Sci.10, e2300152 (2023). - PMC - PubMed
    1. Dopie J, Skarp KP, Rajakyla EK, Tanhuanpaa K, Vartiainen MK. Active maintenance of nuclear actin by importin 9 supports transcription. Proc. Natl Acad. Sci. USA. 2012;109:E544–E552. doi: 10.1073/pnas.1118880109. - DOI - PMC - PubMed
    1. Sen, B. et al. Mechanically induced nuclear shuttling of beta-catenin requires co-transfer of actin. Stem Cells40, 423–434 (2022). - PMC - PubMed
    1. Sen B, et al. Intranuclear actin regulates osteogenesis. Stem Cells. 2015;33:3065–3076. doi: 10.1002/stem.2090. - DOI - PMC - PubMed

MeSH terms