. 2024 May 15;14(1):11174.
doi: 10.1038/s41598-024-61337-3.

Jnk1 and downstream signalling hubs regulate anxiety-like behaviours in a zebrafish larvae phenotypic screen

Affiliations

Jnk1 and downstream signalling hubs regulate anxiety-like behaviours in a zebrafish larvae phenotypic screen

Ye Hong et al. Sci Rep. .

Abstract

Current treatments for anxiety and depression show limited efficacy in many patients, indicating the need for further research into the underlying mechanisms. JNK1 has been shown to regulate anxiety- and depressive-like behaviours in mice, however the effectors downstream of JNK1 are not known. Here we compare the phosphoproteomes from wild-type and Jnk1-/- mouse brains and identify JNK1-regulated signalling hubs. We next employ a zebrafish (Danio rerio) larvae behavioural assay to identify an antidepressant- and anxiolytic-like (AA) phenotype based on 2759 measured stereotypic responses to clinically proven antidepressant and anxiolytic (AA) drugs. Employing machine learning, we classify an AA phenotype from extracted features measured during and after a startle battery in fish exposed to AA drugs. Using this classifier, we demonstrate that structurally independent JNK inhibitors replicate the AA phenotype with high accuracy, consistent with findings in mice. Furthermore, pharmacological targeting of JNK1-regulated signalling hubs identifies AKT, GSK-3, 14-3-3 ζ/ε and PKCε as downstream hubs that phenocopy clinically proven AA drugs. This study identifies AKT and related signalling molecules as mediators of JNK1-regulated antidepressant- and anxiolytic-like behaviours. Moreover, the assay shows promise for early phase screening of compounds with anti-stress-axis properties and for mode of action analysis.


Conflict of interest statement

The authors declare no competing interests.

Figures

Figure 1
Figure 1
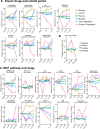
Motility profiles for anxiolytic and antidepressant drugs. (A) A schematic of experimental setup shows the apparatus, square-well plate and representative motility traces from 1 min tests from larvae treated with MK801. (B) Motility responses from zebrafish larvae at 3 to 8 days post fertilization (dpf) during the 1 min startle battery. (C) Mean motility data of zebrafish larvae at 3–8 dpf. Larvae number per age group; 3 dpf (n = 95), 4 dpf (n = 94), 5 dpf (n = 94), 6 dpf (n = 89), 7 dpf (n = 89) and 8 dpf (n = 97). (D) Example traces from the entire test battery showing mean motility of 7 dpf fish. 60 min acclimation is followed by 5 cycles (C1 to C5) of 1 min startle period with 29 min recovery between cycles. Measurements are from larvae treated with or without fluoxetine (0.1, 1.0, or 10 µM) for 1 h (n = 22 to 24). (E) A trace of 1 min startle response shows motility of fish treated with high doses of ketamine or MK801 (C = 48, MK801 = 23, Ketamine = 23). (F-K) Motility responses are shown for AA drugs according to stimuli clusters P1 to P6. The left-side panels depict the overall mean motility during the 5 cycles of 1 min startle. The right-side panels show the mean motility data within the peaks only. Y-axis scaling differs to accommodate various size effects. One-way ANOVA with post-hoc Tukey test was performed on the original MI distributions to calculate the p-values of the left-side panels; Two-way ANOVA with post-hoc Dunnett test was performed on the original MI distributions to calculate the p-values of the right-side panels. *p-value ≤ 0.05; **p-value* ≤ 0.01; ***p-value ≤ 0.001; ****p-value ≤ 0.0001. The number of fish measured for each treatment were as follows (the total number of repeats is shown in parenthesis): control: 146 (730 observations), diazepam: 70 (337 observations), fluoxetine: 72 (338 observations), imipramine: 69 (335 observations), LiCl: 41 (210 observations), haloperidol: 51 (220 observations), ketamine: 70 (350 observations), MK801: 70 (350 observations).
Figure 2
Figure 2
Testing the effect of AA drugs on zebrafish larvae behavioural sequalae during the 1 min startle phase. (A) The behavioural features extracted from zebrafish larvae tracking are shown. Distance, turning, pausing, spurting, time and distance thigmotaxis are extracted using R statistical computing platform. (B) Fish were exposed to AA drugs and ketamine, MK801 or haloperidol as indicated and features (distance, turning, pausing, spurting, time and distance thigmotaxis) were extracted from the entire 1 min startle period. Averaged data indicates change relative to control for each of these behaviours according to colour code. (C) Mean motility profiles of zebrafish larvae (5 dpf) before and after E3 (n = 24) or NaCl (100 mM, n = 24) are shown. (D) Mean distance travelled, turning, pausing, and spurting of zebrafish larvae (5 dpf) before and during the 10 min after 100 mM NaCl (n = 72) or control (n = 67), are plotted as a % change from control. (E) Zebrafish treated with E3 medium or NaCl as indicated underwent the battery test. Mean data on distance travelled, turning, pausing and spurting are shown. Control: 15 (75 observations), NaCl: 32 (156 observations). P-values were calculated by Wilcoxon Rank Sum test and adjusted with Benjamini–Hochberg procedure, where * p-value ≤ 0.05; ** p-value * ≤ 0.01; ***p-value ≤ 0.001; ****p-value ≤ 0.0001.
Figure 3
Figure 3
Identification of signalling hubs downstream of JNK1 in mouse brain. (A) JNK1 regulated phosphoproteins from Jnk1-/- mouse brain are organised in a large outer circle with connections to the predicted interacting proteins in the centre. Warmer colours indicate a larger number of physical interactions, red being the highest. (B) Signalling hubs derived from the Jnk1-/- mouse brain phosphoproteome (labelled using gene names) represent the most highly connected phosphoproteins from among all phosphoproteins that are significantly altered in Jnk1-/- brain verses wild-type. For each hub, the distribution of physical interaction count from the 1000 background networks is represented with a boxplot. The number of physical interactions for the same hub in the Jnk1-/- mouse brain phosphoproteome (i.e. the phosphoproteins that are significantly altered in Jnk1-/- mouse brain phosphoproteome), is depicted with a red cross. The most highly ranked JNK1-regulated signalling hubs are shown.
Figure 4
Figure 4
Testing the effect of JNK1 pathway hub drugs on zebrafish larvae behaviour during the startle period. (A) Zebrafish behaviours are shown during the 1 min startle period following treatment with pharmacological inhibitors or activators of JNK and downstream signalling hubs. As above, drug treatments were for 1 h before exposure to the startle battery. Mean distance, turning, pausing, spurting, time and distance thigmotaxis are shown for the following numbers of fish measurements (5 cycles per zebrafish larvae) SP600125: 224, JNK-IN-8: 346, R18: 354, SC79: 318, AKTi: 360, SB216763: 358, SB590885: 206, FR236924: 360, PMA: 115, BIM: 216, bryostatin-1: 359. P-values were calculated by Wilcoxon Rank Sum test and adjusted with Benjamini–Hochberg procedure and are indicated as follows *p-value ≤ 0.05; **p-value * ≤ 0.01; ***p-value ≤ 0.001; ****p-value ≤ 0.0001.
Figure 5
Figure 5
Testing the effect of AA drugs and JNK1 pathway hub drugs on zebrafish larvae behaviour during the post-startle period. (A) Fish were exposed to AA drugs and ketamine or MK801 doses as indicated and new features (distance, turning, pausing, spurting, time and distance thigmotaxis) were extracted from the first 10 min following the 1 min startle period. Averaged data from the following fish measurement numbers: diazepam: 337, fluoxetine: 338, imipramine: 335, LiCl: 210, ketamine: 325, MK801: 323 or haloperidol: 255 are shown. P-values were calculated by Wilcoxon Rank Sum test and adjusted with Benjamini–Hochberg procedure and are indicated as follows: *p-value ≤ 0.05; **p-value * ≤ 0.01; ***p-value ≤ 0.001; ****p-value ≤ 0.0001. (B) Mean distance, turning, pausing and spurting during the first 10 min following 100 mM NaCl was measured. The number of fish per group were as follows: control/E3 = 47, NaCl = 47. (C) Zebrafish behaviours during the 10 min following the 1 min startle period are shown with or without treatment with pharmacological inhibitors or activators of JNK and downstream signalling hubs. As above, drug treatments were for 1 h before exposure to the startle battery. Mean distance, turning, pausing, spurting, time and distance thigmotaxis are shown for the following numbers of fish measurements (from 5 cycles per zebrafish larva): JNK-IN-8: 360, SP600125: 224, haloperidol: 220, SB216763: 358, FR236924: 360, R18: 354, SC79: 318, BIM: 216, PMA: 115, SB590885: 206, bryostatin-1: 359, AKTi: 360. P-values were calculated by Wilcoxon Rank Sum test and adjusted with Benjamini–Hochberg procedure and are indicated as follows *p-value ≤ 0.05; **p-value * ≤ 0.01; ***p-value ≤ 0.001; ****p-value ≤ 0.0001.
Figure 6
Figure 6
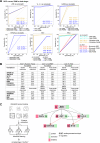
Machine learning predicts compounds with high sensitivity and specificity for generating an AA phenotype. (A) ROC curves show the Support Vector Machine (SVM) results for JNK pathway hub compounds to predict an “AA” or “other” phenotype during the Startle Response Behaviour (SRB) and the Post Startle Response Behaviour (PSRB). The number of fish measurements used for testing the machine learning models were JNK-IN-8: 346, SP600125: 224, haloperidol: 220, SB216763: 358, FR236924: 360, R18: 354, SC79: 318, BIM: 216, PMA: 115, SB590885: 206, Bryostatin-1: 359, AKTi: 360. (B) A table summary of the area under the curve (AUC) values from Random Forest, Glmnet and SVM machine learning models are shown. Bold: Ranked highest overall taken from highest score across all machine learning approaches. The number of zebrafish tracks used for ML model training for the SRB class label “AA” were- diazepam: 350, fluoxetine: 335, imipramine: 343, LiCl: 210, and for class label “other”–ketamine: 349 and MK801: fish. During the post-startle response behaviour (PSRB) were as follows: class label “antidepressant or anxiolytic”–diazepam: 337, fluoxetine: 338, imipramine: 335, LiCl: 210; class label “other”–ketamine: 325 and MK801: 323. (C) A schematic summary of the zebrafish larvae behaviour screen for AA phenotype is shown. Beside it is a summary of results obtained using this test to evaluate the effect of JNK1 pathway hub drugs on AA-like behaviour.

Similar articles

References

    1. Giacobbe P, Flint A. Diagnosis and Management of Anxiety Disorders. Continuum (Minneap Minn) 2018;24:893–919. doi: 10.1212/CON.0000000000000607. - DOI - PubMed
    1. Penninx BW, Pine DS, Holmes EA, Reif A. Anxiety disorders. Lancet. 2021;397:914–927. doi: 10.1016/S0140-6736(21)00359-7. - DOI - PMC - PubMed
    1. GMD Collaborators Global, regional, and national burden of 12 mental disorders in 204 countries and territories, 1990–2019: A systematic analysis for the global burden of disease study 2019. Lancet Psychiatry. 2022;9:137–150. doi: 10.1016/S2215-0366(21)00395-3. - DOI - PMC - PubMed
    1. GD Collaborators Global burden of 369 diseases and injuries in 204 countries and territories, 1990–2019: A systematic analysis for the global burden of disease study 2019. Lancet. 2020;396:1204–1222. doi: 10.1016/S0140-6736(20)30925-9. - DOI - PMC - PubMed
    1. Nemeroff CB. The state of our understanding of the pathophysiology and optimal treatment of depression: Glass half full or half empty? Am. J. Psychiatry. 2020;177:671–685. doi: 10.1176/appi.ajp.2020.20060845. - DOI - PubMed

MeSH terms