. 2024 Jun;11(6):1615-1629.
doi: 10.1002/acn3.52079. Epub 2024 May 15.

Emerging variants, unique phenotypes, and transcriptomic signatures: an integrated study of COASY-associated diseases

Affiliations

Emerging variants, unique phenotypes, and transcriptomic signatures: an integrated study of COASY-associated diseases

Chiara Cavestro et al. Ann Clin Transl Neurol. 2024 Jun.

Abstract

Objective: COASY, the gene encoding the bifunctional enzyme CoA synthase, which catalyzes the last two reactions of cellular de novo coenzyme A (CoA) biosynthesis, has been linked to two exceedingly rare autosomal recessive disorders, such as COASY protein-associated neurodegeneration (CoPAN), a form of neurodegeneration with brain iron accumulation (NBIA), and pontocerebellar hypoplasia type 12 (PCH12). We aimed to expand the phenotypic spectrum and gain insights into the pathogenesis of COASY-related disorders.

Methods: Patients were identified through targeted or exome sequencing. To unravel the molecular mechanisms of disease, RNA sequencing, bioenergetic analysis, and quantification of critical proteins were performed on fibroblasts.

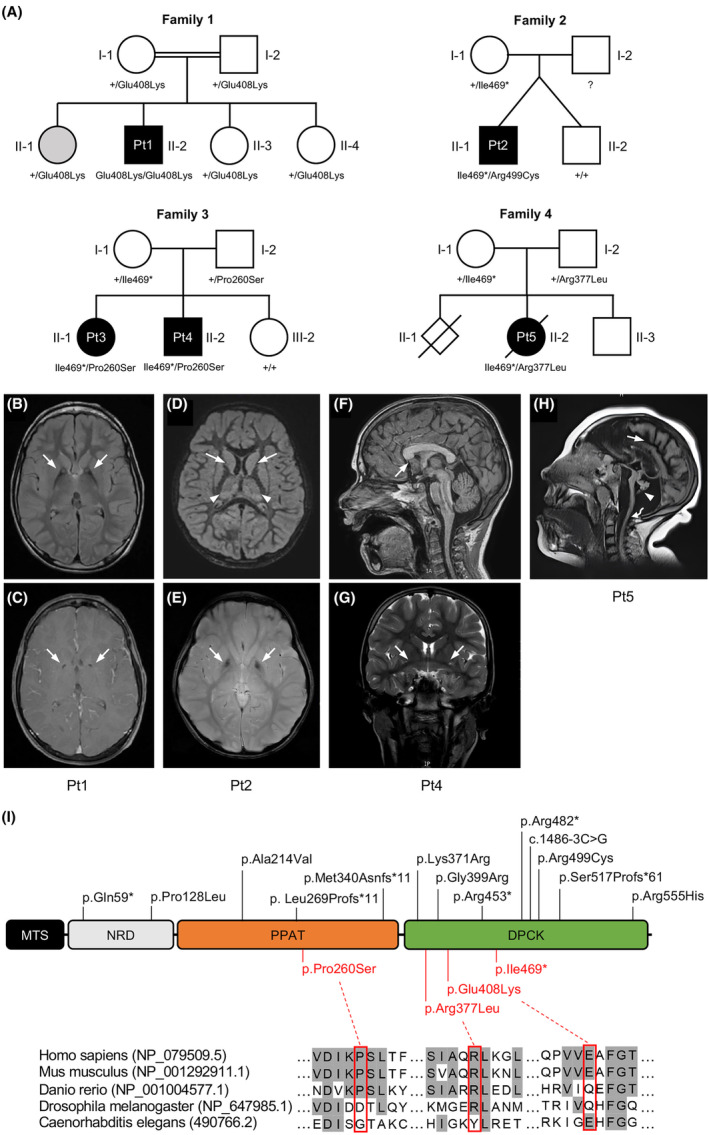
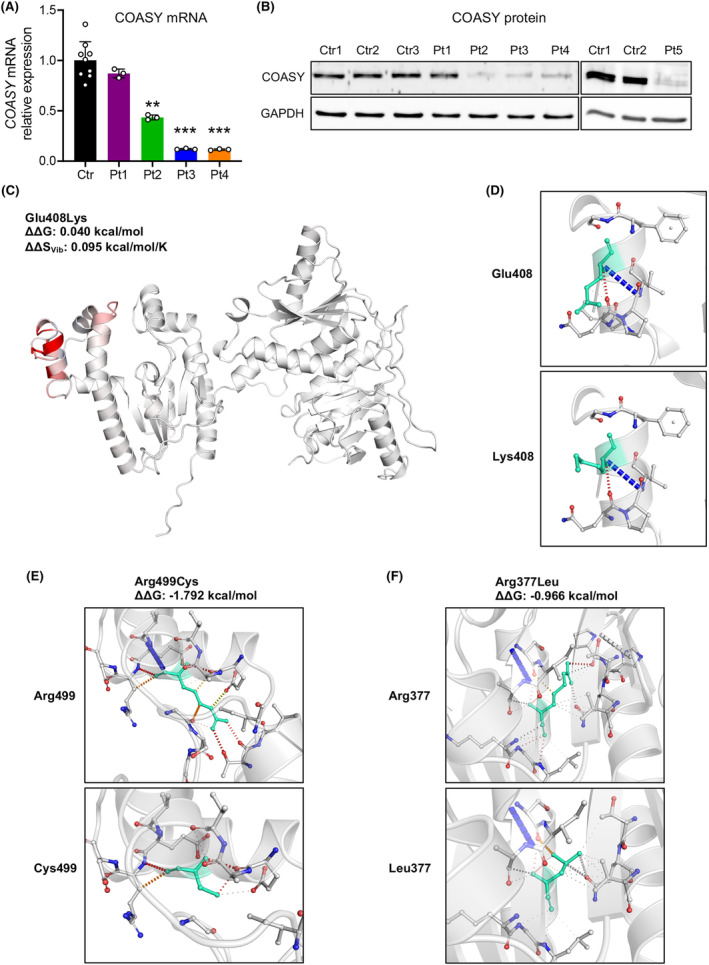
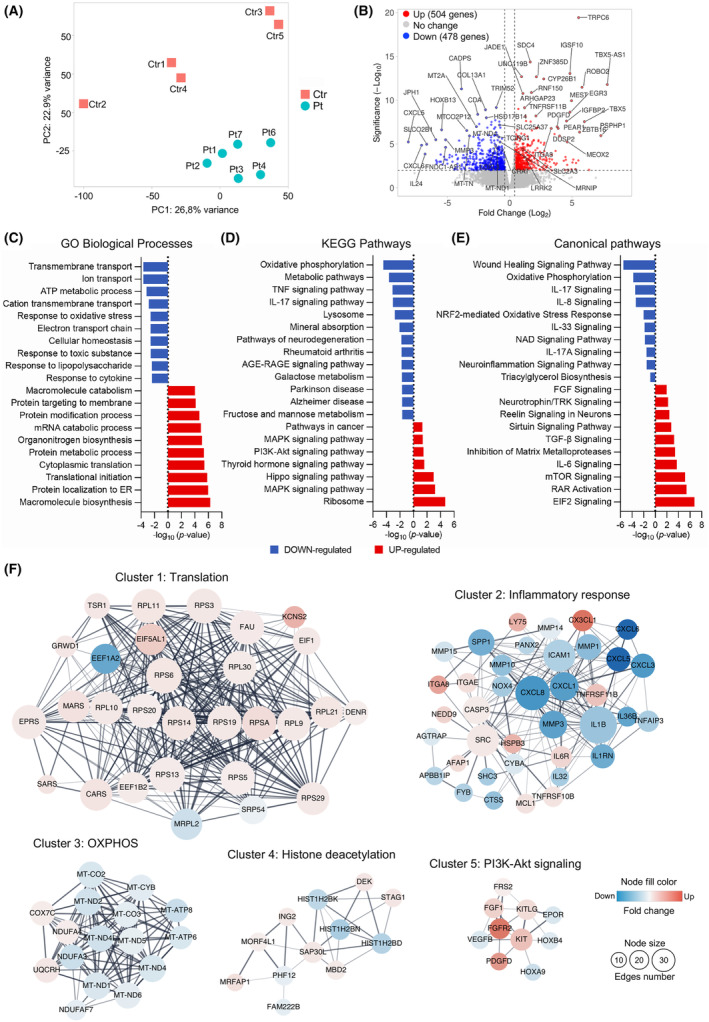
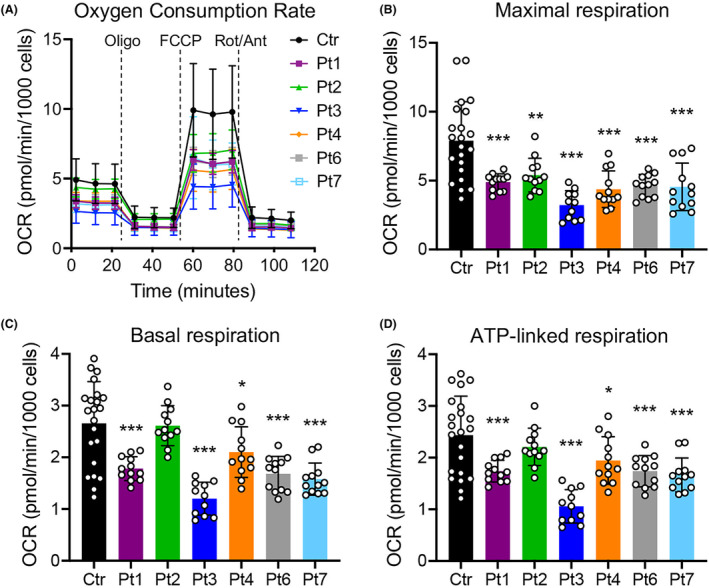
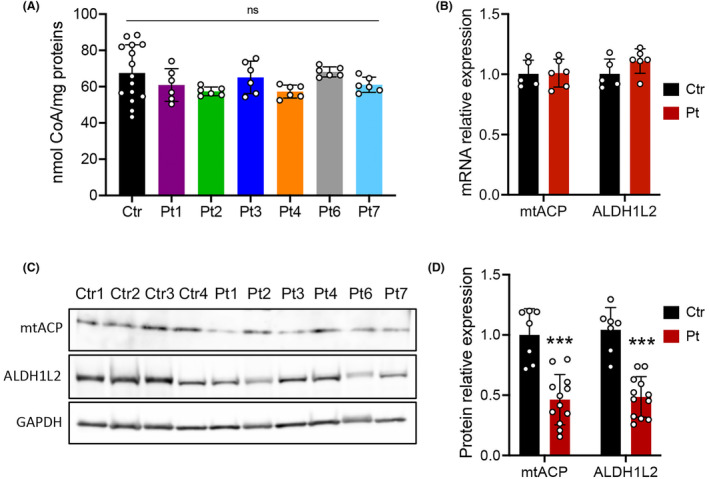
Results: We identified five new individuals harboring novel COASY variants. While one case exhibited classical CoPAN features, the others displayed atypical symptoms such as deafness, language and autism spectrum disorders, brain atrophy, and microcephaly. All patients experienced epilepsy, highlighting its potential frequency in COASY-related disorders. Fibroblast transcriptomic profiling unveiled dysregulated expression in genes associated with mitochondrial respiration, responses to oxidative stress, transmembrane transport, various cellular signaling pathways, and protein translation, modification, and trafficking. Bioenergetic analysis revealed impaired mitochondrial oxygen consumption in COASY fibroblasts. Despite comparable total CoA levels to control cells, the amounts of mitochondrial 4'-phosphopantetheinylated proteins were significantly reduced in COASY patients.

Interpretation: These results not only extend the clinical phenotype associated with COASY variants but also suggest a continuum between CoPAN and PCH12. The intricate interplay of altered cellular processes and signaling pathways provides valuable insights for further research into the pathogenesis of COASY-associated diseases.


Conflict of interest statement

The authors declare no conflict of interest.

Figures

Figure 1
Figure 1
Genetics and MRI of subjects affected by variants in COASY. (A) Pedigree of the four families showing the segregation of alleles. The variants status of affected and unaffected subjects is indicated by black and white symbols, respectively. Gray color in subject II‐1 from family 1 indicates an individual affected by Friedreich's Ataxia, but heterozygous for COASY variant. Genotype of subject I‐2 from family 2 is not available. (B–H) Brain MRI of affected subjects. (B) Bilateral T2 hyperintensity within the anteromedial region (arrows), and (C) small round area of T1 hypointensity in the center of the globus pallidus (arrows) in Pt1 at the age of 12 years. (D) T2‐weighted FLAIR hyperintensities within the bilateral basal ganglia and thalamic nuclei (arrows), and (E) T1 hypointensity in the center of the globus pallidus (arrows) in Pt2 at the age of 3 years. (F) MRI showing rostrum of the corpus callosum agenesis (arrow) and (G) prominent anterior commissure (arrows) in sagittal T1‐weighted and coronal T2‐weighted MRI, respectively, from Pt4 at 10 years old. (H) Sagittal T2‐weighted FLAIR from Pt5 at 5 years old showing a massive cerebral atrophy (arrow), marked cerebellum and pons atrophy (arrowhead), and significant trunk atrophy (curved arrow). (I) Schematic representation of COASY protein with functional regions, novel variants identified in this study (red), and already reported variants (black). DPCK, dephospho‐CoA kinase; MTS, mitochondrial targeting sequence; NRD, N‐terminus regulatory domain; PPAT, 4′‐phosphopantetheine adenylyltransferase. Amino acid sequence alignment showing conservation degree of novel missense variants across species.
Figure 2
Figure 2
Effects of identified variants. (A) qPCR analysis showing relative COASY mRNA expression in control (Ctr, n = 3) and patients (Pt) fibroblasts. Mean of three independent experiments ± SD is shown. **p < 0.01; ***p < 0.001 (one‐way ANOVA). (B) Immunoblot analysis of COASY protein in fibroblast from controls (Ctr) and patients (Pt). An antibody against GAPDH was used as control. (C) Changes in vibrational entropy energy caused by Glu408Lys variant. Red portion represents a gain in flexibility upon mutation. The predicted change in free energy (ΔΔG) and vibrational entropy (ΔΔSVib) is shown. (D–F) Analysis of contact mediated by residues around mutation sites for (D) Glu408Lys, (E) Arg499Cys, and (F) Arg377Leu. Wild‐type (up) and variant (down) residues are colored in turquoise. H‐bonds are shown in red, Van der Waals (VdW) contacts in gray, hydrophobic‐VdW clashes in green, and polar‐VdW clashes in orange.
Figure 3
Figure 3
Transcriptomic analysis in fibroblasts. (A) Principal component analysis (PCA) plot of RNA‐seq data, showing clear separation of patient‐derived fibroblast (turquoise) from controls (red). The two axes PC1 and PC2 represent the first two principal components identified by the analysis. (B) Volcano plots of the calculated DEGs. The number of the up‐regulated (red) and down‐regulated (blue) is indicated for log2FC >1 and p‐value <0.001. Top 50 DEGs are highlighted. (C–E) Selection of the most significantly enriched (C) GO biological process, (D) KEGG pathways, and (E) canonical pathways of DEGs, expressed as −log10 (p‐value). Down‐ and up‐regulated processes and pathways are colored in blue and red, respectively. (F) Results of protein–protein interaction (PPI) network analysis of common DEGs. The five top‐scored clusters. Red circles represent up‐regulated genes, and blue circles represent down‐regulated genes. The color depth represents the fold change of hub genes. The size of the nodes indicates the connections number of each gene.
Figure 4
Figure 4
Respiration profile of COASY mutated fibroblasts. (A) OCR of fibroblasts, expressed as pmoles O2/min/1000 cells, under basal conditions and after injection of oligomycin (Oligo), carbonyl cyanide 4‐(trifluoromethoxy) phenylhydrazone (FCCP), rotenone (Rot) and antimycin A (Ant). Data are shown as mean ± SD of three control lines (Ctr, n = 22) and patients' cells (Pt, n = 12). (B–D) Maximal (B), basal (C), and ATP‐linked (D) respiration were calculated from OCR traces and are reported in the graphs as mean ± SD. *p < 0.05; **p < 0.01; ***p < 0.001 (one‐way ANOVA).
Figure 5
Figure 5
Analysis of CoA and mitochondrial 4′‐phosphopantetheinyl proteins in COASY mutated fibroblasts. (A) Total cellular CoA measured in three control lines (Ctr, n = 15) and patients (Pt, n = 6) fibroblasts expressed as nmol/mg of proteins. Data are shown as mean ± SD. *p < 0.05; **p < 0.01; ***p < 0.001 (one‐way ANOVA). (B) Relative amount of mtACP and ALDH1L2 transcripts assessed by qPCR. (C) Representative immunoblot and (D) densitometric quantification of mtACP and ALDH1L2 proteins in fibroblast from controls (Ctr) and patients (Pt) derived from two independent experiments. An antibody against GAPDH was used as control. Mean ± SD is shown. ***p < 0.001 (unpaired Student's t‐test).

References

    1. Cavestro C, Diodato D, Tiranti V, Di Meo I. Inherited disorders of coenzyme A biosynthesis: models, mechanisms, and treatments. Int J Mol Sci. 2023;24(6):5951. - PMC - PubMed
    1. Zhyvoloup A, Nemazanyy I, Babich A, et al. Molecular cloning of CoA synthase. The missing link in CoA biosynthesis. J Biol Chem. 2002;277(25):22107‐22110. - PubMed
    1. Zhyvoloup A, Nemazanyy I, Panasyuk G, et al. Subcellular localization and regulation of coenzyme A synthase. J Biol Chem. 2003;278(50):50316‐50321. - PubMed
    1. Nemazanyy I, Panasyuk G, Breus O, Zhyvoloup A, Filonenko V, Gout IT. Identification of a novel CoA synthase isoform, which is primarily expressed in the brain. Biochem Biophys Res Commun. 2006;341(4):995‐1000. - PubMed
    1. Rhee H‐W, Zou P, Udeshi ND, et al. Proteomic mapping of mitochondria in living cells via spatially restricted enzymatic tagging. Science. 2013;339(6125):1328‐1331. - PMC - PubMed