Review
. 2024 May 15;7(1):571.
doi: 10.1038/s42003-024-06264-9.

From pixels to connections: exploring in vitro neuron reconstruction software for network graph generation

Affiliations
Review

From pixels to connections: exploring in vitro neuron reconstruction software for network graph generation

Cassandra Hoffmann et al. Commun Biol. .

Abstract

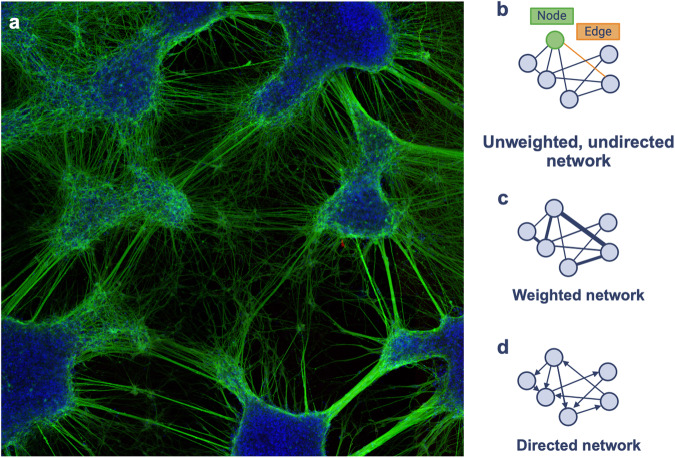
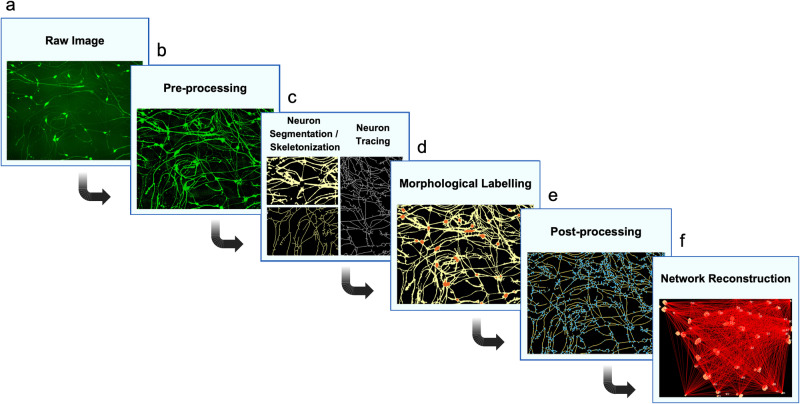
Digital reconstruction has been instrumental in deciphering how in vitro neuron architecture shapes information flow. Emerging approaches reconstruct neural systems as networks with the aim of understanding their organization through graph theory. Computational tools dedicated to this objective build models of nodes and edges based on key cellular features such as somata, axons, and dendrites. Fully automatic implementations of these tools are readily available, but they may also be purpose-built from specialized algorithms in the form of multi-step pipelines. Here we review software tools informing the construction of network models, spanning from noise reduction and segmentation to full network reconstruction. The scope and core specifications of each tool are explicitly defined to assist bench scientists in selecting the most suitable option for their microscopy dataset. Existing tools provide a foundation for complete network reconstruction, however more progress is needed in establishing morphological bases for directed/weighted connectivity and in software validation.


Conflict of interest statement

The authors declare no competing interests.

Figures

Fig. 1
Fig. 1. Neuron connectivity represented through network graphs.
a A confocal microscopy image of stem cell-derived neurons cultured in monolayer format. Neurons immunostained for neuronal marker β-Tubulin III (green) and nuclear dye Hoechst 33342 (blue) exhibit self-organization. b Schematic graph representing neuronal connectivity, comprised of nodes (illustrated in green) and edges (illustrated in orange). An unweighted, undirected graph serves to represent basic relationships between neuronal elements as nodes. c A weighted graph incorporates edge values to confer the strength of internodal relationships. d A directed network incorporates edge orientation to confer the direction of internodal relationships.
Fig. 2
Fig. 2. A schematic pipeline for network reconstruction.
a Workflows begin with the acquisition of neuron images through microscopy. b Pre-processing techniques aim to improve image signal-to-noise ratio and reduce ambiguities. c Segmentation creates a mask of neuron morphology (top left of panel), which can be skeletonized (bottom left of panel). Tracing creates a tree of neuron centrelines (right half of panel). d Morphological labelling resolves the neuron mask into features such as somata (orange) and neurites (yellow). e Post-processing methods refine or extract features, such as branch points (blue) from the neuron skeleton (yellow). f Network reconstruction creates a model representing morphological features as nodes and their relationships as edges.
Fig. 3
Fig. 3. Examples of neuron segmentation tool interfaces.
a WIS-Neuromath graphical user interface with output depicting segmentation of individuated neurons, implemented in MATLAB. b NeuriteQuant interface with stages of neuron reconstruction from raw image to somata/neurite segmentation (CC BY 2.0), implemented in Fiji (GNU General Public Licence). c GAIN graphical user interface with output depicting segmentation of individuated neurons, implemented in MATLAB. Neuron microscopy image utilized as input for tools sourced from Cell Image Library (CC BY 3.0).
Fig. 4
Fig. 4. Available network reconstruction software.
a Spatial network reconstructions by cytoNet. Type I networks establish connections (yellow line) between cells (bordered in cyan) that touch when dilated. Type II networks establish connections (yellow line) between cells based on whether the distance between their nuclei (bordered in red) falls below a defined threshold. Image adapted from ref. and modified (CC BY 4.0). b ExplantAnalyzer network reconstruction of spiral ganglion explant neurites (stained with β-Tubulin III and DAPI, scale bar: 1 mm). A pruned graph structure is created by finding the shortest path from each neurite end point depicted in green to the explant body attachment point depicted in red. Edges not part of any shortest paths are removed from the final tree. Figure adapted from ref. and modified (CC BY 4.0). c An example workflow of the network reconstruction tool developed by refs. ,. An input brightfield image of poor quality is morphologically labelled by yolov3; blue boxes are neuron somata, yellow box is a neuron somata cluster. After segmentation, a preliminary network is reconstructed with red nodes (branch and end points), blue edges, and yellow underlying skeleton, followed by final network reconstruction. Figure adapted from ref. and modified with permission.

References

    1. Li S, et al. Evaluation of chemical compounds that inhibit neurite outgrowth using GFP-labeled iPSC-derived human neurons. Neurotoxicology. 2021;83:137–145. doi: 10.1016/j.neuro.2021.01.003. - DOI - PMC - PubMed
    1. Gu H, Yu SP, Gutekunst CA, Gross RE, Wei L. Inhibition of the Rho signaling pathway improves neurite outgrowth and neuronal differentiation of mouse neural stem cells. Int J. Physiol. Pathophysiol. Pharm. 2013;5:11–20. - PMC - PubMed
    1. Mitchell PJ, Hanson JC, Quets-Nguyen AT, Bergeron M, Smith RC. A quantitative method for analysis of in vitro neurite outgrowth. J. Neurosci. Methods. 2007;164:350–362. doi: 10.1016/j.jneumeth.2007.04.021. - DOI - PubMed
    1. Watts DJ, Strogatz SH. Collective dynamics of ‘small-world’ networks. Nature. 1998;393:440–442. doi: 10.1038/30918. - DOI - PubMed
    1. Zhang J, et al. Disrupted brain connectivity networks in drug-naive, first-episode major depressive disorder. Biol. Psychiatry. 2011;70:334–342. doi: 10.1016/j.biopsych.2011.05.018. - DOI - PubMed

Publication types