. 2024 Jul;16(7):1717-1749.
doi: 10.1038/s44321-024-00074-6. Epub 2024 May 15.

An immunohistochemical atlas of necroptotic pathway expression

Affiliations

An immunohistochemical atlas of necroptotic pathway expression

Shene Chiou et al. EMBO Mol Med. 2024 Jul.

Abstract

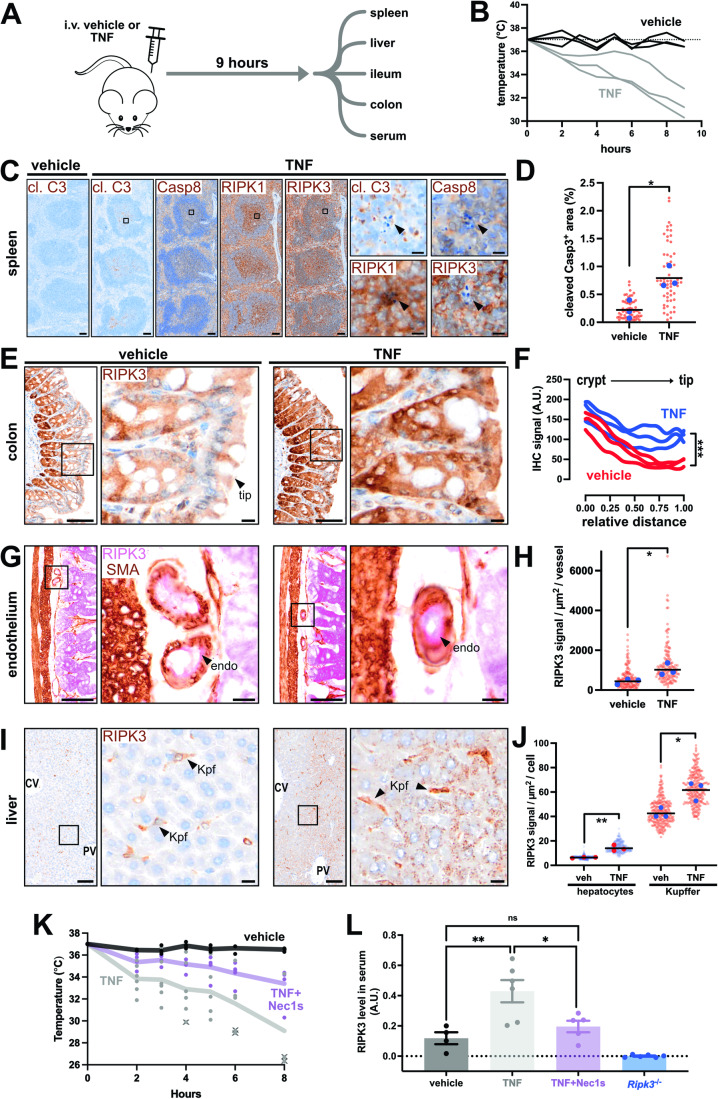
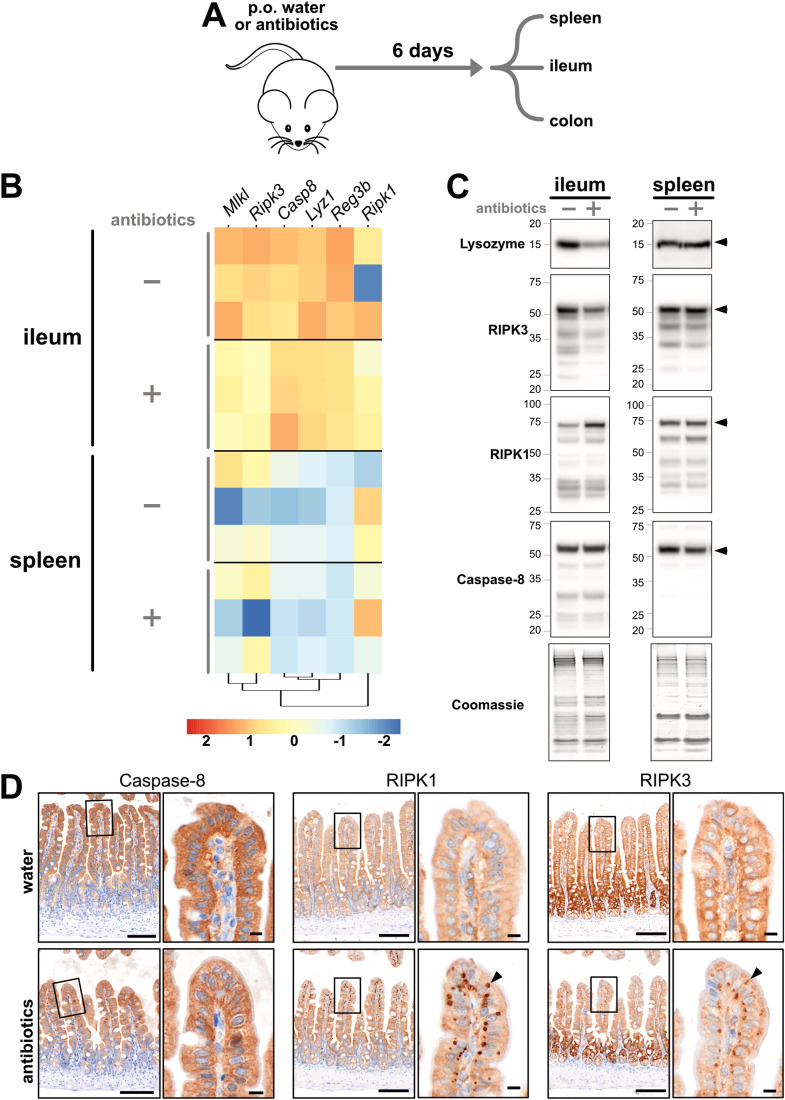
Necroptosis is a lytic form of regulated cell death reported to contribute to inflammatory diseases of the gut, skin and lung, as well as ischemic-reperfusion injuries of the kidney, heart and brain. However, precise identification of the cells and tissues that undergo necroptotic cell death in vivo has proven challenging in the absence of robust protocols for immunohistochemical detection. Here, we provide automated immunohistochemistry protocols to detect core necroptosis regulators - Caspase-8, RIPK1, RIPK3 and MLKL - in formalin-fixed mouse and human tissues. We observed surprising heterogeneity in protein expression within tissues, whereby short-lived immune barrier cells were replete with necroptotic effectors, whereas long-lived cells lacked RIPK3 or MLKL expression. Local changes in the expression of necroptotic effectors occurred in response to insults such as inflammation, dysbiosis or immune challenge, consistent with necroptosis being dysregulated in disease contexts. These methods will facilitate the precise localisation and evaluation of necroptotic signaling in vivo.

Keywords: IBD; Immunohistochemistry; MLKL; Necroptosis; RIPK3.


Figures

Figure 1
Figure 1. Automated immunohistochemistry shows constitutive necroptotic pathway expression is restricted.
(A) To gauge immunohistochemistry performance, immunosignals from wild-type (WT) versus knockout (KO) tissue were deconvoluted, (i) pixel intensities plotted, (ii) ratioed to yield a signal-to-noise (S/N) histogram, and then (iii) integrated. (B) Heatmap shows relative integrated S/N values from seven automated immunohistochemistry protocols across seven tissues. Column headers indicate the antibody target clone name. Data were representative of n ≥ 3 for each target and tissue. (C) Heatmap depicts relative protein abundance values as SILAC (stable isotope labeling by amino acids in cell culture) ratios measured by (Geiger et al, 2013); the lowest value was assigned as 0.1 because 0 is below the detection limit. (D) Immunosignals of Caspase-8, RIPK1, RIPK3, and MLKL in wild-type versus the appropriate knockout (KO) tissue from Mlkl−/− or Casp8/Ripk3/ or Casp8−/Ripk1−/Ripk3/−. Data were representative of n ≥ 3 for each target and tissue. Scale bars are 500 μm. Related to Appendix Fig. S1. Source data are available online for this figure.
Figure 2
Figure 2. Necroptotic potential is spatially graded across tissue zones.
(A) Immunosignals of Caspase-8, RIPK1, and RIPK3 from wild-type mouse ileum (i), colon (ii), liver (iii), and spleen (iv). The crypt base (crypt), villi/crypt tip (tip), central vein (CV), portal vein (PV), bile duct (BD), central artery (CA), white pulp (WP), marginal zone (MZ), and red pulp (RP) are annotated. Inset of immunostaining in the ileum shows lower RIPK3 expression in Paneth cells (open arrowhead) relative to neighboring cells. Arrow shows pericentral hepatocytes that express higher levels of Caspase-8. Closed arrowheads show Caspase-8+ RIPK1+ RIPK3+ Kupffer cells. Scale bars are 50 μm, except for the 10 μm scale bar in the inset. Data were representative of n ≥ 3 for each target and tissue. (B) Relative expression levels of Caspase-8, RIPK1, and RIPK3 (and splenic MLKL; Fig. EV1B) along the indicated tissue axes. Red datapoints indicate immunosignal intensities, and the overlaid dark blue line indicating the LOWESS best-fit along N = 20 axes per tissue. Best-fit curves are superimposed in the left-most column. The dashed line indicates the boundary between the splenic white pulp and the marginal zone. Data were representative of n > 3 mice per target per tissue. (C) Scatterplots where each dot represents a different cell ontology from the Tabula Muris dataset (Tabula Muris et al, 2018). The percent of cells within each ontology that expressed Mki67, Ripk1, or Ripk3 was plotted against that of Top2a. Pearson correlation coefficient values are shown. Related to Fig. EV1. Source data are available online for this figure.
Figure 3
Figure 3. RIPK3 expression is rapidly altered during systemic inflammation.
(A) Experimental design. (B) Core temperatures of vehicle- and TNF-injected mice (n = 3 mice per group). (C) Immunosignals for cleaved Caspase-3 (cl. C3), Caspase-8, RIPK1, or RIPK3 from the spleen of vehicle- or TNF-injected mice. Insets show unidentified RIPK1high cells that associate with apoptotic bodies in the splenic white pulp. In panels (C, E, G, I), the scale bars in zoomed-out images correspond to 100 μm, and the scale bars in zoomed-in images correspond to 10 μm. (D) Graph of white pulp area occupied by cleaved Caspase-3+ material in vehicle- and TNF-treated mice. Each red datapoint represents one white pulp lobule (N = 20 lobules/mouse). Blue datapoints indicate the median value per mouse (n = 3 mice/treatment). Black bars represent the mean value per group. *p < 0.05 by unpaired two-tailed t-test. (E) RIPK3 immunosignals in the colon of vehicle- or TNF-treated mice. (F) Best-fit curves of RIPK3 immunosignals along the crypt-to-tip axis from N = 10 axes per mouse (n = 3 mice/group). ***p < 0.001 by multiple unpaired two-tailed t-test. (G) RIPK3 (pink) and smooth muscle actin (brown) immunosignals in intestinal submucosa of vehicle- or TNF-treated mice. Insets show vessel cross-sections. Arrowheads show RIPK3+ endothelial cells (endo). (H) Plot of RIPK3 signals per vessel. Each red datapoint represents one vessel (N = 50 vessels/mouse). Blue datapoints indicate the median value per mouse (n = 3 mice/treatment). Black bars represent the mean value per group. *p < 0.05 by unpaired two-tailed t-test. (I) RIPK3 immunosignals in the liver of vehicle- or TNF-treated mice. Central vein (CV), portal vein (PV) and Kupffer cell (Kpf). (J) Plot of RIPK3 signals per hepatocyte or Kupffer cell. Each transparent datapoint represents one cell (N = 90 cells/mouse). Opaque datapoints indicate the median value per mouse (n = 3 mice/treatment). Black bars represent the mean value per group. *p < 0.05 and **p < 0.01 by unpaired two-tailed t-test. (K) Core temperatures of vehicle-, TNF- and Nec1s+TNF-injected wild-type mice (n = 4–5 mice/treatment; one dot/mouse/time). Line indicates mean. X indicates a euthanized mouse due to its body temperature being <30 °C. (L) RIPK3 levels in serum from the mice in panel (K) or from untreated Ripk3-/- mice. Data expressed as arbitrary optical density units (A.U.). One dot per mouse. Mean ± SEM is shown. *p < 0.05, **p < 0.01 by one-way ANOVA with Tukey’s post hoc correction. Source data are available online for this figure.
Figure 4
Figure 4. RIPK3 expression changes in response to dysbiosis.
(A) Experimental design. (B) Bulk RNA sequencing was performed on indicated tissues. Heatmap depicts the log-fold-change in gene expression for antibiotic- versus water-treated mice. Each row represents a different mouse. The legend shows the color-to-value scale. (C) Immunoblots for the indicated proteins in the ileum and spleen of water- versus antibiotic-treated mice. Arrowheads indicate full-length proteins of interest. Coomassie staining of total protein content was used as a loading control. Data were representative of n = 7 mice per tissue per group. (D) Caspase-8, RIPK3, and RIPK3 immunosignals in the ileum of water- or antibiotic-treated mice. Arrowheads to cytosolic accumulations of RIPK1 and RIPK3 in epithelial cells at villi tips. Scale bars in lower magnification micrographs are 100 μm. Scale bars in insets are 10 μm. Data were representative of n = 7 mice per group. Related to Appendix Fig. S2. Source data are available online for this figure.
Figure 5
Figure 5. Automated immunohistochemistry quantifies necroptotic signaling in human cells.
(A) Immunosignals of cleaved Caspase-3, Caspase-8, RIPK1, RIPK3, and MLKL in wild-type versus MLKL-/- or RIPK1-/-, or CASP8-/-CASP10-/-MLKL-/- HT29 cells. Arrowheads indicate Caspase-8+, RIPK1+, RIPK3+, and MLKL+ puncta that are presumed to be necrosomes. Data were representative of n ≥ 2 for each protein and treatment. Scale bars in lower magnification micrographs are 10 μm. Scale bars in insets are 2 μm. (B) The percent of cells per treatment group that contain cytosolic necrosome-like puncta immunostained by the stipulated antibody. N = 1051–5630 cells were analysed per condition per stain. Data representative of n = 2 experiments. (C) The number of puncta per cell. N = 1000 cells per treatment group were analysed. Each datapoint represents one cell. The black bar indicates the mean value. ****p < 0.0001 by one-way ANOVA with Krukal–Wallis post hoc correction. Data representative of n = 2 experiments. Related to Appendix Figs. S3, S4 and EV3. Source data are available online for this figure.
Figure 6
Figure 6. Case study for the detection of necroptotic signaling in inflammatory bowel disease.
(A) Study design. (B) Blinded histopathological (Robarts Histopathology Index; RHI) scores of disease activity in intestinal biopsies relative to their endoscopic grading of inflammation. Diamond indicates a sample that could not be formally scored, as it was solely comprised of neutrophilic exudate, but was given a pseudo-score of 15 that likely underrepresents the extent of disease activity in this biopsy. Biopsies scored in Panel B were matched to those used in panels (CE) and Fig. EV4 (see Appendix Table S1 for details). (C) Immunoblot of lysates from HT29 cells (red annotations) and intestinal biopsies from patients A-H (blue annotations). The fifth lane of each gel contained lysates from TSI-treated RIPK3-/- or TSI-treated MLKL-/- cells (see source data for details). Patients A,C,E,G were non-IBD controls. Patients B and D had ulcerative colitis (UC). Patients F and H had Crohn’s disease (CD). The endoscopic grading of the biopsy site as “non-inflamed”, “marginally inflamed”, or “inflamed” is stipulated. Closed arrowheads indicate full-length form of proteins. Asterisks indicate active, phosphorylated forms of RIPK3 (pRIPK3) and MLKL (pMLKL). Open arrowheads indicate active, cleaved forms of Caspase-8, Caspase-10, and Caspase-3. GAPDH was used as a loading control. (D) Immunohistochemistry for Caspase-8 (clone B.925.8) on intestinal biopsies. Insets a–e show diffuse epithelial Caspase-8 in patient C. Insets f–j show mild clustering of epithelial Caspase-8 and insets k–o show more pronounced clustering of epithelial Caspase-8 in patient D (arrowheads). Scale bars in lower magnification micrographs are 500 μm. Scale bars in insets are 10 μm. (E) The number of Caspase-8+ puncta per 100 cells. Each datapoint represents one crypt. Whole slide scans with N = 20,246 cells from the ‘non-IBD patient C’ biopsy, N = 10,416 cells from the ‘non-inflamed patient D’ biopsy, and N = 30,799 cells from the ‘inflamed patient D’ biopsy were analysed. The black bar indicates the mean value. **p < 0.01 by one-way ANOVA with Tukey’s post hoc correction. Related to Appendix Table S1; Figs. EV4, 5; Appendix Fig. S5. Source data are available online for this figure.
Figure EV1
Figure EV1. Constitutive co-expression of necroptotic effectors is confined to fast-cycling cells within progenitors, immune and barrier populations.
(A) Heatmap of cell ontologies from the Tabula Muris dataset (Tabula Muris et al, 2018). Left-most column depicts the tissue origin of each cell ontology. Other columns indicate the percent of cells within each ontology that expressed Top2a, Mki67, Casp8, Ripk1, Ripk3, or Mlkl. Legend shows the color-to-tissue and the color-to-frequency scales. Cell ontologies of interest are annotated. (B) Micrograph of MLKL immunosignals from the wild-type mouse spleen. The white pulp (WP), marginal zone (MZ), and red pulp (RP) are annotated. Scale bar is 50 μm. Scatterplot shows relative expression levels of MLKL along the white pulp-to-red pulp axis. Red datapoints show immunosignal intensities and the overlaid dark blue line indicates the LOWESS best-fit along N = 20 axes from n = 1 mouse. Dashed line indicates the boundary between splenic white pulp and marginal zone. Data were representative of n > 3 mice. (C, D) Spatial transcriptomic data from (Moor et al, 2018)) and (Ben-Moshe et al, 2019) showing the relative expression levels (arbitrary units; A.U.) of Caspase-8, RIPK1, RIPK3, or MLKL along the ileal crypt-to-villus axis (C) or the hepatic central vein-to-portal vein axis (D). (EG) Spatial transcriptomic data on mouse spleen 12 days after Plasmodium berghei-infection. Panel (E) shows a uniform manifold approximation and projection (UMAP) of cell populations distinguished by unsupervised leiden clustering. Legend shows the color assigned to each population. Panel (F) shows the location of each cell cluster. Scale bar is 500 μm. Panel (G) shows the normalized expression for each gene product. Expression values for Casp8, Ripk1, Ripk3, and Mlkl were summated to provide an index of “cluster pathway expression”, which was averaged to provide an index of “zone pathway expression”. Data were from n = 1 mouse.
Figure EV2
Figure EV2. RIPK3 is uniquely upregulated in splenic germinal centers.
(A) Experimental design. (B) Ki67, Caspase-8, RIPK1, RIPK3, and MLKL immunosignals from adjacent sections of the naïve or NP-KLH-immunized mouse spleen. Arrowheads show a Ki67+ germinal center that co-stains for RIPK3, but not other members of the pathway. Representative of n > 3 mice per group. Scale bars in lower magnification micrographs are 500 μm. Scale bars in insets are 100 μm. Data were representative of n > 3 mice per group. (CJ) Ripk3-/- or Ripk3+/+ mice were immunized with NP-KLH and circulating NP-specific IgG1 (C), circulating NP-specific IgM (D), splenic mature B cells (E, F), splenic NP-specific plasma cells (G), circulating low affinity NP-specific IgG1 antibody (H), circulating high affinity NP-specific IgG1 (I), and the ratio between circulating low-and-high affinity NP-specific antibody (J) were measured at the indicated day after immunization. Bars on graphs in (CJ) represent mean ± SEM. Each datapoint represents one mouse. ns non-significant by two-sided t-test with Welch’s correction.
Figure EV3
Figure EV3. Assessing the specificity of immunostaining using wild-type, knockout and human RIPK3 knock-in mice.
(A) Approach used to insert the human RIPK3 coding sequence (CDS) into the mouse Ripk3 locus. (B) Immunoblot of spleen homogenates from Ripk3+/+, Ripk3-/-, human RIPK3 (RIPK3KI/KI) or hemizygous human RIPK3 (Ripk3+RIPK3KI) mice. GAPDH immunoblots are shown as loading controls. Each lane represents a different mouse. (C) Immunosignals produced by the anti-human RIPK3 (clone 37A7F) or anti-mouse RIPK3 (clone 8G7) antibodies on spleen sections from RIPK3KI/KI, Ripk3+/+ or Casp8-/-Ripk1-/-Ripk3-/-. Data were representative of n ≥ 3 for each target and tissue. Scale bars are 500 μm.
Figure EV4
Figure EV4. Another instance of elevated intestinal apoptosis in a patient with ulcerative colitis.
Immunoblot of lysates from HT29 cells (red annotations) and intestinal biopsies from patients A-H (blue annotations). The fifth lane of each gel contained lysates from TSI-treated RIPK3-/- or TSI-treated MLKL-/- cells (see source data for details). Patient J was a non-IBD control. Patient I had ulcerative colitis (UC). The endoscopic grading of the biopsy site as “non-inflamed”, “marginally inflamed”, or “inflamed” is stipulated. Closed arrowheads indicate full-length form of proteins. Asterisks indicate active, phosphorylated forms of RIPK3 (pRIPK3) and MLKL (pMLKL). Open arrowheads indicate active, cleaved forms of Caspase-10 and Caspase-3. GAPDH was used as a loading control.
Figure EV5
Figure EV5. Atlas of necroptotic pathway expression in human intestinal crypts.
Immunohistochemistry for cleaved Caspase-3, Caspase-8 (clone B.925.8), RIPK1, RIPK3, and MLKL (clone EPR171514) on intestinal biopsies from the stipulated patients. Four representative micrographs per biopsy are shown (i-v). Open arrowheads indicate instances of epithelial apoptosis. Closed arrowheads indicate instances of epithelial Caspase-8 clustering. Scale bars are 10 μm. The location for each micrograph within the biopsy is indicated in Appendix Fig. S5.

References

    1. Alvarez-Diaz S, Dillon CP, Lalaoui N, Tanzer MC, Rodriguez DA, Lin A, Lebois M, Hakem R, Josefsson EC, O’Reilly LA, et al. The pseudokinase MLKL and the kinase RIPK3 have distinct roles in autoimmune disease caused by loss of death-receptor-induced apoptosis. Immunity. 2016;45:513–526. doi: 10.1016/j.immuni.2016.07.016. - DOI - PMC - PubMed
    1. Ananthakrishnan AN. Epidemiology and risk factors for IBD. Nat Rev Gastroenterol Hepatol. 2015;12:205–217. doi: 10.1038/nrgastro.2015.34. - DOI - PubMed
    1. Bader SM, Preston SP, Saliba K, Lipszyc A, Grant ZL, Mackiewicz L, Baldi A, Hempel A, Clark MP, Peiris T, et al. Endothelial Caspase-8 prevents fatal necroptotic hemorrhage caused by commensal bacteria. Cell Death Differ. 2023;30:27–36. doi: 10.1038/s41418-022-01042-8. - DOI - PMC - PubMed
    1. Benjamini Y, Hochberg Y. Controlling the false discovery rate: a practical and powerful approach to multiple testing. J R Stat Soc Ser B. 1995;57:289–300. doi: 10.1111/j.2517-6161.1995.tb02031.x. - DOI
    1. Ben-Moshe S, Shapira Y, Moor AE, Manco R, Veg T, Bahar Halpern K, Itzkovitz S. Spatial sorting enables comprehensive characterization of liver zonation. Nat Metab. 2019;1:899–911. doi: 10.1038/s42255-019-0109-9. - DOI - PMC - PubMed