. 2024 May;629(8014):1082-1090.
doi: 10.1038/s41586-024-07423-y. Epub 2024 May 15.

Evolution of a novel adrenal cell type that promotes parental care

Affiliations

Evolution of a novel adrenal cell type that promotes parental care

Natalie Niepoth et al. Nature. 2024 May.

Abstract

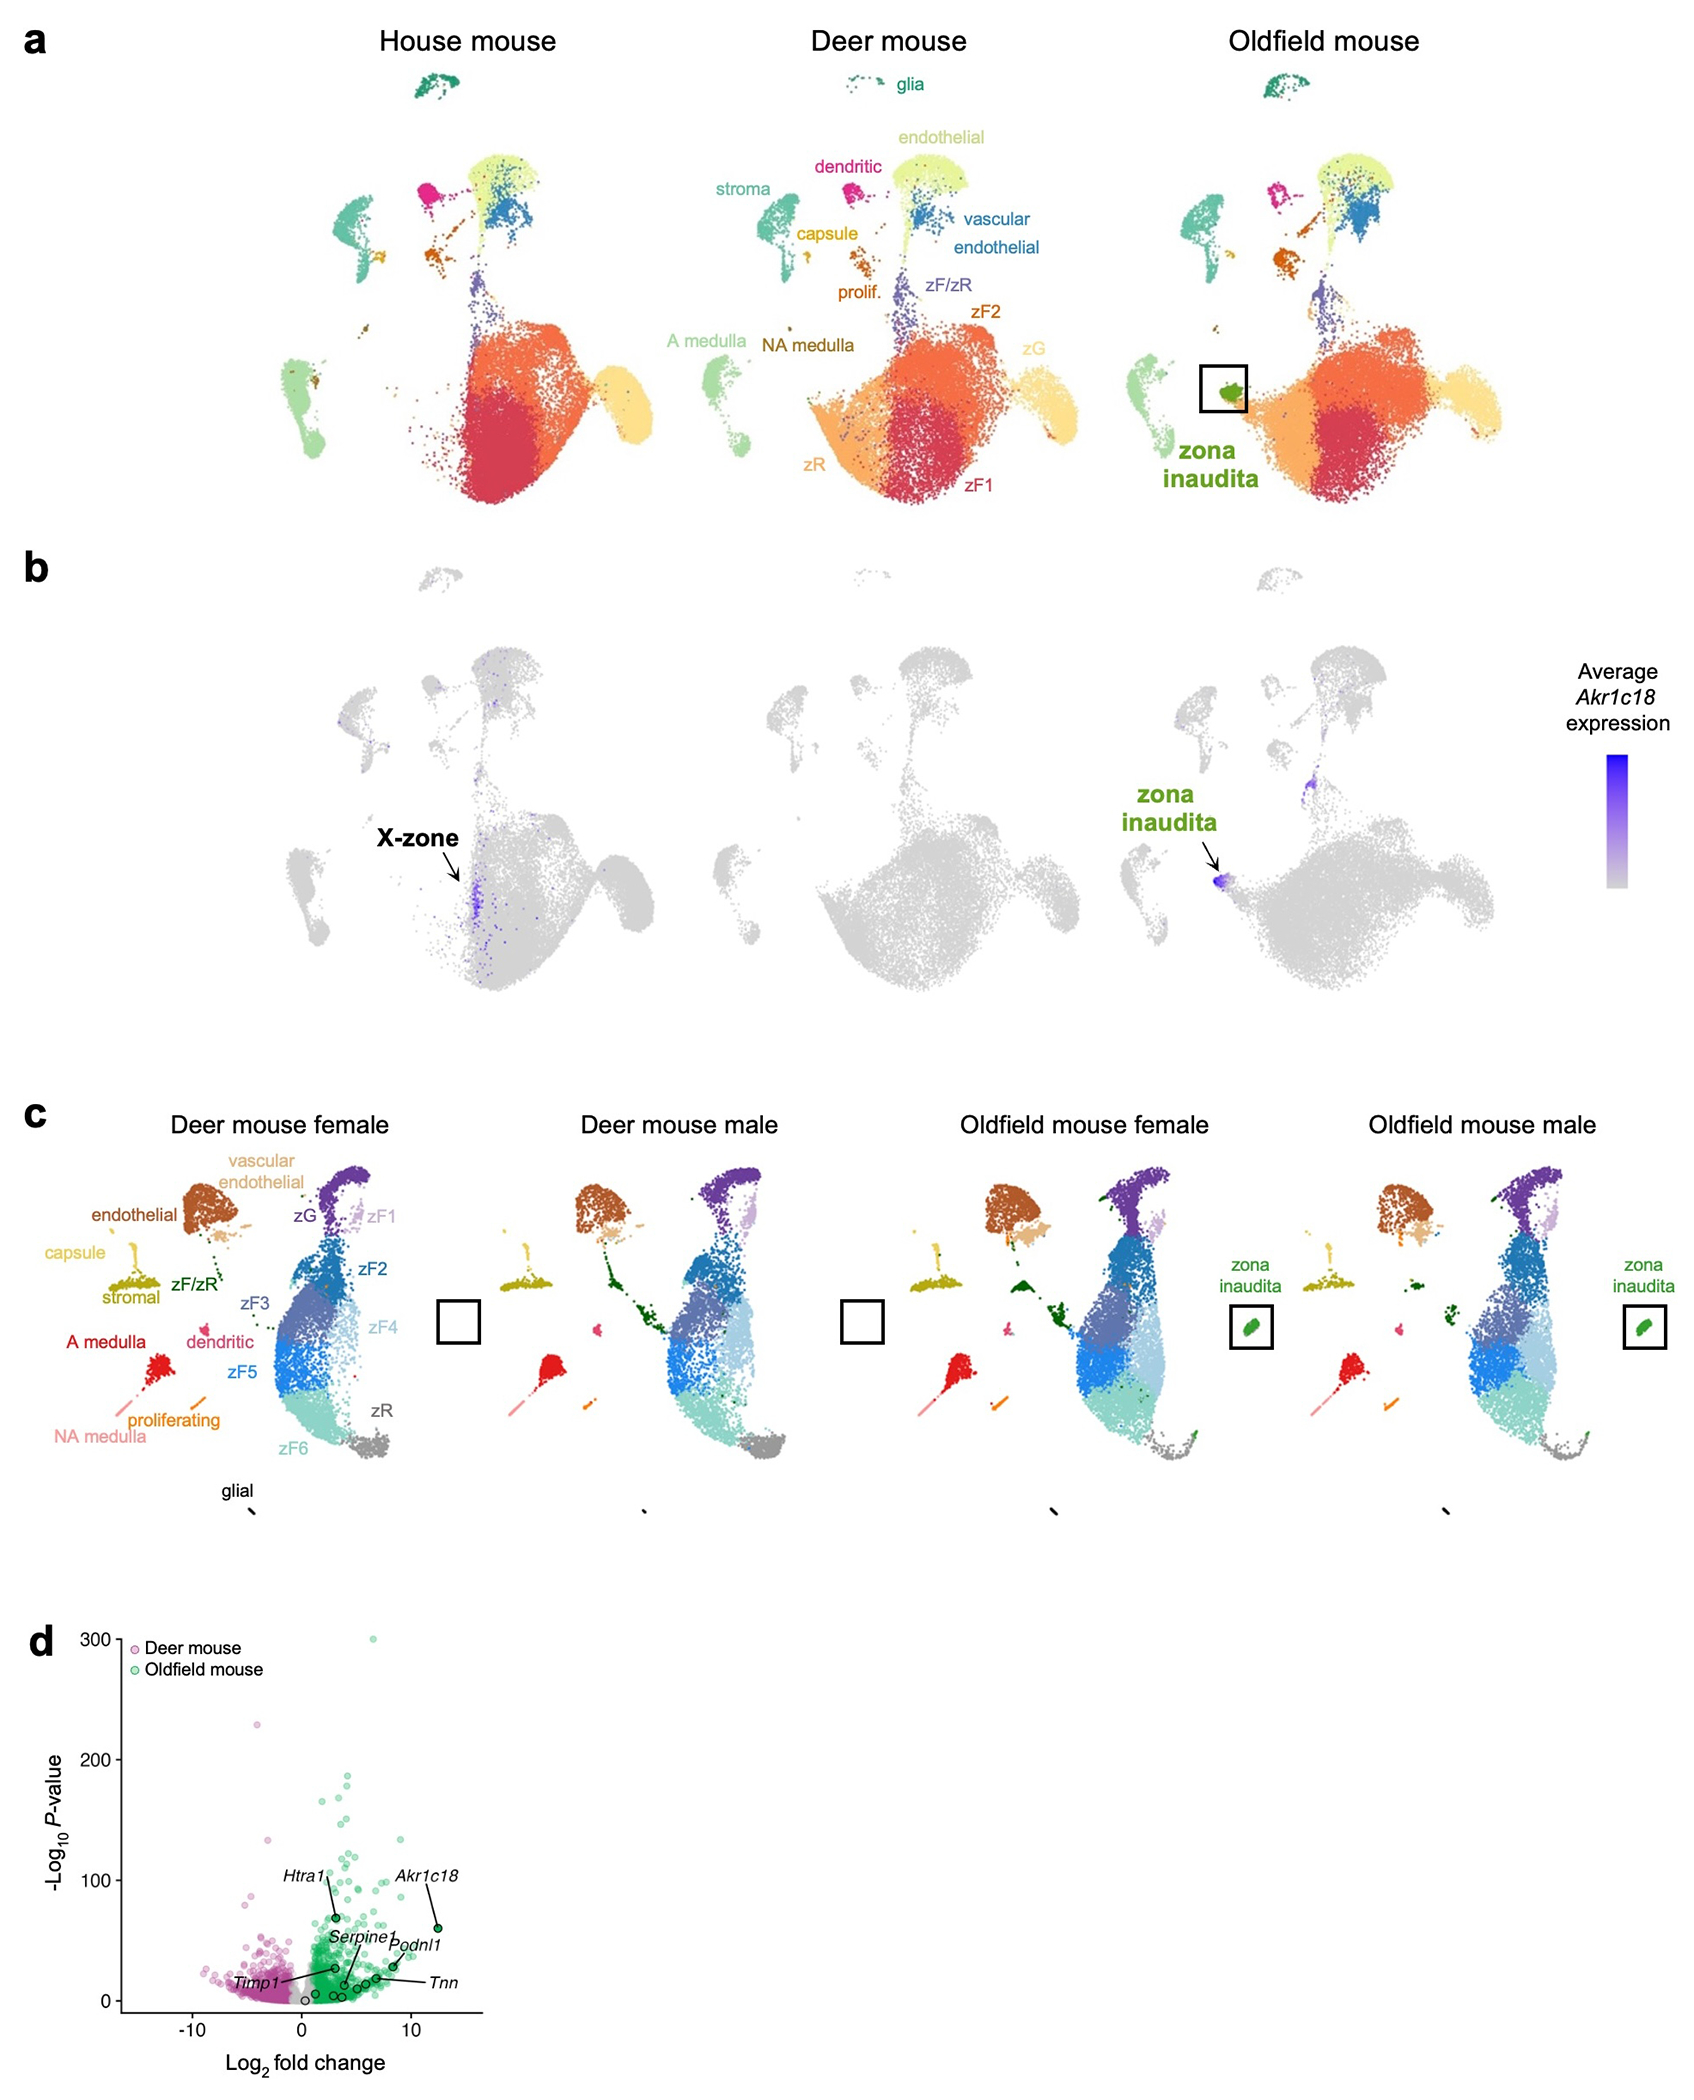
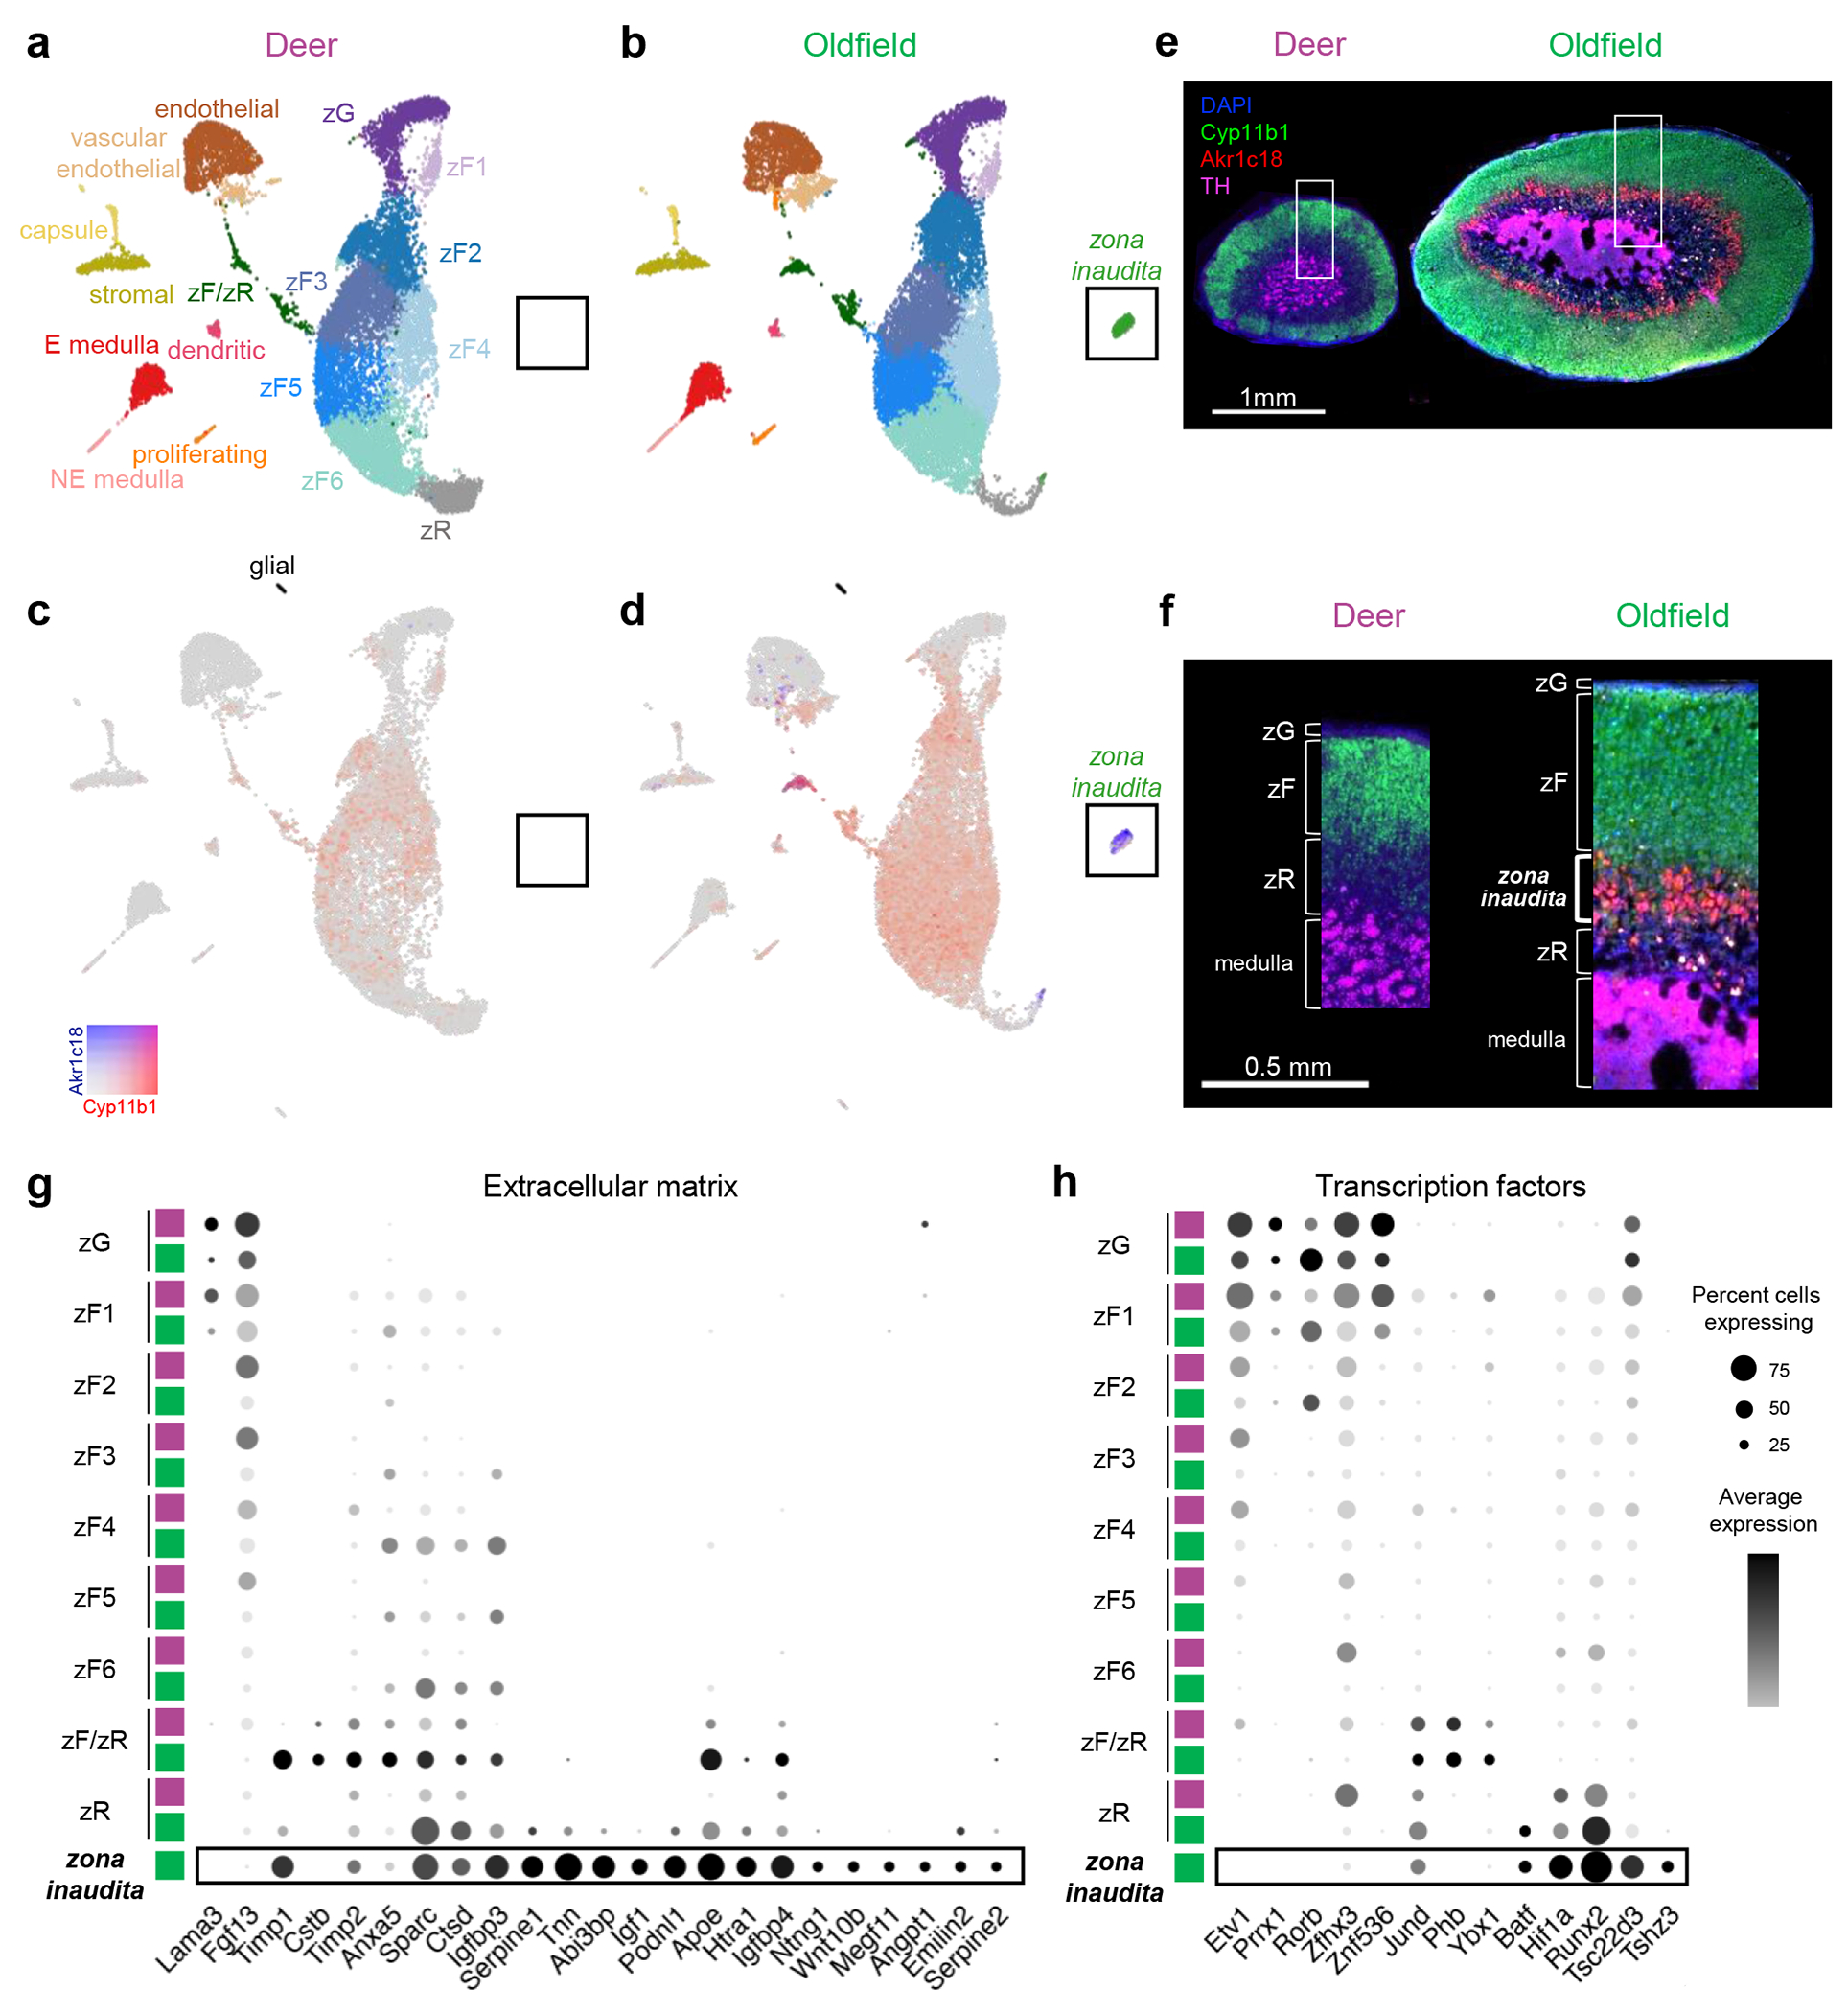
Cell types with specialized functions fundamentally regulate animal behaviour, and yet the genetic mechanisms that underlie the emergence of novel cell types and their consequences for behaviour are not well understood1. Here we show that the monogamous oldfield mouse (Peromyscus polionotus) has recently evolved a novel cell type in the adrenal gland that expresses the enzyme AKR1C18, which converts progesterone into 20α-hydroxyprogesterone. We then demonstrate that 20α-hydroxyprogesterone is more abundant in oldfield mice, where it induces monogamous-typical parental behaviours, than in the closely related promiscuous deer mice (Peromyscus maniculatus). Using quantitative trait locus mapping in a cross between these species, we ultimately find interspecific genetic variation that drives expression of the nuclear protein GADD45A and the glycoprotein tenascin N, which contribute to the emergence and function of this cell type in oldfield mice. Our results provide an example by which the recent evolution of a new cell type in a gland outside the brain contributes to the evolution of social behaviour.


Conflict of interest statement

Competing interests statement

The authors declare no competing interests.

Figures

Extended Data Figure 1.
Extended Data Figure 1.. Anatomical, molecular, and biochemical characterization of deer- and oldfield adrenal glands.
a, Adrenal weight at postnatal day 0.5. Lines at median. b, Adult adrenal weight by age. P-values by generalized linear model. Band is 95% confidence interval. c, Adrenal medulla volume. Lines at median. P-values by generalized linear model. d, Representative adrenal section from the zona fasciculata (zF) of the deer- and oldfield mouse adrenal cortex. Cyp11b1 (green) labeled by in situ hybridization and counterstained with DAPI (red). Five independent biological replicates per species yielded similar results. e, Scatterplot of gene expression by species and sex. f, Boxplots of the expression of steroidogenic enzymes in the corticosterone- and 20α-OHP synthesis pathways in the adrenal. Boxplot hinges are 25th and 75th quartiles, whiskers are 1.5× interquartile range, line at median. g, Total steroid levels in the adrenal gland of deer and oldfield mice. Lines at median. P-values by generalized linear model. DOC, deoxycorticosterone. h, Expression of Akr1c18 in the ovaries and testes of oldfield and deer mice. Lines at median. P-values by two-sided t-test. i, Akr1c18 (red) labeled by in situ hybridization in the ovary of a deer mouse and counterstained with DAPI (blue). Three independent biological replicates per species yielded similar results. j, Circulating 20α-OHP levels in the blood of oldfield mice after adrenalectomy. Lines at median. P-values by generalized linear model.
Extended Data Figure 2.
Extended Data Figure 2.. Effects of 20α-OHP on alloparental and parental care.
Male and female care for pups as measured by proportion of time spent huddling pups, proportion of time spent grooming pups, fraction of pups retrieved to the nest, and nest quality score (from 0 to 4) in a, unmated deer mice, b, unmated oldfield mice, and c, deer mouse fathers. Boxplot hinges are 25th and 75th quartiles, whiskers are 1.5× interquartile range, line at median. P-values by generalized linear model for proportion of time huddling, proportion of time grooming the pup, proportion of pups retrieved, and nest quality. P-values for proportion of animals that retrieved at least one pup by Fisher’s exact test. d, Proportion of pup attacks by species, treatment, and reproductive experience.
Extended Data Figure 3.
Extended Data Figure 3.. Partner preference is not affected by 20α-OHP.
Top: Schematic of the experimental design of the partner preference test. Bottom: Observations from the same breeding pairs are connected by lines (10 minute partner preference test). P-values by generalized linear model (effect of trial type).
Extended Data Figure 4.
Extended Data Figure 4.. 20α-OHP is converted to allo-diol in the brain of deer- and oldfield mice.
a, Concentration of allo-diol, allopregnanolone and progesterone in deer- and oldfield mouse cerebellum and hypothalamus after incubation with 20α-OHP, as measured by LC-MS/MS. P-values by two-sided t-test.
Extended Data Figure 5.
Extended Data Figure 5.. Effects of allo-diol on alloparental and parental care, and on δGABAAR.
Male and female care for pups as measured by proportion of time spent huddling pups, proportion of time spent grooming pups, fraction of pups retrieved to the nest, and nest quality score in a, unmated deer mice, b, unmated oldfield mice, and c, oldfield parents. Boxplot hinges are 25th and 75th quartiles, whiskers are 1.5× interquartile range, line at median. P-values by generalized linear model for proportion of time huddling, proportion of time grooming the pup, proportion of pups retrieved, and nest quality. P-values for proportion of animals that retrieved at least one pup by Fisher’s exact test. d, Proportion of pup attacks by species, treatment, and reproductive experience. e, Baseline tonic GABA receptor currents with leak current subtracted, after gabazine application. f, Input resistance (Ri) under different pharmacological conditions. No change in Ri in the presence of allo-diol and 20α-OHP suggests no effect on GABA receptor currents. A decrease in Ri in the presence of THIP is consistent with an increase in GABA receptor currents. This effect is diminished when THIP is co-applied with allo-diol but not with 20α-OHP. Ri increases in gabazine when all GABA receptors are blocked. P-values by two-sided one-sample t-test (μ=0) and two-sample two-sided t-tests. Bars denote the mean ± SEM.
Extended Data Figure 6.
Extended Data Figure 6.. UMAP visualization of the house-, deer-, and oldfield mouse adrenal.
a, UMAP of integrated analysis of house mouse, deer mouse, and oldfield mouse adrenal nuclei. b, UMAP showing Akr1c18 expression in adrenal cells, marking the X zone in house mice and the zona inaudita in oldfield mice. c, UMAP of integrated analysis of deer mouse and oldfield mouse nuclei, then split by sex. d, Volcano plot of differential adrenal gene expression between deer- and oldfield mouse (purple: higher in deer mouse, green: higher in oldfield mouse, grey: n.s.). Akr1c18 and extracellular matrix gene markers of the zona inaudita (from Fig. 3g) are highlighted. False Discovery Rate=0.05.
Extended Data Figure 7.
Extended Data Figure 7.. Expression of top marker genes of the adrenal zones of deer mice and oldfield mice.
Violin plots denoting the top two markers of each adrenal cell type.
Extended Data Figure 8.
Extended Data Figure 8.. Dot plots of marker genes of the zona inaudita of oldfield mice and the X zone of house mice.
Expression of transcription factors (TFs), extracellular matrix (ECM) genes, and other genes upregulated in the zona inaudita or X zone. Note that in adults, the X zone is only present in unmated females.
Extended Data Figure 9.
Extended Data Figure 9.. Cis-regulation of Gadd45a contributes to transcription factor module expression.
a, Expression of Akr1c18 in the adrenal of female and male deer × oldfield F2 hybrids. b, Dot plot of Gadd45a, Tnn, and Akr1c18 expression in adrenal cortex cell types. c, Gadd45a expression by genotype at the Gadd45a locus in F2-hybrid males. Boxplot hinges are 25th and 75th quartiles, whiskers are 1.5× interquartile range, line at median. P-value by ANOVA. Logarithm of the odds (LOD) across the genome of d, Hif1a and e, Runx2 expression. f, LOD across the genome for the TF module and the TF module excluding Gadd45a. g, LOD of the TF module and the TF module controlling for Gadd45a expression. Dashed lines denote genome-wide threshold of significance (α=0.05).
Extended Data Figure 10.
Extended Data Figure 10.. Cis-regulation of Tnn contributes to extracellular matrix module expression.
a, Expression of Tnn in deer and oldfield mice. P-value by two-sided t-test. b, Allele-specific expression of Tnn in deer × oldfield F1 hybrids. P-value by paired two-sided t-test. c, Correlation between Akr1c18 expression and Tnn expression across development of oldfield mice. P-value by bivariate correlation, R denotes Pearson’s correlation coefficient. d, Logarithm of the odds (LOD) across the genome of Cdkn2a, Podnl1, Serpine1, and Timp1 expression. e, LOD of the ECM module and the ECM module without Tnn. f, LOD of the ECM module and the ECM module controlling for Tnn expression. g, LOD of Akr1c18 expression and Akr1c18 expression controlling for Tnn expression. Dashed lines denote genome-wide threshold of significance (α=0.05). h, Tnn expression as a function of genotype at the Tnn locus in F2-hybrid males. Akr1c18 expression as a function of genotype at the Tnn locus (i) or the Akr1c18 locus (j) in F2-hybrid males. h, i, j Boxplot hinges are 25th and 75th quartiles, whiskers are 1.5× interquartile range, line at median. P-values by ANOVA.
Figure 1.
Figure 1.. Oldfield mice have larger adrenal glands that recently evolved the ability to produce more 20α-OHP than deer mice.
a, Photo of adrenal glands from house mouse, deer mouse and oldfield mouse. b, Representative mid-adrenal sections from deer- and oldfield mice labeled with antibody against tyrosine hydroxylase, a marker of the adrenal medulla. Experiment was repeated with 20 individuals per species with similar results. c, Adrenal weight. d, Cortex volume. e, Cortex cell number. f, Scatterplot of adrenal gene expression in deer and oldfield mice. TPM, transcripts per million. g, Schematic of the enzymatic pathway from progesterone to corticosterone and 20α-OHP with the fold difference in the expression (oldfield/deer) of Cyp11b1 and Akr1c18. DOC: deoxycorticosterone, 20α-OHP: 20α-hydroxyprogesterone. h, High performance liquid chromatography trace of progesterone and 20α-OHP standards, and the reduction of progesterone to 20α-OHP by oldfield mouse Akr1c18. i, Concentration of steroids in the adrenal by liquid chromatography tandem mass spectrometry (LC-MS/MS). j, Total 20α-OHP in the adrenal of deer- and oldfield mice by LC-MS/MS. k, Plasma levels of 20α-OHP by LC-MS/MS. l, Expression of Akr1c18 in adrenals of Peromyscus species whose phylogenetic relationships, are represented by the dendrogram on the left. c,d,e,i,j,k: lines at medians; P-values by generalized linear model.
Figure 2.
Figure 2.. 20α-OHP and its metabolite allo-diol increase parenting behaviors.
a, Schematic of behavioral assays after administration of 20α-OHP to oldfield parents. b, Parental care as measured by proportion of time spent grooming (licking) and huddling pups, fraction of pups retrieved to the nest, and nest quality score (from 0 to 4). c, Partner preference as measured by [(time huddling with partner − time huddling with novel conspecific of opposite sex) / (time huddling with partner + time huddling with novel conspecific of opposite sex)]. d, Proportion of time in open arms of the elevated plus maze. e, Schematic of enzymatic pathway from 20α-OHP to allo-diol. 5α-R: 5α- reductase, 3α-HSD: 3α-hydroxysteroid dehydrogenase, allo-diol: allopregnanediol. f, Allo-diol concentration after oldfield cerebellum and hypothalamus were incubated with 20α-OHP. Bars denote the mean ± SEM. P-values by two-sided paired t-test. g, Nest quality of oldfield parents after an injection of allo-diol one hour earlier. h, Tonic GABAergic currents recorded from oldfield mouse cerebellar granule cells after addition of 300 nM allo-diol, 300 nM 20α-OHP, and 500 nM THIP and in the combinations depicted at the bottom. Amplitude (in picoAmperes) is baseline-subtracted. Baseline tonic current was calculated after gabazine application (Extended Data Fig. 5e). Bars denote the mean ± SEM. P-values by two-sided two-sample t-test and two-sided one-sample t-test (μ=0). Panels b,c,d,g: Boxplot hinges are 25th and 75th quartiles, whiskers are 1.5× interquartile range, line at median. b,c,d,g P-values by generalized linear model. i, Proposed pathways by which 20α-OHP promotes parental care.
Figure 3.
Figure 3.. Molecular and cellular characterization of adrenal glands reveals a new cell type in oldfield mice: the zona inaudita.
UMAP of single nucleus RNA sequencing of a, deer mouse and b, oldfield mouse adrenals. c, UMAP depicting the expression of Akr1c18 and Cyp11b1 in deer mouse and d, in oldfield mouse. e, In situ hybridization of Cyp11b1 (a marker of zona fasciculata [zF]) and Akr1c18 (marking the zona inaudita) and immunohistochemistry of tyrosine hydroxylase (TH) for visualization of adrenocortical zonation. The zona glomerulosa (zG) is characterized by high cell density (Suppl. Fig. 2a). 15 biological replicates per species yielded similar results. f, Inset of panel e. g, Extracellular matrix genes and h, transcription factor genes differentially expressed across cortical cell types of the adrenals of both species.
Figure 4.
Figure 4.. Quantitative genetic analysis of zona inaudita identifies a prominent role for Gadd45a and Tnn.
a, Schematic of experimental design for expression quantitative trait locus (eQTL) mapping of adrenal zona inaudita genes. b, Spearman correlation matrix in F2-hybrid males of expression of zona inaudita marker genes, defined as 4-fold more highly expressed than in other deer- and oldfield adrenal cells. Gray boxes around the transcription factor (TF) and extracellular matrix (ECM) modules. c, Logarithm of the odds (LOD) of adrenal expression of Gadd45a and the TF module across the genome. d, LOD of adrenal expression of Akr1c18, Tnn, and the ECM module. Dashed lines denote genome-wide threshold of significance (α=0.05). e, Expression of Gadd45a, Tnn, and Akr1c18 across development in oldfield mice. f, Model of zona inaudita cell type identity acquisition, illustrated by Claire Everett.

References

    1. Arendt D et al. The origin and evolution of cell types. Nat. Rev. Genet 17, 744–757 (2016). - PubMed
    1. Tosches MA et al. Evolution of pallium, hippocampus, and cortical cell types revealed by single-cell transcriptomics in reptiles. Science 360, 881–888 (2018). - PubMed
    1. Bakken TE et al. Single-cell and single-nucleus RNA-seq uncovers shared and distinct axes of variation in dorsal LGN neurons in mice, non-human primates, and humans. eLife 10, e64875 (2021). - PMC - PubMed
    1. Krienen FM et al. Innovations present in the primate interneuron repertoire. Nature 586, 262–269 (2020). - PMC - PubMed
    1. Hain D et al. Molecular diversity and evolution of neuron types in the amniote brain. Science 377, eabp8202 (2022). - PubMed

Methods references

    1. Choi HMT et al. Third-generation in situ hybridization chain reaction: Multiplexed, quantitative, sensitive, versatile, robust. Development 145, dev165753 (2018). - PMC - PubMed
    1. Kuehn E et al. Segment number threshold determines juvenile onset of germline cluster expansion in Platynereis dumerilii. J. Exp. Zoolog. B Mol. Dev. Evol. 338, 225–240 (2022). - PMC - PubMed
    1. Renier N et al. iDISCO: A simple, rapid method to immunolabel large tissue samples for volume imaging. Cell 159, 896–910 (2014). - PubMed
    1. Bedford NL et al. Automated tracking reveals the social network of beach mice and their burrows. 2021.08.07.455531 Preprint at 10.1101/2021.08.07.455531 (2021). - DOI
    1. Kingsley EP, Kozak KM, Pfeifer SP, Yang D-S & Hoekstra HE The ultimate and proximate mechanisms driving the evolution of long tails in forest deer mice. Evolution 71, 261–273 (2017). - PMC - PubMed

MeSH terms

LinkOut - more resources