. 2024 Jun;630(8016):457-465.
doi: 10.1038/s41586-024-07443-8. Epub 2024 May 15.

Engineered CD47 protects T cells for enhanced antitumour immunity

Affiliations

Engineered CD47 protects T cells for enhanced antitumour immunity

Sean A Yamada-Hunter et al. Nature. 2024 Jun.

Abstract

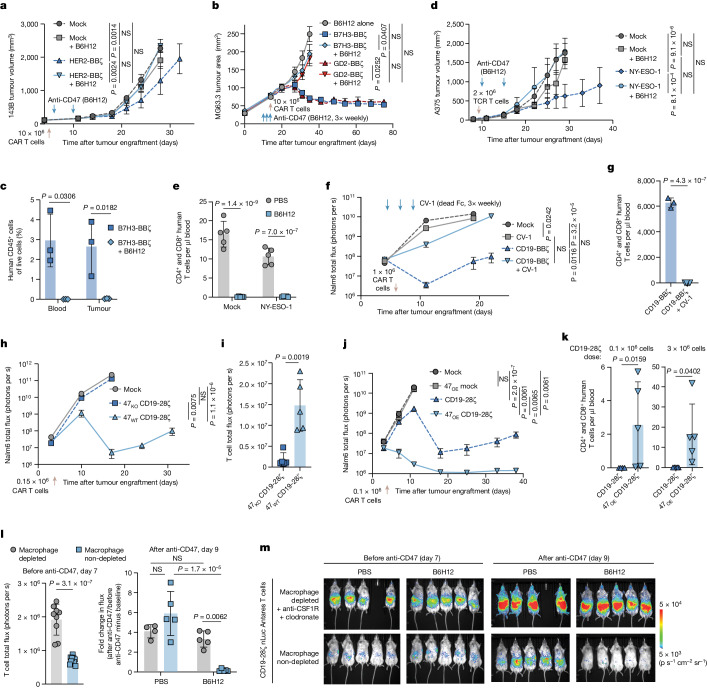
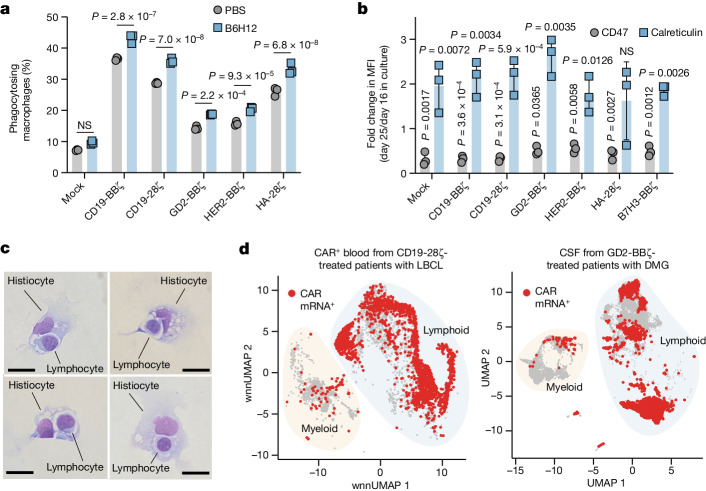
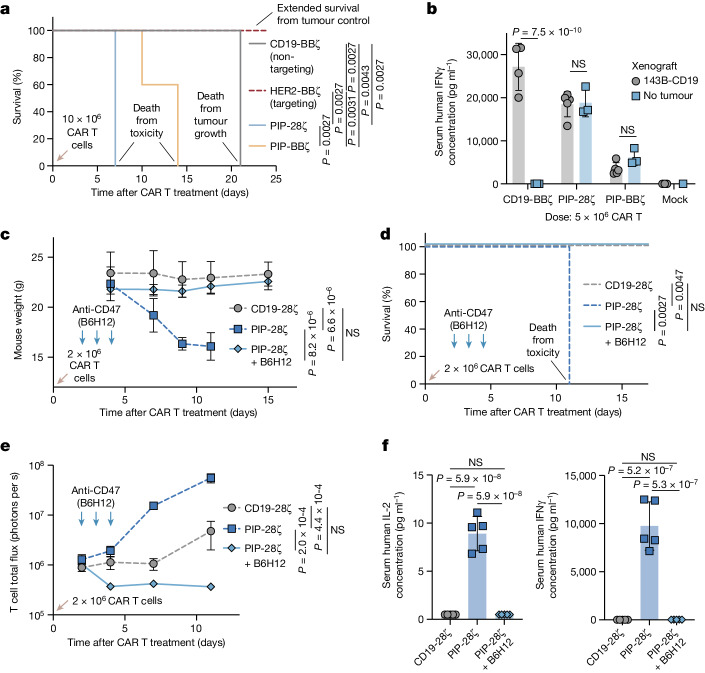
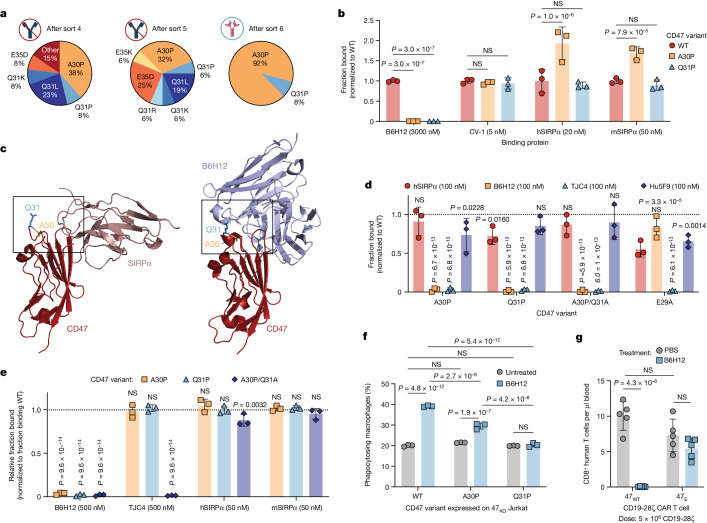
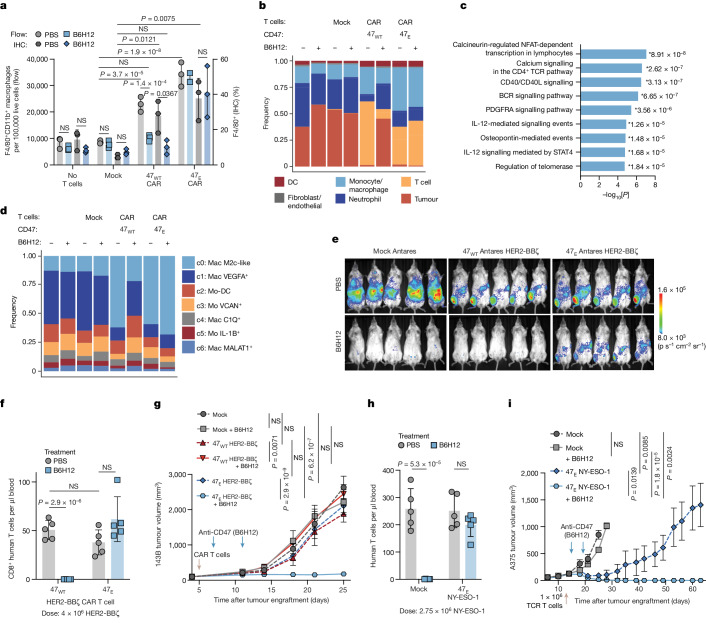
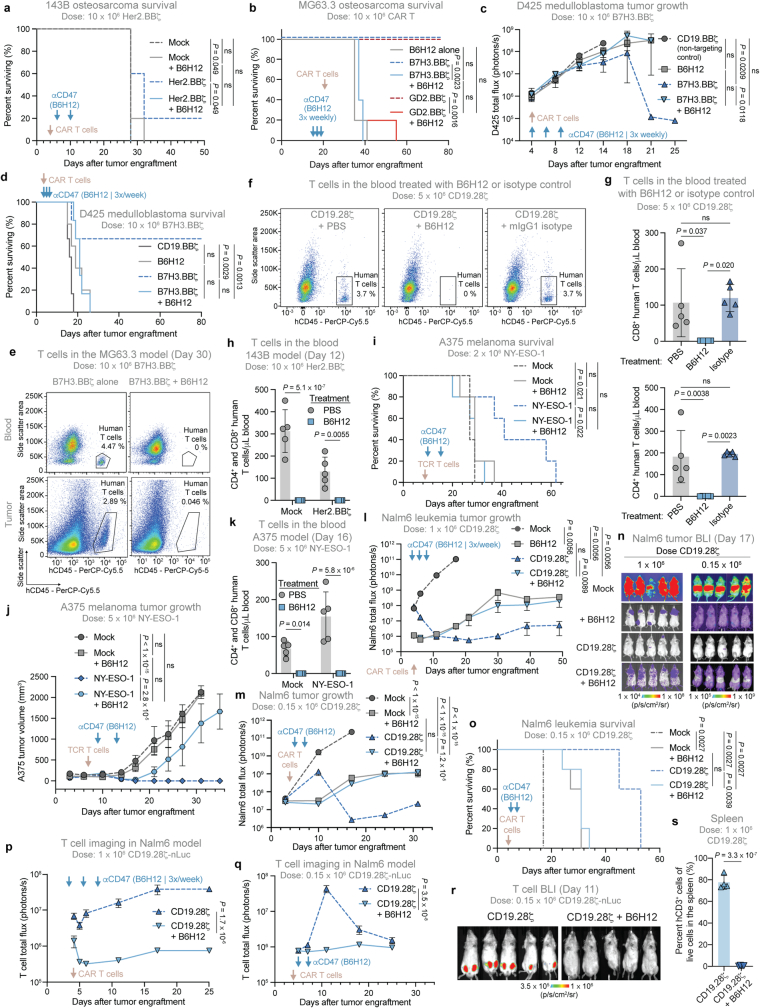
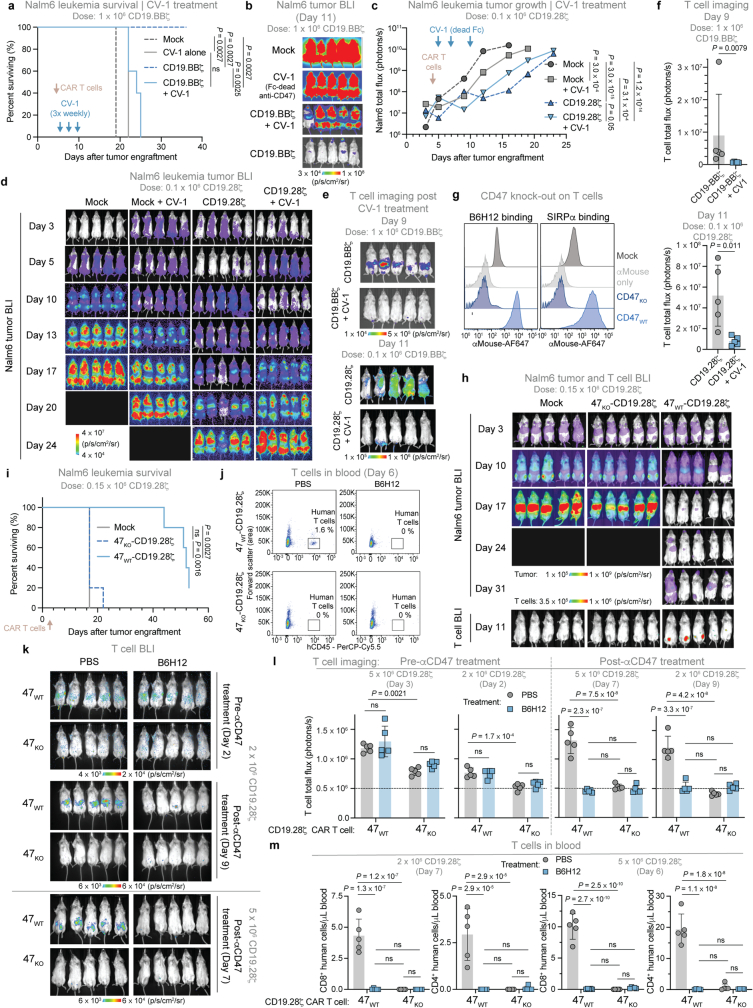
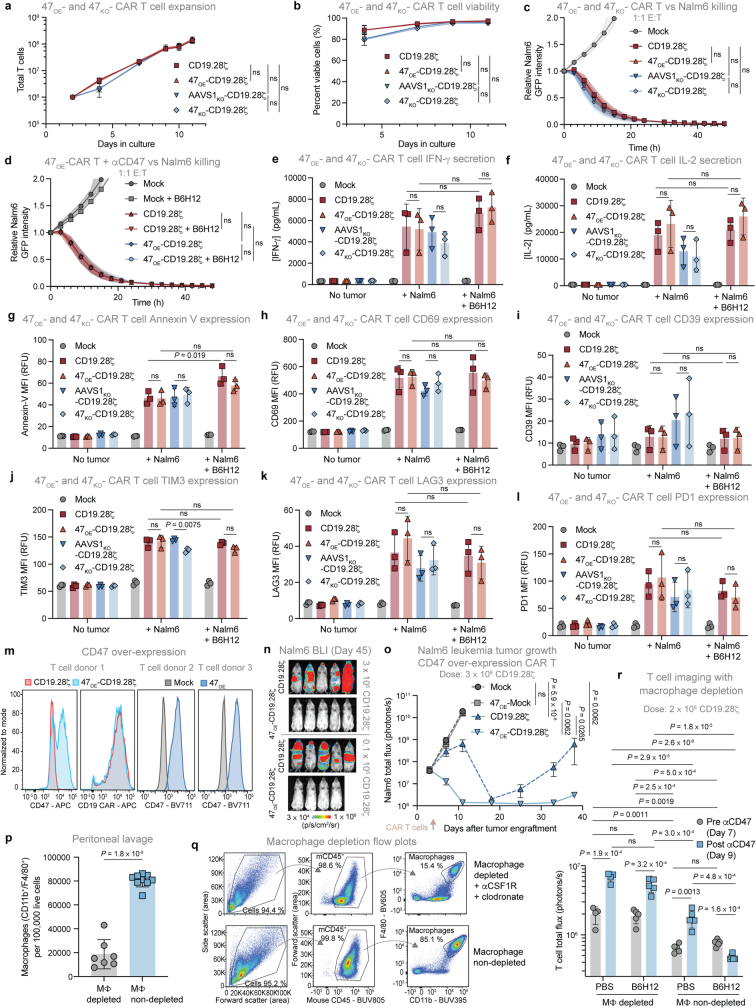
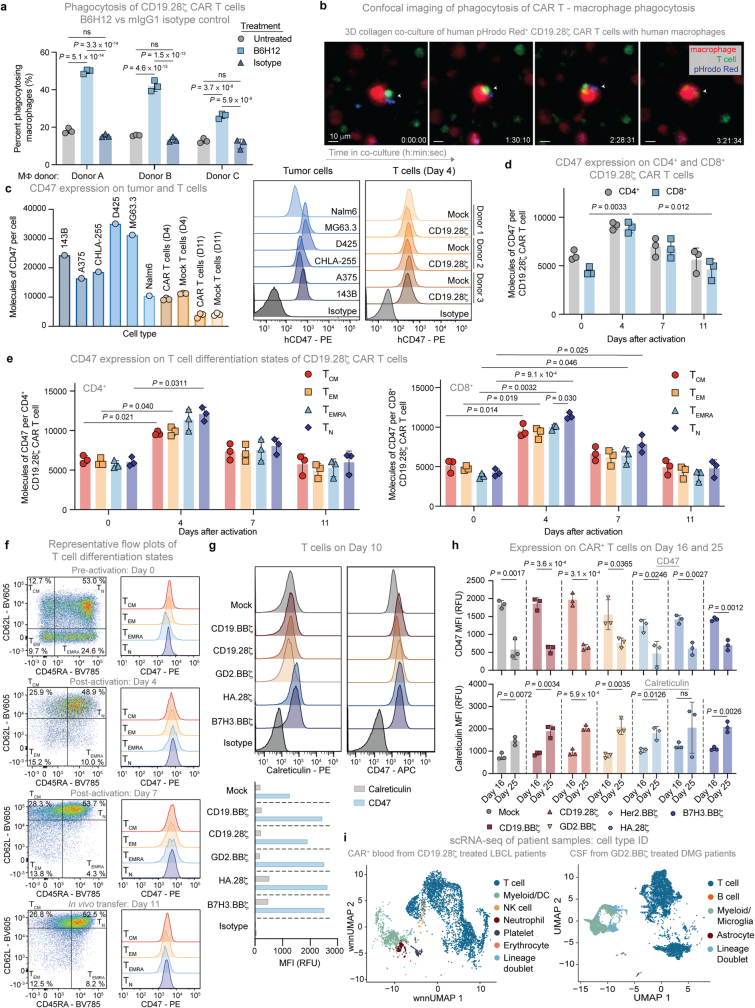
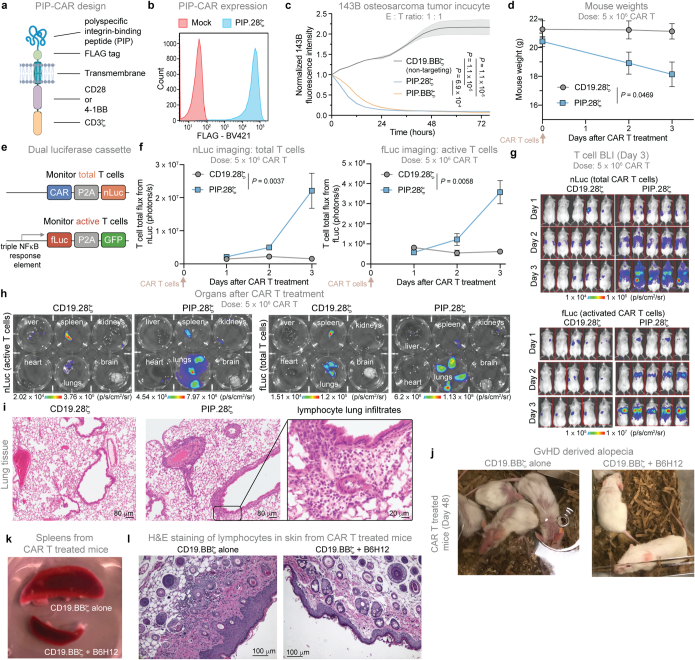
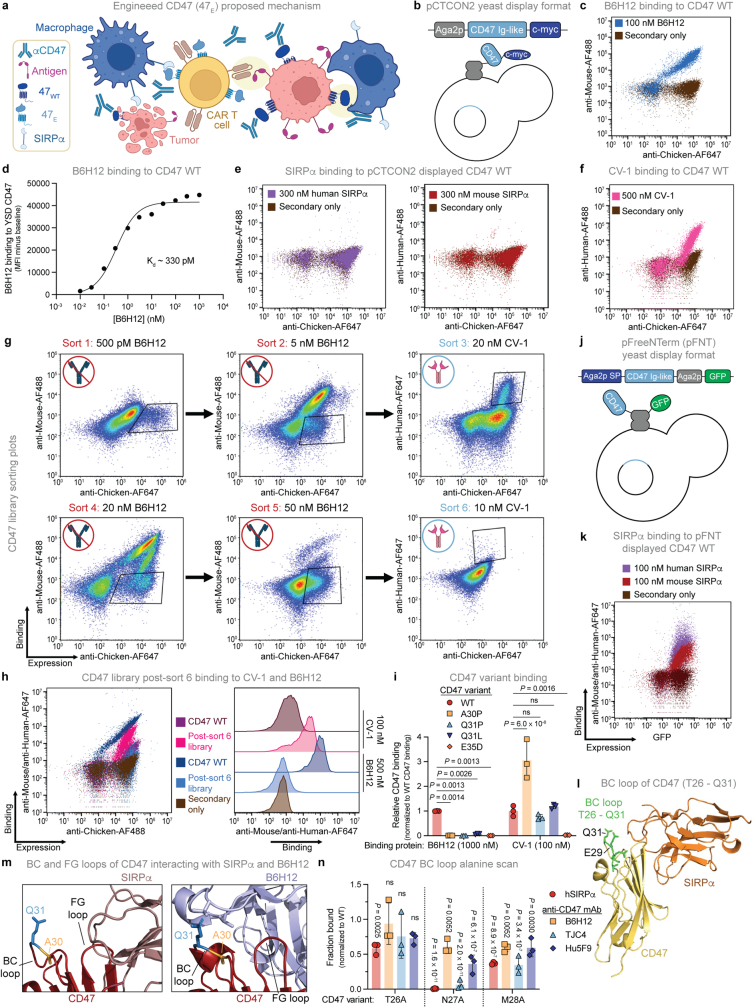
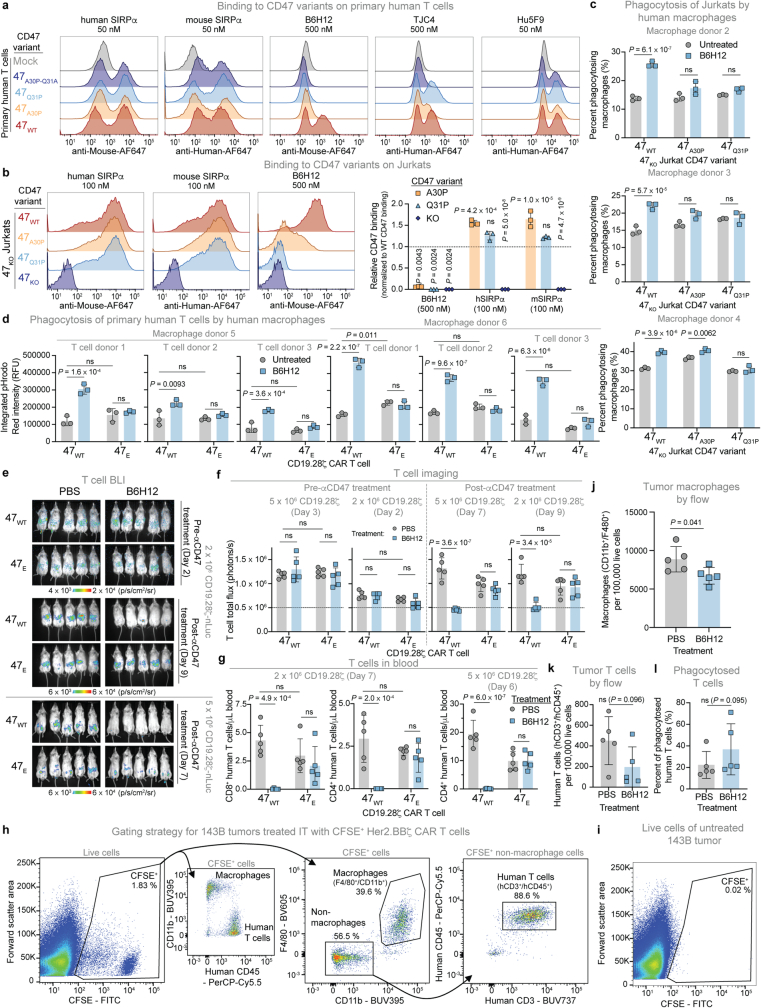
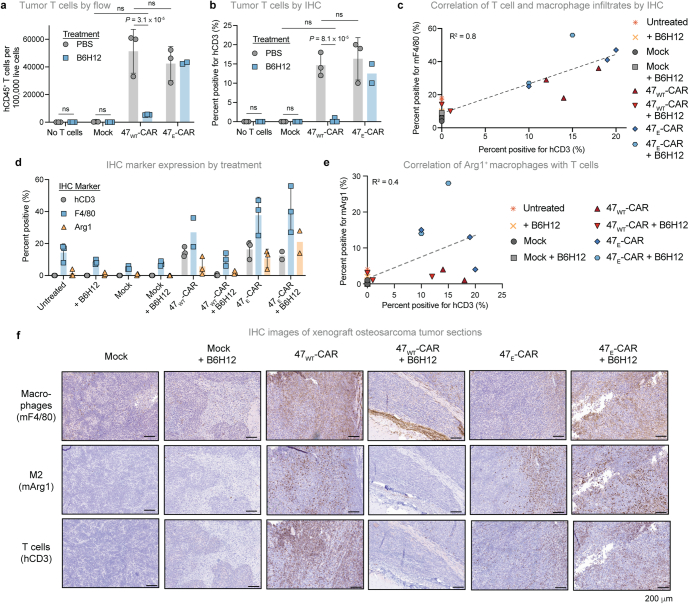
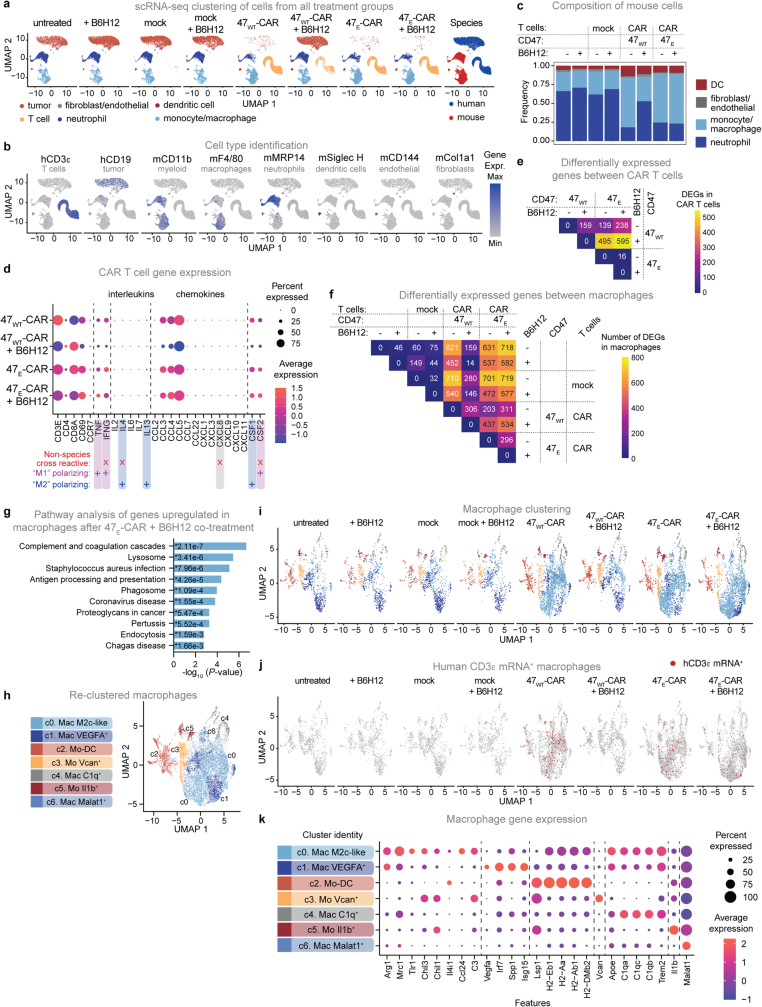
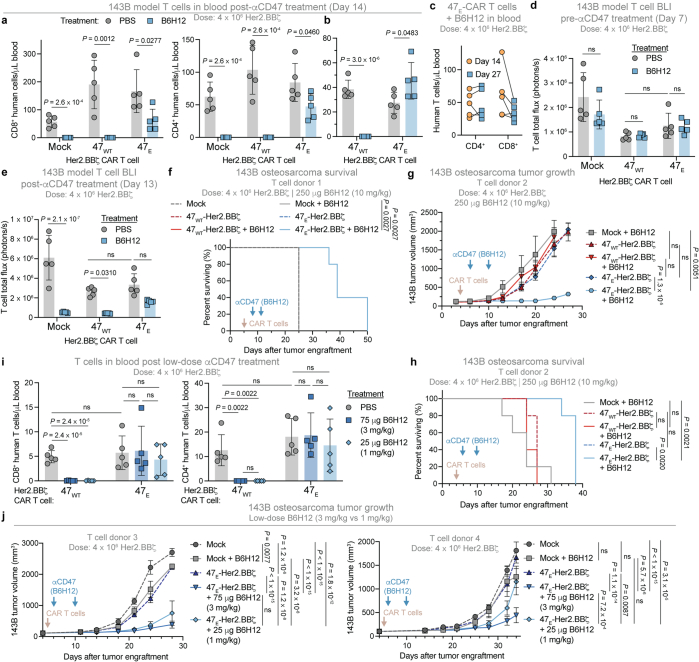
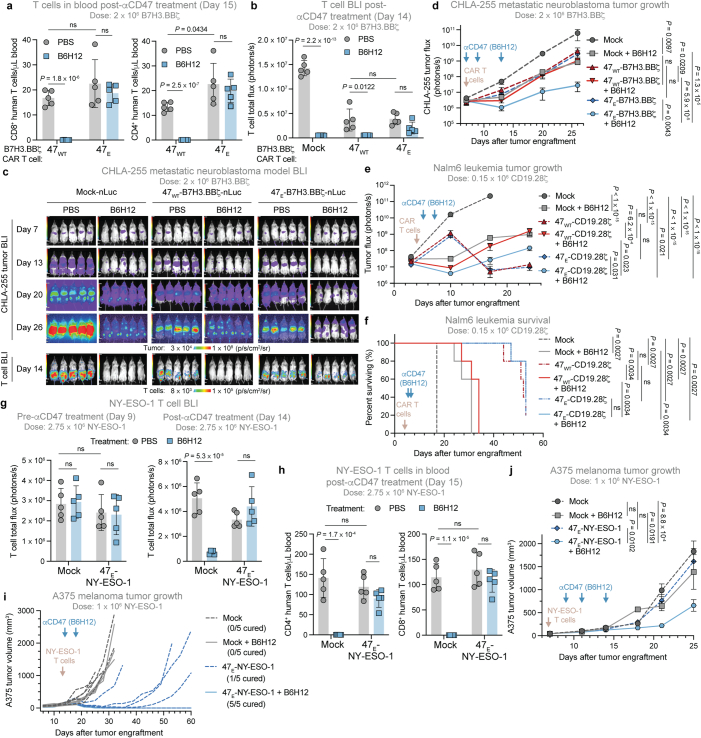
Adoptively transferred T cells and agents designed to block the CD47-SIRPα axis are promising cancer therapeutics that activate distinct arms of the immune system1,2. Here we administered anti-CD47 antibodies in combination with adoptively transferred T cells with the goal of enhancing antitumour efficacy but observed abrogated therapeutic benefit due to rapid macrophage-mediated clearance of T cells expressing chimeric antigen receptors (CARs) or engineered T cell receptors. Anti-CD47-antibody-mediated CAR T cell clearance was potent and rapid enough to serve as an effective safety switch. To overcome this challenge, we engineered the CD47 variant CD47(Q31P) (47E), which engages SIRPα and provides a 'don't eat me' signal that is not blocked by anti-CD47 antibodies. TCR or CAR T cells expressing 47E are resistant to clearance by macrophages after treatment with anti-CD47 antibodies, and mediate substantial, sustained macrophage recruitment to the tumour microenvironment. Although many of the recruited macrophages manifested an M2-like profile3, the combined therapy synergistically enhanced antitumour efficacy. Our study identifies macrophages as major regulators of T cell persistence and illustrates the fundamental challenge of combining T-cell-directed therapeutics with those designed to activate macrophages. It delivers a therapeutic approach that is capable of simultaneously harnessing the antitumour effects of T cells and macrophages, offering enhanced potency against solid tumours.


Conflict of interest statement

S.A.Y.-H., J.T., B.J.M., J.R.C. and C.L.M. are listed as coinventors on a patent related to this work (PCT/US2024/013209, submitted by the board of trustees of the Leland Stanford Junior University). C.L.M. holds equity in CARGO Therapeutics, Link Cell Therapies and Ensoma, which are developing CAR-based therapies; consults for CARGO, Link, Immatics, Ensoma and Red Tree Capital; and receives research funding from Lyell Immunopharma and Tune Therapeutics. S.A.Y.-H. is a consultant for Quince Therapeutics. J.T. is a consultant for Dorian Therapeutics. L.L. and E.S. are consultants for and hold equity in Lyell Immunopharma. L.L. is a cofounder of, consults for and holds equity in CARGO Therapeutics. O.K. is a senior fellow with ARTIS Ventures. C.J.K. is founder and scientific advisory board member for NextVivo, Surrozen and Mozart Therapeutics. R.G.M. is a co-founder of and holds equity in Link Cell Therapies; and is a consultant for NKarta, Arovella Pharmaceuticals, Innervate Radiopharmaceuticals, GammaDelta Therapeutics, Aptorum Group, Zai Labs, Immunai, Gadeta, FATE Therapeutics (DSMB) and Waypoint Bio. I.L.W. is a director, stockholder in and consultant for Forty Seven (but not Gilead); a co-founder of and director and consultant for Bitterroot Bio and PHeast, and a co-founder of 48. I.L.W. is also on the scientific advisory board of Appia. E.S consults for Lepton Pharmaceuticals and Galaria. J.R.C. is a cofounder and equity holder of Trapeze Therapeutics, Combangio and Virsti Therapeutics; has financial interests in Aravive, Xyence Therapeutics and CARGO Therapeutics; and is a member of the board of directors of Ligand Pharmaceuticals and Revel Pharmaceuticals. The other authors declare no competing interests.

Figures

Fig. 1
Fig. 1. Anti-CD47 antibodies abrogate adoptively transferred T cell efficacy through macrophage-mediated T cell depletion.
a, 143B osteosarcoma tumour growth after treatment with HER2-BBζ CAR T cells with or without B6H12. b, MG63.3 osteosarcoma tumour growth after treatment with B7H3-BBζ or GD2-BBζ CAR T cells with or without B6H12. c, T cells from blood and tumour in the MG63.3 model at day 30. Data are mean ± s.d. of n = 3 mice. d, A375 melanoma tumour growth after treatment with NY-ESO-1 TCR cells with or without B6H12. e, T cells in the blood of mice in the A375 model at day 17. f, Nalm6 tumour growth after treatment with CD19-BBζ CAR T cells with or without CV-1 (Fc-dead). g, T cells in the blood of mice in the Nalm6–CV-1 model at day 11. Data are mean ± s.d. of n = 3 (CD19-BBζ) or n = 4 (CD19-BBζ + CV-1) mice. h, Nalm6 leukaemia tumour growth after treatment with CD47 knock out (47KO) CD19-28ζ CAR T cells. i, T cell BLI in the Nalm6–47KO CAR T cell model at day 11. j, Nalm6 leukaemia tumour growth after treatment with CD47-overexpressing (47OE) CD19-28ζ CAR T cells. k, T cells on day 45 after CAR treatment in the blood of mice in the Nalm6–47OE CAR T cell model. Data are mean ± s.d. of n = 4 (0.1 × 106 CD19-28ζ) or n = 5 (all others) mice. l, T cell BLI after macrophage depletion (left). Data are mean ± s.d. of n = 9 (depleted) or n = 10 (non-depleted) mice. Right, the fold change in T cell BLI, with or without B6H12, after macrophage depletion. Data are mean ± s.d. of n = 4 (depleted + PBS) or n = 5 (all others) mice. m, T cell BLI before and after B6H12, after macrophage depletion. For a, b, d, f, h and j, data are mean ± s.e.m. of n = 5 mice per arm for tumour growth. For e and i, data are mean ± s.d. of n = 5 mice. Statistical analysis was performed using two-way analysis of variance (ANOVA) with Tukey’s multiple-comparison test (a, b, d, f, h, j and l (right)), unpaired two-tailed Student’s t-tests (c, e, g, i, k (right) and l (left)) and two-tailed Mann–Whitney U-tests (k, left); NS, not significant. Source Data
Fig. 2
Fig. 2. Macrophages phagocytose CAR T cells in vitro and in patients.
a, Phagocytosis of co-cultured CFSE+ CAR T cells by primary human macrophages by flow cytometry. Data are mean ± s.d. of n = 3 triplicate wells. Reproducible across n = 4 macrophage donors. b, The fold change in CD47 and calreticulin expression on CAR T cells between days 25 and 16 of culture by flow cytometry. Data are mean ± s.d. of fold change of values (day 25/day 16) derived from n = 3 donors. MFI, mean fluorescence intensity. c, Microscopy images of Wright-Giemsa-stained histiocytes engulfing lymphocytes collected from the CSF of a patient with LBCL who was treated with CD19-28ζ CAR T cells. Representative of a sample collected from a single patient. Scale bars, 10 μm. d, scRNA-seq landscapes, with CAR mRNA shown in red. Left, n = 6,316 CAR+ cells sorted from blood of n = 9 axi-cel CD19-28ζ-treated patients with LBCL collected on day 7 after CAR T cell infusion. Right, n = 25,598 cells from the CSF of n = 4 GD2.BBζ-treated patients with DMG. Both sampled to 500 cells per patient sample. Statistical analysis was performed using unpaired two-tailed Student’s t-tests (a and b); for b, comparison is between expression values of the indicated group on day 16 versus day 25. Source Data
Fig. 3
Fig. 3. Anti-CD47 therapy can be used as a safety switch.
a, The survival of 143B tumours after treatment with CD19-BBζ (non-targeting), HER2-BBζ (targeting), PIP-28ζ or PIP-BBζ CAR T cells. n = 5 mice per arm. b, Human IFNγ in the blood of mice with or without 143B-CD19 tumours, treated with CD19-BBζ, PIP-28ζ or PIP-BBζ CAR T cells on day 4, as determined using LEGENDPlex quantitative flow cytometry. Data are mean ± s.d. of n = 5 (PIP-28ζ or PIP-BBζ with 143B-CD19 tumour), n = 4 (CD19-BBζ with 143B-CD19 tumours), n = 3 (mock with 143B-CD19 tumour and CD19-BBζ, PIP-28ζ or PIP-BBζ without tumours) and n = 1 (mock without tumour) mice. c, Mouse weights after PIP-28ζ CAR T cell treatment with or without B6H12. Data are mean ± s.d. of n = 5 mice per arm. Representative of two independent experiments. d, The survival of mice treated with PIP-28ζ CAR T cells with or without B6H12. n = 5 mice per arm. Representative of two independent experiments. e, T cell BLI after treatment with PIP-28ζ CAR T cells with or without B6H12. Data are mean ± s.e.m. of n = 5 mice per arm. f, IL-2 (left) and IFNγ (right) in the blood of mice treated with PIP-28ζ CAR T cells with or without B6H12 on day 4, as determined using LEGENDPlex quantitative flow cytometry. Data are mean ± s.d. of n = 5 mice. Statistical analysis was performed using log-rank Mantel–Cox tests (a and d), unpaired two-tailed Student’s t-tests (b), two-way ANOVA (c and e) and one-way ANOVA with Tukey’s multiple-comparison test (f). Source Data
Fig. 4
Fig. 4. An engineered variant of CD47 retains binding to SIRPα, but no longer binds to anti-CD47 antibodies.
a, Consensus mutations identified in yeast sequenced after sorts 4, 5 and 6. Frequencies of identified mutations out of n = 13, 16 and 12 sequenced clones for sorts 4, 5 and 6, respectively. b, Normalized binding of B6H12, CV-1, human SIRPα and mouse SIRPα to yeast-displayed CD47 WT, CD47(A30P) and CD47(Q31P). c, Crystal structures of CD47 (red) binding to SIRPα (dark pink, left) and B6H12 (light blue, right); residues Ala30 (gold) and Gln31 (blue) are indicated by boxes. d, Normalized binding of human SIRPα, B6H12, TJC4 and Hu5F9 to yeast-displayed CD47 WT, CD47(A30P), CD47(Q31P), CD47(A30P/Q31A) and CD47(E29A). e, Normalized binding of B6H12, TJC4, human SIRPα and mouse SIRPα to full-length CD47 WT, CD47(A30P) and CD47(Q31P) expressed on primary human T cells. Data are mean ± s.d. of n = 3 donors, normalized to the fraction binding to CD47 WT. f, Phagocytosis of Jurkat cells with endogenous CD47 KO expressing CD47 WT, CD47(A30P) or CD47(Q31P), by primary human macrophages. Data are mean ± s.d. of triplicate wells (n = 3). Reproducible across n = 4 macrophage donors. g, CD8+ T cells in the blood on day 6 after treatment with 47E CD19-28ζ CAR T cells with or without B6H12. Data are mean ± s.d. of n = 5 mice. For b and d, data are mean ± s.d. of n = 3 individual yeast clones, normalized to MFI from binding to CD47 WT. Statistical analysis was performed using two-way ANOVA with Tukey’s multiple-comparison test (b and dg). For d and e, the comparisons are between the indicated groups and binding to cells expressing CD47 WT. Source Data
Fig. 5
Fig. 5. 47E T cell therapy plus anti-CD47 treatment leads to enhanced antitumour efficacy through recruitment of distinct macrophage populations.
a, Macrophages identified by flow cytometry (flow; left axis) and immunohistochemistry (IHC; right axis) of excised 143B osteosarcoma tumours treated with no T cells, mock, 47WT or 47E HER2-BBζ CAR T cells with or without B6H12. Data are the mean of n = 2 (flow: 47CAR + B6H12) or mean ± s.d. of n = 3 (all others) mice. b, The composition of cells identified using scRNA-seq from tumours treated as in a. n = 53,062 cells from 8 experimental conditions. DC, dendritic cells. c, Enrichr pathway analysis of the top 100 upregulated genes in CAR T cells from tumours treated with 47E CAR T cells + B6H12 versus 47WT CAR T cells + B6H12. The results show the P value (two-sided Fisher’s exact test) for each pathway. d, The composition of macrophage clusters (c0–c6) after subsetting and reclustering, coloured by cluster, across the experimental conditions described in a. n = 13,082 cells from 8 experimental conditions. Mac, macrophage; Mo-DC, monocyte-derived dendritic cell; Mo, monocyte. e, T cell BLI in 143B-tumour-bearing mice treated with 47WT or 47E Antares HER2-BBζ CAR T cells with or without B6H12 on day 13. Tumours were engrafted in the right leg. f, T cells in the blood of 143B-tumour-bearing mice, treated as described in e, on day 14. Data are mean ± s.d. of n = 5 mice per arm. g, 143B tumour growth after treatment as described in e. Data are mean ± s.e.m. of n = 5 mice per arm. h, T cells in the blood of A375-tumour-bearing mice, treated with 47E NY-ESO-1 TCR T cells with or without B6H12, on day 15. Data are mean ± s.d. of n = 5 mice per arm. i, A375 melanoma tumour growth treated as in h. Data are mean ± s.e.m. of n = 5 mice per arm. Statistical analysis was performed using two-way ANOVA with Tukey’s multiple-comparison test (a, b, f, g and i) and unpaired two-tailed Student’s t-tests (h). Source Data
Extended Data Fig. 1
Extended Data Fig. 1. Anti-CD47 therapy blunts CAR and TCR T cell efficacy by depleting adoptively transferred T cells.
(a) Her2.BBζ-CAR ± B6H12 treated 143B tumour survival. n = 5 mice/arm. (b) B7H3.BBζ- or GD2.BBζ-CAR ± B6H12 treated MG63.3 tumour survival. n = 5 mice/arm. (c) B7H3.BBζ-CAR ± B6H12 treated D425 tumour growth by BLI. CD19.BBζ-CAR is included as a non-tumour targeting control. Mean ± SEM of n = 5 (B6H12) or n = 6 (all others) mice/arm. Representative of two independent experiments. (d) B7H3.BBζ-CAR ± B6H12 treated D425 tumour survival. CD19.BBζ-CAR is included as a non-tumour targeting control. n = 5 (B6H12) or n = 6 (all others) mice per treatment arm. Representative of two independent experiments. (e) Representative flow cytometry plots of hCD45+ T cells identified in the blood and tumour in the B7H3.BBζ-CAR ± B6H12 treated MG63.3 model on day 30 post tumour engraftment. (f) Representative flow cytometry plots of hCD45+ T cells identified in the blood of non-tumour bearing mice co-treated with CD19.28ζ-CAR T cells and either PBS, B6H12, or mIgG1 isotype control. Representative of two independent experiments. (g) hCD8+ (top) and hCD4+ (bottom) T cells in the blood of mice on day 5 in the isotype control model, treated as in (f). Mean ± SD of n = 5 mice. Representative of two independent experiments. (h) T cells (hCD4+ and hCD8+) in the blood of mice on day 12 in Her2.BBζ ± B6H12 treated mice in the 143B model. Mean ± SD of n = 5 mice. (i) Low-dose NY-ESO-1-TCR ± B6H12 treated A375 tumour survival. n = 5 mice/arm. (j) High-dose NY-ESO-1-TCR ± B6H12 treated A375 tumour growth. Mean ± SEM of n = 5 mice/arm. (k) T cells (hCD4+ and hCD8+) in the blood by flow cytometry on day 16 of mice treated with high-dose NY-ESO-1-TCR ± B6H12 in the A375 model. Mean ± SD of n = 5 mice. (l) High-dose CD19.28ζ-CAR ± B6H12 treated Nalm6 tumour growth by BLI. Mean ± SEM of n = 5 mice/arm. (m) Low-dose CD19.28ζ-CAR ± B6H12 treated Nalm6 tumour growth by BLI. Mean ± SEM of n = 5 mice/arm. (n) Images of Nalm6 tumour BLI in the high-dose (left) and low-dose (right) CAR-T model on day 17. (o) Low-dose CD19.28ζ-CAR ± B6H12 treated Nalm6 survival. n = 5 mice/arm. (p) T cell BLI in the high-dose CAR-T – Nalm6 model, treated as in (l). Mean ± SEM of n = 5 mice/arm. (q) T cell BLI in the low-dose CAR-T – Nalm6 model, treated as in (m). Mean ± SEM of n = 5 mice/arm. (r) Images of CD19.28ζ-nLuc-CAR T cell BLI in the low-dose CAR T – Nalm6 model, treated as in (m), on day 11. (s) Quantification of T cells by flow cytometry from the spleen in the high-dose CAR T – Nalm6 model, treated as in (l). Mean ± SD of n = 4 mice. [(a), (b), (d), (i), (o)] Log-rank Mantel-Cox test. [(c), (j), (l), (m), (p), (q)] Two-way analysis of variance (ANOVA) test with Tukey’s multiple comparison test. [(g), (h), (k), (s)] Unpaired two-tailed Student’s t test. For all: ns = not significant. Source Data
Extended Data Fig. 2
Extended Data Fig. 2. Treatment with CV-1 or CD47 knock-out leads to T cell depletion and ablation of antitumour efficacy.
(a) CD19.BBζ-CAR ± CV-1 (Fc-dead) treated Nalm6 tumour survival. n = 5 mice/arm. (b) Images of Nalm6 BLI on day 11 of high-dose CD19.BBζ-CAR ± CV-1 treated mice, treated as in (a). (c) Low-dose CD19.28ζ-CAR ± CV-1 (Fc-dead) treated Nalm6 tumour growth. Mean ± SEM of n = 5 mice/arm. (d) Images of Nalm6 BLI of low-dose CD19.28ζ-CAR ± CV-1 treated mice, treated as in (c). (e - f) Images (e) and quantification (f) of T cell BLI post CV-1 treatment of Nalm6 tumour-bearing mice. Top: high-dose CD19.BBζ-CAR ± CV-1, treated as in (a), on day 9 (four days post CV-1 treatment). Bottom: low-dose CD19.28ζ-CAR ± CV-1, treated as in (c), day 11 (six days post CV-1 treatment). For (f): mean ± SD of n = 5 mice for each dose condition. (g) CRISPR/Cas9 mediated CD47 knock-out (CD47KO) efficiency in primary human T cells by flow cytometry. CD47WT cells are CD47KO with exogenous expression of wild-type CD47. Representative of n > 3 donors. (h) Images of Nalm6 tumour progression (top five rows) and T cells on day 11 (bottom row) by BLI in the Nalm6 – 47KO-CD19.28ζ-CAR T model. (i) Survival of Nalm6 bearing mice shown in (h). n = 5 mice per treatment arm. (j) Representative flow cytometry plots of hCD45+ T cells identified in the blood of 47WT- or 47KO-CD19.28ζ-nLuc-CAR ± B6H12 treated, non-tumour bearing mice. (k) Images of T cell BLI following treatment with 47WT- or 47KO-CD19.28ζ-nLuc-CAR T cells before and after B6H12 treatment. (l) T cell BLI of mice shown in (k) treated with 47WT- or 47KO-CD19.28ζ-nLuc-CAR T, before and after B6H12 treatment. Dashed line indicates limit of detection. Mean ± SD of n = 5 mice. (m) hCD8+ and hCD4+ T cells in the blood on day 6 or 7 by flow cytometry following treatment 47WT- or 47KO-CD19.28ζ-nLuc-CAR T ± B6H12 in separate experiments, treated as in (k). Mean ± SD of n = 5 mice. [(c), (l), (m)] Two-way analysis of variance (ANOVA) test with Tukey’s multiple comparison test. ns = not significant. [(f - top)] Two-tailed Mann-Whitney test. [(f - bottom)] Unpaired two-tailed Student’s t test. Source Data
Extended Data Fig. 3
Extended Data Fig. 3. CD47 over-expression (47OE) does not alter T cell function in vitro, but enhances efficacy in vivo.
(a) Expansion of CD19.28ζ-, 47OE-CD19.28ζ-, AAVS1KO-CD19.28ζ-, or 47KO-CD19.28ζ-CAR-T cells over days in culture. Mean ± SD of n = 3 T cell donors. (b) CD19.28ζ-, 47OE-CD19.28ζ-, AAVS1KO-CD19.28ζ-, or 47KO-CD19.28ζ-CAR-T cell viability over days in culture. Mean ± SD of n = 3 T cell donors. (c) Nalm6-GFP tumour killing by mock, CD19.28ζ-, 47OE-CD19.28ζ-, AAVS1KO-CD19.28ζ-, or 47KO-CD19.28ζ-CAR-T cells at a 1:1 E:T ratio measured via IncuCyte assay. Mean ± SD of n = 3 T cell donors, with each datapoint derived from the average of n = 3 triplicate wells per donor. Mock, CD19.28ζ, and 47OE-CD19.28ζ are shared conditions duplicated in (d). (d) Nalm6-GFP tumour killing by mock, CD19.28ζ-, or 47OE-CD19.28ζ-CAR T cells ± B6H12 at a 1:1 E:T ratio measured via IncuCyte assay. Mean ± SD of n = 3 T cell donors, with each datapoint derived from the average of n = 3 triplicate wells per donor. Conditions without B6H12 are shared conditions duplicated in (c). (e - f) IFN-γ (e) and IL-2 (f) secretion upon co-culture for 24 h with and without Nalm6 tumour cells at a 1:1 E:T ratio of mock, CD19.28ζ-, 47OE-CD19.28ζ-, AAVS1KO-CD19.28ζ- or 47KO-CD19.28ζ-CAR-T measured via ELISA. Mock, CD19.28ζ-, and 47OE-CD19.28ζ-CAR-T cells were also assessed in the presence of B6H12 and Nalm6. Mean ± SD of n = 3 T cell donors, with each datapoint derived from the average of n = 3 triplicate wells per donor. (g - l) Annexin V (g), CD69 (h), CD39 (i), TIM3 (j), LAG3 (k), and PD1 (l) expression upon co-culture for 24 h with and without Nalm6 tumour cells at a 1:1 E:T ratio of mock, CD19.28ζ-, 47OE-CD19.28ζ-, AAVS1KO-CD19.28ζ- or 47KO-CD19.28ζ-CAR-T measured via flow cytometry. Mock, CD19.28ζ-, and 47OE-CD19.28ζ-CAR-T cells were also assessed in the presence of B6H12 and Nalm6. Mean ± SD of n = 3 T cell donors. (m) CD47 and CAR (second from left) expression on T cells by flow cytometry after CD47 over-expression (47OE). Representative of n > 3 donors. (n) Images of Nalm6 BLI on day 45 after dosing with CD19.28ζ- or 47OE-CD19.28ζ-CAR-T cells in Nalm6 tumour-bearing mice. (o) CD19.28ζ- or 47OE-CD19.28ζ-CAR T treated Nalm6 tumour growth by BLI. Mean ± SEM of n = 5 mice/arm. (p) CD11b+/F4/80+ macrophages collected via peritoneal lavage by flow cytometry on day 13 after clodronate treatment. Mean ± SD of n = 7 (macrophage depleted) or n = 9 (macrophage non-depleted) mice. (q) Representative flow plots and gating strategy for detection of macrophages in samples collected following peritoneal lavage. (r) CD19.28ζ-nLuc-CAR T BLI before (day 7) and after (day 9) treatment with B6H12 of mice ± macrophage depletion (started on day 0). Mean ± SD of n = 4 (macrophage depleted, PBS treated) or n = 5 (all other groups) mice. [(a), (b), (c), (d), (e), (f), (g), (h), (i), (j), (k), (l), (o), (r)] Two-way analysis of variance (ANOVA) test with Tukey’s multiple comparison test. ns = not significant. [(p)] Unpaired two-tailed Student’s t test. Source Data
Extended Data Fig. 4
Extended Data Fig. 4. CD47 expression is uniform among CAR T cell subtypes and decreases over time in culture.
(a) Phagocytosis of CFSE labelled CD19.28ζ-CAR-T cells from three donors by primary human macrophages from three donors by flow cytometry, following one hour of co-culture. CAR T cells were either untreated or treated with B6H12 or mIgG1 isotype control prior to addition of macrophages. Mean ± SD of n = 3 T cell donors, with each datapoint derived from the average of n = 3 triplicate wells per donor. (b) Representative confocal images of primary human CD19.28ζ-CAR-T cell phagocytosis by a primary human macrophage after treating with B6H12 in a three-dimensional collagen matrix. Images from left to right represent 0 min (initial image), 1 h 30 min, 2 h 28 min, and 3 h 21 min of T cell – macrophage co-incubation. CAR T cells (green) and macrophages (red) were labelled separately with lipophilic dyes. CAR T cells were also labelled with pH sensitive pHrodo Red dye (shown in blue) prior to B6H12 treatment. White arrows indicate a phagocytic event. See SI Video 1 for accompanying time-lapse video. Images are representative across n = 2 experiments. (c) CD47 expression on tumour cells, mock T cells, and CD19.28ζ-CAR-T cells by QuantiBrite quantitative flow cytometry. T cells were assessed on day 4 and day 11 of culture. Quantification of histograms shown on the left for each cell type. Representative of n = 1 tumour sample and n = 3 T cell donors and reproducible across n > 3 experiments. (d) CD47 expression on CD4+ and CD8+ CD19.28ζ-CAR-T cells by QuantiBrite quantitative flow cytometry. Cells were assessed by flow cytometry on day 0 (prior to activation), day 4 (after activation bead removal), day 7, and day 11 (time of typical transfer in vivo). Mean ± SD of n = 3 T cell donors. Only significant differences are shown. All other groups are not significantly different, comparing between the same subtype over time and between subtypes at the same timepoint. (e) CD47 expression on TN, TCM, TEM, and TEMRA CD4+ (left) and CD8+ (right) CD19.28ζ-CAR-T cell subtypes on days 0, 4, 7, and 11 post-activation by QuantiBrite quantitative flow cytometry. Mean ± SD of n = 3 T cell donors. Only significant differences are shown. All other groups are not significantly different, comparing between the same subtype over time and between subtypes at the same timepoint. (f) Representative flow cytometry plots of CD19.28ζ-CAR-T cells pre- (day 0) and post-activation (days 4, 7, and 11). Left column: gating for T cell differentiation states, T naïve (CD45RA+/CD62L+ | TN), T central memory (CD45RA/CD62L+ | TCM), T effector memory (CD45RA/CD62L | TEM), and T effector memory re-expressing CD45RA (CD45RA+/CD62L | TEMRA). Right column: histograms of CD47 expression across T cell differentiation states. (g) Calreticulin (left) and CD47 (right) expression on CAR-T cells by flow cytometry on day 10 of culture. Quantification of histograms shown on the bottom for each type of CAR-T cell. Representative of n = 3 donors. (h) Quantification of CD47 (top) and calreticulin (bottom) expression on CAR+ T cells on day 16 and day 25 of culture by flow cytometry. Mean ± SD of n = 3 donors. (i) Single cell landscapes colour coded for cell type. Top: Weighted nearest neighbour (wnn) UMAP derived from n = 6,316 CAR+ cells sorted from the blood collected on day 7 after CAR T infusion of n = 9 axi-cel (CD19.28ζ) treated LBCL patients, sampled to 500 cells/patient sample. Bottom: UMAP derived from n = 25,598 cells from the CSF of n = 4 GD2.BBζ treated diffuse midline glioma (DMG) patients, sampled to 500 cells/patient sample. [(a), (d), (e)] Two-way analysis of variance (ANOVA) test with Tukey’s multiple comparison test. [(h)] Unpaired two-tailed Student’s t test. For all: ns = not significant. Source Data
Extended Data Fig. 5
Extended Data Fig. 5. Anti-CD47 can limit toxicities from a pan-tumour integrin targeting PIP-CAR and GvHD.
(a) Cartoon of the PIP-CAR design. The diagram was created using BioRender. (b) PIP.28ζ-CAR expression by flow cytometry. Representative of n = 3 donors. (c) 143B-GFP tumour killing by PIP.28ζ-, PIP.BBζ-, or non-tumour targeting CD19.BBζ-CAR T cells at a 1:1 E:T ratio measured via IncuCyte assay. Mean ± SD of n = 3 triplicate wells and reproducible in three independent experiments with different donors. (d) Weights of mice following treatment with CD19.28ζ- or PIP.28ζ-CAR-T. Mean ± SEM of n = 5 mice/arm. (e) Cartoon of the dual luciferase reporter design for tracking CAR-T activity in vivo. nLuc is linked to CAR expression, fLuc is linked to NF-κB activation. (f) T cell BLI of mice treated with CD19.28ζ- or PIP.28ζ-nLuc_NFκB-fLuc-CAR T cells. Left: nLuc (total T cells). Right: fLuc (active T cells). Mean ± SEM of n = 5 mice/arm. (g) Images of T cell BLI of mice treated as in (f), 3 days after infusion. Top: nLuc (total T cells). Bottom: fLuc (activated T cells). n = 5 mice/arm. (h) Representative images of BLI from organs extracted from mice treated as in (f), four days after CAR T administration. Left: nLuc (total T cells). Right: fLuc (active T cells). Representative of n = 5 mice/arm. (i) Representative hematoxylin and eosin (H&E) stained images of lung tissue collected from mice treated as in (f), four days after CAR T administration. Right panel is a higher magnification view of the boxed region in the middle panel. Images are representative of n = 3 mice/arm. (j – l) Representative images of (j) mice demonstrating GvHD derived alopecia (day 48 post-CAR T infusion), (k) spleens from mice (collected on day 48 post-CAR T infusion), and (l) H&E staining of skin sections (collected on day 48 post-CAR T infusion) from mice treated with CD19.BBζ-CAR T ± B6H12. Representative of n = 5 mice/arm. [(c), (d), (f)] Two-way analysis of variance (ANOVA) test with Tukey’s multiple comparison test. Source Data
Extended Data Fig. 6
Extended Data Fig. 6. Engineered variants of CD47 retain SIRPα binding and demonstrate a loss of binding to some, but not all, anti-CD47 antibodies.
(a) Engineered CD47 (47E) mechanism: αCD47 antibodies bind tumour cells, but not 47E-T cells, triggering tumour-specific phagocytosis. The diagram was created using BioRender. (b) Cartoon of yeast displayed CD47 Ig-like domain using the pCTCON2 vector. CD47 is displayed as an N-terminal fusion. (c) Binding of 100 nM B6H12 to yeast displayed CD47 in pCTCON2 by flow cytometry. Representative of n = 3 independent experiments. (d) Binding curve of B6H12 to yeast displayed CD47 in pCTCON2, measured over multiple concentrations by flow cytometry. MFI of n = 1 experiment. (e) Binding of 300 nM human (top) and mouse (bottom) SIRPα to yeast displayed CD47 in pCTCON2 by flow cytometry. Data are representative of n = 3 independent experiments. (f) Binding of 500 nM CV-1 to yeast displayed CD47 in pCTCON2 by flow cytometry. Data are representative of n = 3 independent experiments. (g) Flow cytometry sorting plots of all six sorts of the CD47 library, indicating negative sorts to B6H12 and positive sorts to CV-1. Collected population indicated by the black box in each plot. (h) Binding of 500 nM B6H12 or 100 nM CV-1 to the yeast displayed CD47 library population collected after sort 6 or yeast displayed WT CD47. Data are representative of n = 2 independent experiments. (i) Binding of 1 μM B6H12 or 100 nM CV-1 to CD47 variants displayed on yeast using the pCTCON2 vector. Mean ± SD of n = 3 individual yeast clones, normalized to MFI from binding to 47WT. (j) Cartoon of yeast-displayed CD47 Ig-like domain using the pFreeNTerm (pFNT) vector. CD47 is displayed as a C-terminal fusion, along with GFP to monitor protein expression. (k) Binding of 100 nM human and mouse SIRPα to yeast displayed CD47 in pFNT by flow cytometry. Representative of n = 3 independent experiments. (l) Crystal structure of CD47 (yellow) binding SIRPα (orange) [PDB: 2JJS], identifying the CD47 BC loop (green), containing CD47 residues T26 – Q31. (m) Crystal structures of CD47 (red) binding SIRPα (dark pink, left) [PDB: 2JJS] and B6H12 (light blue, right) [PDB: 5TZU], identifying residues A30 (gold) and Q31 (blue), and the BC and FG loops of CD47. Structures are enlargements of the boxed regions in the full structures shown in Fig. 4c. (n) Binding of 100 nM B6H12, TJC4, Hu5F9, and hSIRPα to yeast displayed 47T26A, 47N27A, and 47M28A variants. Mean ± SD of n = 3 individual yeast clones, normalized to MFI from binding to 47WT. [(i), (n)] Two-way analysis of variance (ANOVA) test with Tukey’s multiple comparison test. ns = not significant. Comparison is between indicated group and binding to CD47 WT expressing cells. Source Data
Extended Data Fig. 7
Extended Data Fig. 7. Expression of 47E on T cells mitigates B6H12 induced phagocytosis due to lack of antibody binding in vitro and in vivo.
(a) Representative flow cytometry histograms of 50 nM hSIRPα, 50 nM mSIRPα, 500 nM B6H12, 500 nM TJC4, and 50 nM Hu5F9 binding to 47WT, 47A30P, 47Q31P, and 47A30P-Q31A over-expressed on primary human T cells. Data are representative of n = 3 different T cell donors in independent experiments. (b) Left: Representative flow cytometry histograms of 100 nM hSIRPα, 100 nM mSIRPα, and 500 nM B6H12 binding to 47WT, 47A30P, and 47Q31P expressed on Jurkats with endogenous 47KO. Right: Binding of B6H12, hSIRPα, and mSIRPα to full-length 47WT, 47A30P, and 47Q31P expressed on Jurkat cells with endogenous 47KO. Mean ± SD of n = 3 independent experiments, normalized to fraction binding to 47WT. (c) Phagocytosis by primary human macrophages from multiple donors of CFSE labelled Jurkats with endogenous 47KO, expressing 47WT, 47A30P, or 47Q31P variants after one hour of co-culture ± B6H12. Mean ± SD of n = 3 triplicate wells. (d) Phagocytosis by primary human macrophages from two donors of pHrodo Red labelled primary human CD19.28ζ-CAR-T cells from three donors with endogenous 47KO, expressing 47WT or 47E (47Q31P) after three hours of co-culture ± B6H12. Mean ± SD of n = 3 triplicate wells. (e) Images of T cell BLI following treatment with 47WT- or 47E-CD19.28ζ-nLuc-CAR-T cells ± B6H12 in non-tumour bearing mice. (f) T cell BLI before and after αCD47 treatment, of mice treated as in (e). Mean ± SD of n = 5 mice. (g) hCD8+ and hCD4+ T cells in the blood on day 6 by flow cytometry of mice treated as in (e). Mean ± SD of n = 5 mice. (h) Representative flow plots and gating strategy for detection of CFSE+ macrophages and T cells in dissociated 143B tumour samples in the in vivo phagocytosis model treated with Her2.BBζ-CAR T cells ± B6H12. Representative of n = 5 mice/arm. (i) Representative flow plot and gating strategy for detection of CFSE+ cells of a dissociated 143B tumour from a mouse that did not receive CAR T cells. (j) mF4/80+/CD11b+ macrophages identified by flow cytometry of dissociated tumours treated as in (h). Mean ± SD of n = 5 mice. (k) hCD3+/hCD45+ human T cells identified by flow cytometry of dissociated tumours treated as in (h). Mean ± SD of n = 5 mice. (l) Percentage of phagocytosed T cells identified in each dissociated tumour, treated as in (h), calculated as the number of CFSE+ macrophages per 100,000 lives cells per sample divided by the total number of CFSE+ macrophages and T cells per 100,000 live cells per sample, identified by flow cytometry. Mean ± SD of n = 5 mice. [(b), (c), (d), (f), (g)] Two-way analysis of variance (ANOVA) test with Tukey’s multiple comparison test. ns = not significant. (b) comparison is between indicated group and binding to 47WT expressing cells. [(j), (k)] Unpaired two-tailed Student’s t test. [(l)] Two-tailed Mann-Whitney Test. Source Data
Extended Data Fig. 8
Extended Data Fig. 8. CAR-T treatment increases tumour infiltration of macrophages.
(a) hCD45+ T cells identified by flow cytometry of dissociated 143B tumours in the 143B correlative model, treated with no T cells, mock, 47WT- or 47E-Her2.BBζ-CAR-T cells ± B6H12. Mean of n = 2 (47E-CAR + B6H12) or mean ± SD n = 3 (all other samples) mice. (b) Percent positivity for hCD3 T cells identified by IHC from tumour sections treated as in (a). Mean of n = 2 (47E-CAR + B6H12) or mean ± SD n = 3 (all other samples) mice. (c) Correlation of hCD3 and mF4/80 staining in IHC sections of tumours treated as in (a). Data points are representative of individual tumours, coloured by treatment group (n = 23). R2 calculated by simple linear regression. (d) Percent positivity for hCD3 (T cells), mArg1 (M2 macrophages), and mF4/80 (total macrophages) cells identified by IHC from tumour sections treated as in (a). Mean of n = 2 (47WT-CAR: F4/80; 47E-CAR + B6H12: CD3; 47E-CAR + B6H12: Arg1) or mean ± SD of n = 3 (all others) mice. (e) Correlation of hCD3 and mArg1 percent positivity by IHC of tumour sections treated as in (a). Datapoints are representative of individual tumours, coloured by treatment group (n = 23). R2 calculated by simple linear regression. (f) Representative images of IHC tumour sections stained for mF4/80, mArg1, and hCD3, treated as in (a). Representative of tumour sections collected from n = 3 mice/arm. [(a), (b)] Two-way ANOVA test with Tukey’s multiple comparison test. ns = not significant. Source Data
Extended Data Fig. 9
Extended Data Fig. 9. CAR-T treatment increases tumour infiltration of distinct macrophage populations.
(a and b) scRNA-seq profile of dissociated tumour and infiltrating immune cells in the 143B correlative model, treated with no T cells, mock, 47WT- or 47E-Her2.BBζ-CAR-T cells ± B6H12. Dots represent individual cells. n = 53,062 cells from 8 experimental conditions with three mice per treatment group, coloured by (a) cell type (left eight plots; UMAPs represent distinct treatment conditions), species (far right), or (b) gene expression level. (c) Composition of murine cells identified via scRNA-seq from 143B tumours treated as in (a). Data are derived from n = 53,062 cells pooled from 8 experimental conditions with three mice per treatment group. Cell types assigned using SingleR automated cell type recognition. (d) Dot Plot depicting scRNA-seq expression of selected T cell subset markers, cytokines, and chemokines. n = 11,044 human tumour infiltrating T cells from treatments described in (a). (e) Comparison of differentially expressed genes between CAR-T cells of different treatment groups described in (a). Statistical significance was determined with Seurat; *P adj <0.05. (f) Comparison of differentially expressed genes between macrophages of different treatment groups described in (a). Statistical significance was determined with Seurat; *P adj <0.05. (g) Enrichr pathway analysis of the top 100 upregulated genes in tumour infiltrating macrophages [macrophage/monocyte population in (a)] in 47E-CAR + B6H12 treated tumours compared with untreated controls. Results depict the P value (two-sided Fisher’s exact test) of each pathway. (h) UMAP of the identified macrophage/monocyte population in (a), subsetted and re-clustered, coloured by cluster (cluster identities on the left). Dots represent individual cells. n = 13,082 cells from 8 experimental conditions. (i) UMAPs of the identified macrophage/monocyte population, subsetted and re-clustered, coloured by cluster (cluster identities in (h)). UMAPs represent distinct treatment conditions. Dots represent individual cells. n = 13,082 cells from 8 experimental conditions described in (a). (j) UMAP of the re-clustered macrophage/monocyte population from (m), coloured for red if hCD3ε mRNA expression > 0. Dots represent individual cells. n = 13,082 cells from 8 experimental conditions, with n = 350 total cells identified as hCD3ε mRNA+. UMAPs represent distinct treatment conditions described in (a). (k) Dot plot depicting scRNA-seq expression of selected cluster-defining genes within the macrophage populations identified in (h). P adj. <0.0001 for each selected gene. Source Data
Extended Data Fig. 10
Extended Data Fig. 10. Pairing of 47E-CAR T and anti-CD47 therapy enhances tumour control in an aggressive osteosarcoma model, even at low doses.
(a – b) hCD8+ (left, a) and hCD4+ (right, a & b) T cells derived from two independent donors (represented by panels a & b) in the blood on day 14 by flow cytometry after B6H12 treatment in 143B tumour bearing mice, treated with 47WT- or 47E-Her2.BBζ-Antares-CAR-T ± B6H12. Mean ± SD of n = 5 mice. (c) hCD4+ and hCD8+ T cells in the blood on day 14 and day 27 of tumour growth in 143B tumour bearing mice, treated with 47E-Her2.BBζ-Antares-CAR-T + B6H12. Datapoints represent individual mice, with values from the same mouse connected by lines between time points. (d) T cell BLI prior to B6H12 treatment in mice treated as in (a). Mean ± SD of n = 5 mice. (e) T cell BLI after B6H12 treatment on day 13 in mice treated as in (a). Mean ± SD of n = 5 mice. (f) 47WT- or 47E-Her2.BBζ-Antares-CAR-T ± B6H12 treated 143B tumour survival. n = 5 mice/arm. (g and h) 47WT- or 47E-Her2.BBζ-Antares-CAR-T ± B6H12 treated 143B tumour (g) growth and (h) survival, using T cells derived from a different donor than (f). Mean ± SEM (g) or representative (h) of n = 5 mice. (i) hCD8+ (left) and hCD4+ (right) T cells derived from in the blood on day 12 by flow cytometry after treatment with 47WT- or 47E-Her2.BBζ-CAR-T ± low-doses of 75 µg or 25 µg B6H12 treatment in 143B tumour bearing mice. Mean ± SD of n = 5 mice. (j) 47E-Her2.BBζ-CAR-T ± low-dose B6H12 (75 µg or 25 µg) treated 143B tumour growth, using T cells derived from two different donors (left and right panels, respectively). Mice treated with mock T cells were co-treated ± 250 µg (~10 mg/kg) B6H12 (left panel) or 75 µg (~3 mg/kg) B6H12 (right panel). Mean ± SEM of n = 5 mice. [(a), (b), (d), (e), (g), (i), (j)] Two-way ANOVA test with Tukey’s multiple comparison test. ns = not significant. [(f), (h)] Log-rank Mantel-Cox test. ns = not significant. Source Data
Extended Data Fig. 11
Extended Data Fig. 11. Expression of 47E on tumour-targeting T cells permits pairing with anti-CD47 therapy and results in improved tumour control.
(a) hCD8+ (left) and hCD4+ (right) T cells by flow cytometry from the blood of CAR-T treated mice on day 15 in CHLA-255 tumour bearing mice, treated with 47WT- or 47E-B7H3.BBζ-nLuc-CAR-T ± B6H12. Mean ± SD of n = 5 mice. (b) T cell BLI on day 14 in CHLA-255 tumour bearing mice, treated as in (a). Mean ± SD of n = 5 mice. (c) Images of CHLA-255 tumour progression (top four rows) and T cells on day 14 (bottom) by BLI, treated as in (a). (d) 47WT- or 47E-B7H3.BBζ-nLuc-CAR-T ± B6H12 treated CHLA-255 tumour growth by BLI. Mean ± SEM of n = 5 mice/arm. (e) 47WT- or 47E-CD19.28ζ-CAR-T ± B6H12 treated Nalm6 tumour growth by BLI. Mean ± SEM of n = 5 mice/arm. (f) 47WT- or 47E-CD19.28ζ-CAR-T ± B6H12 treated Nalm6 survival. n = 5 mice/arm. (g) T cell by BLI in A375 tumour bearing mice, treated with 47E-NY-ESO-1-Antares-TCR-T cells ± B6H12, before (day 9, left) and after (day 14, right) αCD47 treatment. Mean ± SD of n = 5 mice. (h) hCD4+ (left) and hCD8+ (right) T cells by flow cytometry from the blood in the A375 tumour bearing mice, treated as in (g). Mean ± SD of n = 5 mice. (i) 47E-NY-ESO-1-TCR-T ± B6H12 treated A375 tumour growth. Data are individual tumour growth traces of n = 5 mice/arm. (j) 47E-NY-ESO-1-TCR-T ± B6H12 treated A375 tumour growth, with T cells derived from a different donor than shown in (i). Mean ± SEM of n = 5 mice/arm. [(a), (b), (d), (e), (g), (h), (j)] Two-way ANOVA test with Tukey’s multiple comparison test. ns = not significant. [(f)] Log-rank Mantel-Cox test. ns = not significant.

Comment in

References

    1. Labanieh L, Mackall CL. CAR immune cells: design principles, resistance and the next generation. Nature. 2023;614:635–648. doi: 10.1038/s41586-023-05707-3. - DOI - PubMed
    1. Kloosterman DJ, Akkari L. Macrophages at the interface of the co-evolving cancer ecosystem. Cell. 2023;186:1627–1651. doi: 10.1016/j.cell.2023.02.020. - DOI - PubMed
    1. Zizzo G, Hilliard BA, Monestier M, Cohen PL. Efficient clearance of early apoptotic cells by human macrophages requires M2c polarization and MerTK induction. J. Immunol. 2012;189:3508–3520. doi: 10.4049/jimmunol.1200662. - DOI - PMC - PubMed
    1. Zhu Y, et al. CSF1/CSF1R blockade reprograms tumor-infiltrating macrophages and improves response to T-cell checkpoint immunotherapy in pancreatic cancer models. Cancer Res. 2014;74:5057–5069. doi: 10.1158/0008-5472.CAN-13-3723. - DOI - PMC - PubMed
    1. Noel M, et al. Phase 1b study of a small molecule antagonist of human chemokine (C-C motif) receptor 2 (PF-04136309) in combination with nab-paclitaxel/gemcitabine in first-line treatment of metastatic pancreatic ductal adenocarcinoma. Invest. N. Drugs. 2020;38:800–811. doi: 10.1007/s10637-019-00830-3. - DOI - PMC - PubMed

MeSH terms