. 2024 May;629(8014):1133-1141.
doi: 10.1038/s41586-024-07419-8. Epub 2024 May 15.

GLP-1-directed NMDA receptor antagonism for obesity treatment

Affiliations

GLP-1-directed NMDA receptor antagonism for obesity treatment

Jonas Petersen et al. Nature. 2024 May.

Abstract

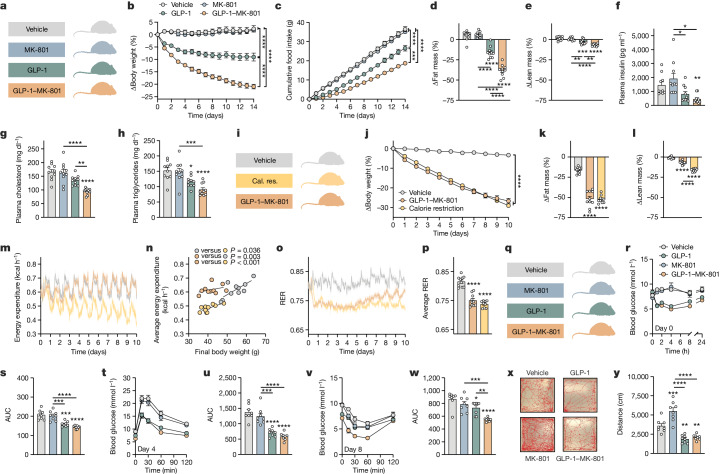
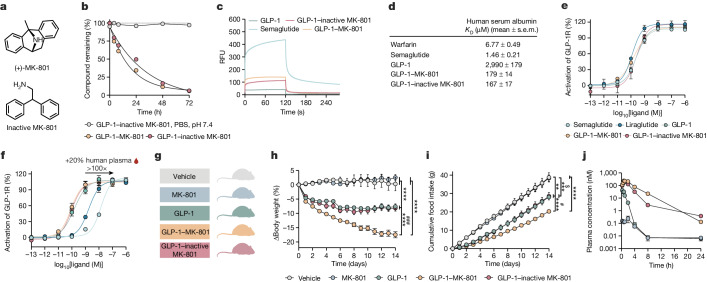
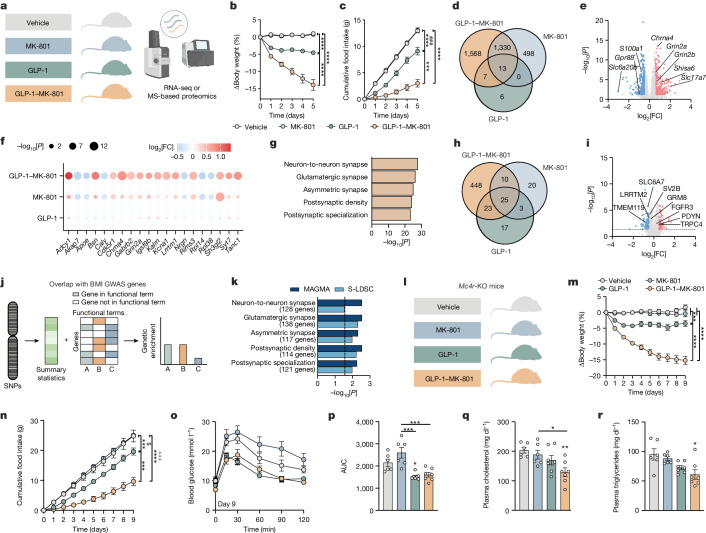
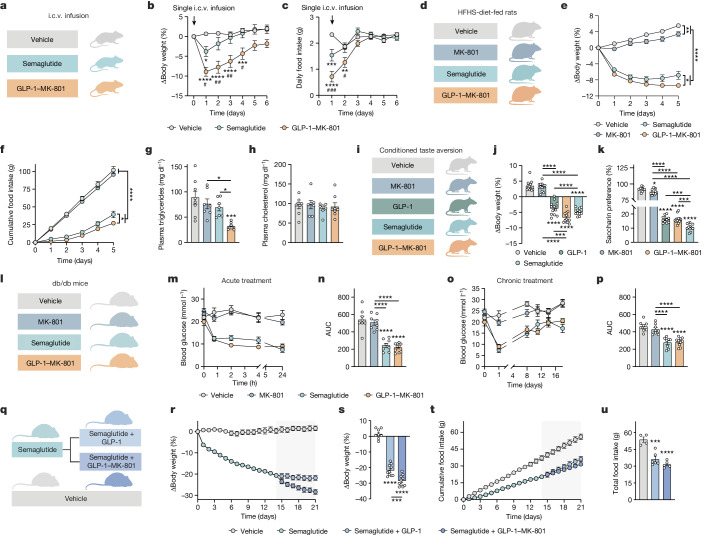
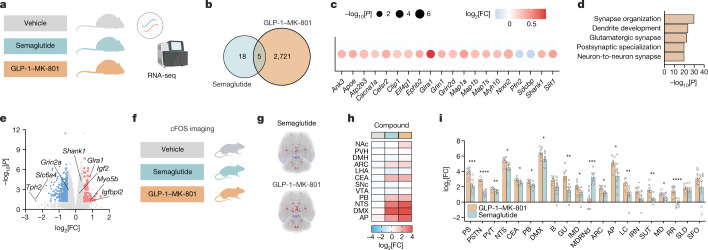
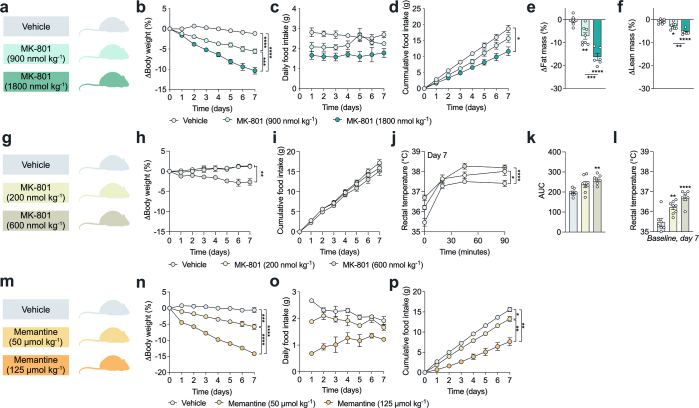
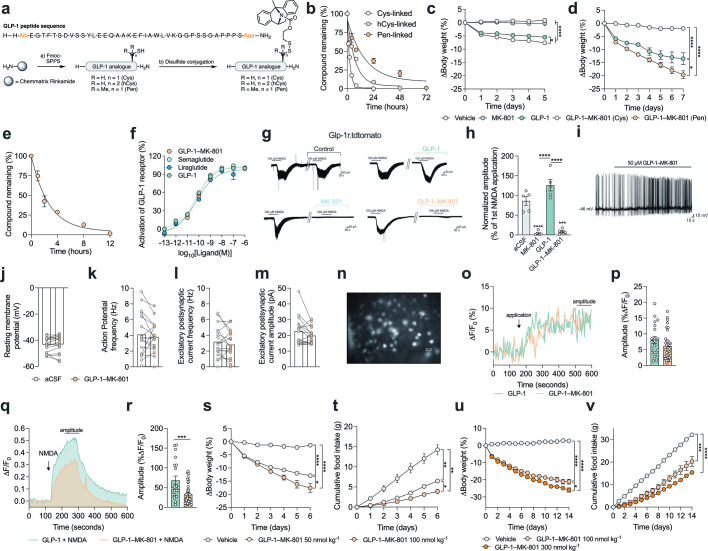
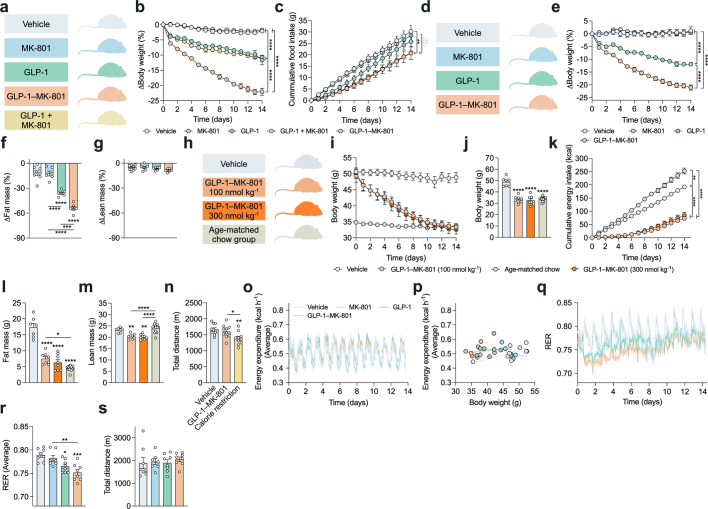
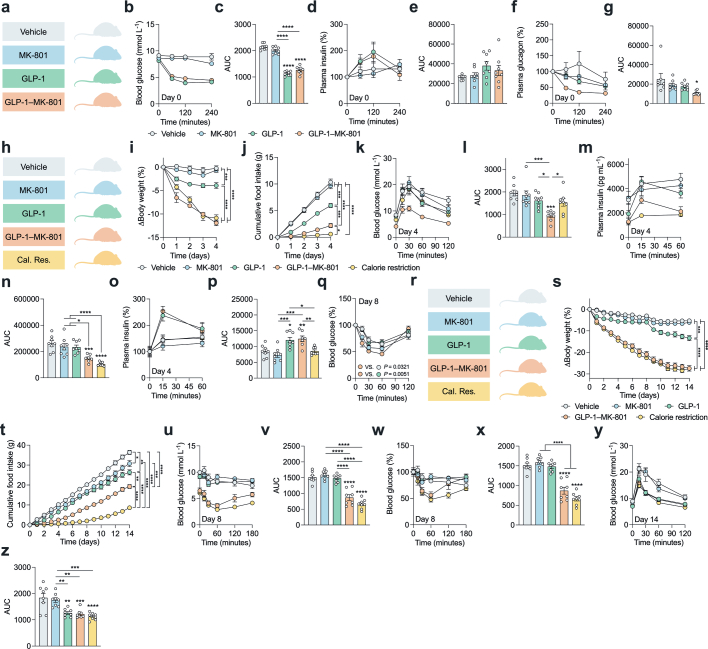
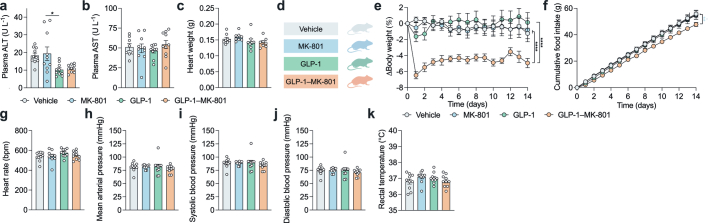
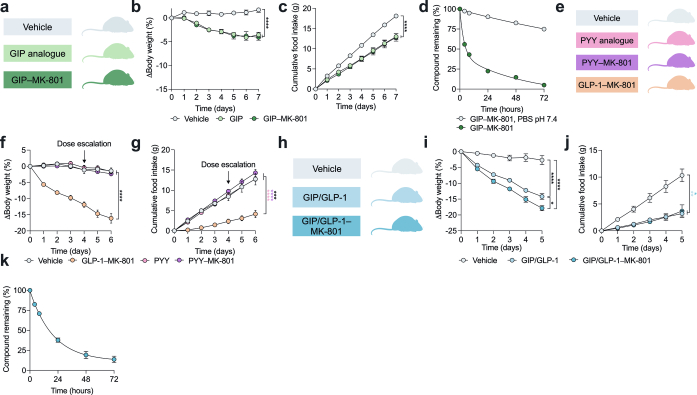
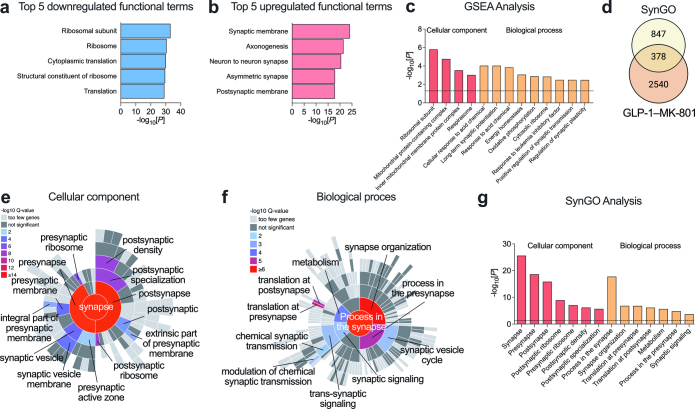
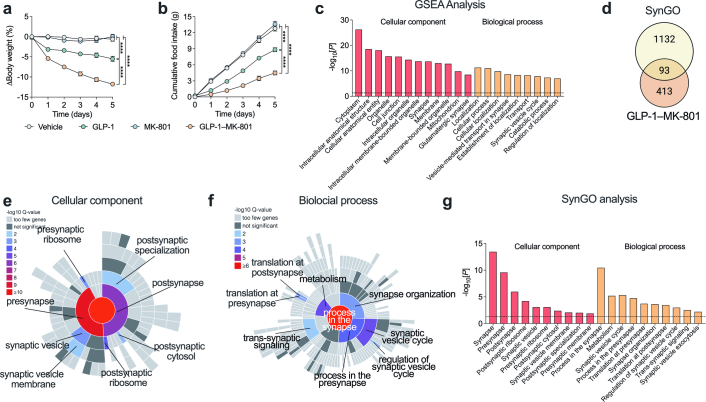
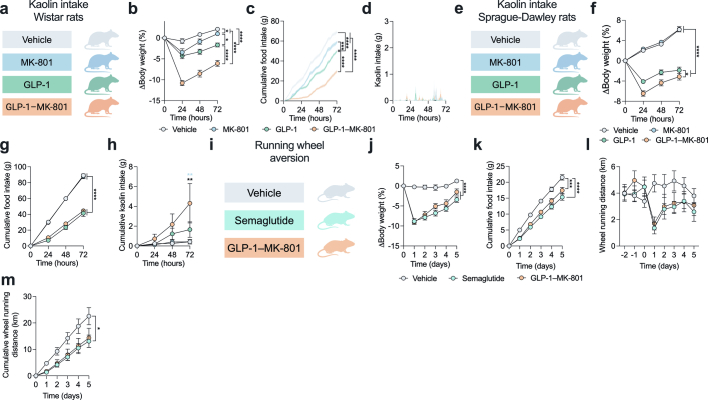
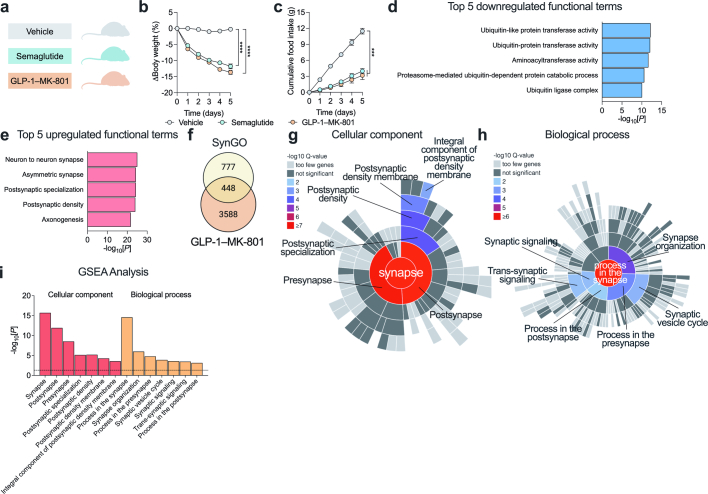
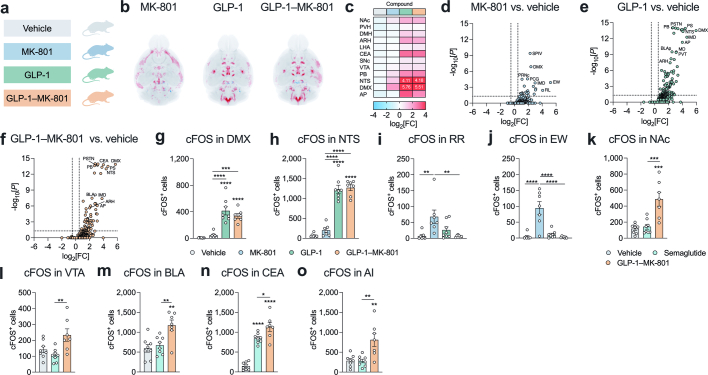
The N-methyl-D-aspartate (NMDA) receptor is a glutamate-activated cation channel that is critical to many processes in the brain. Genome-wide association studies suggest that glutamatergic neurotransmission and NMDA receptor-mediated synaptic plasticity are important for body weight homeostasis1. Here we report the engineering and preclinical development of a bimodal molecule that integrates NMDA receptor antagonism with glucagon-like peptide-1 (GLP-1) receptor agonism to effectively reverse obesity, hyperglycaemia and dyslipidaemia in rodent models of metabolic disease. GLP-1-directed delivery of the NMDA receptor antagonist MK-801 affects neuroplasticity in the hypothalamus and brainstem. Importantly, targeting of MK-801 to GLP-1 receptor-expressing brain regions circumvents adverse physiological and behavioural effects associated with MK-801 monotherapy. In summary, our approach demonstrates the feasibility of using peptide-mediated targeting to achieve cell-specific ionotropic receptor modulation and highlights the therapeutic potential of unimolecular mixed GLP-1 receptor agonism and NMDA receptor antagonism for safe and effective obesity treatment.


Conflict of interest statement

J.P., A.B.K. and C.C. are co-founders of Ousia Pharma, a biotech company developing therapeutics for treatment of obesity. T.W.S. is a co-founder of Embark Laboratories and SOLID therapeutics. B. Frølund is a co-founder of Ceremedy. K.S. is a co-founder and employee of Avilex Pharma. R.R., J.C.F., J.D.D. and B. Finan are employees of Novo Nordisk. R.D.D. is a co-inventor on intellectual property owned by Indiana University and licensed to Novo Nordisk; and was previously employed at Novo Nordisk. The other authors declare no competing interests.

Figures

Fig. 1
Fig. 1. GLP-1–MK-801 corrects metabolic disease.
ah, DIO mice were treated once-daily with s.c. injections of MK-801, GLP-1, GLP-1–MK-801 or vehicle for 14 days. n = 10 mice per group. 100 nmol kg−1 dose. a, Schematic. b, Change in body weight. c, Cumulative food intake. d, Change in fat mass. e, Change in lean mass. f, Plasma insulin. g, Plasma cholesterol. h, Plasma triglycerides. ip, DIO mice were treated once-daily with s.c. injections of GLP-1–MK-801 (100 nmol kg−1), calorie restriction (cal. res.) to match the weight loss of the GLP-1–MK-801 group or vehicle for 10 days. n = 9–10 mice per group. i, Schematic. j, Change in body weight. k, Change in fat mass. l, Change in lean mass. m, Energy expenditure. n, Average energy expenditure relative to final body weight. o, RER. One mouse in the calorie-restriction group was excluded due to a CO2-sensor-related deviation. p, Average RER. qw, DIO mice were treated once-daily with s.c. injections of MK-801, GLP-1, GLP-1–MK-801 or vehicle for 8 days. n = 8 mice per group. 100 nmol kg−1 dose. q, Schematic. r, Compound tolerance test on day 0. s, Area under the curve (AUC) of data in r. t, Glucose tolerance test on day 4. u, AUC of data in t. v, Insulin tolerance test on day 8. w, AUC of data in v. x,y, Open-field test after a single s.c. injection of MK-801, GLP-1, GLP-1–MK-801 or vehicle. n = 8 mice per group. 300 nmol kg−1 dose. x, Representative traces. y, Distance travelled. Data were analysed using one-way analysis of variance (ANOVA) with Bonferroni post hoc multiple-comparison test (dh, k, l, p, s, u, w and y), two-way repeated-measures ANOVA to assess main effects of treatment (b, c and j) or analysis of covariance (ANCOVA) computed with calR using body weight as a covariate (n). Data are mean ± s.e.m. *P < 0.05, **P < 0.01, ***P < 0.001, ****P < 0.0001. Detailed statistics are provided in Supplementary Table 1. The diagrams in a, i and q were created using BioRender. Source Data
Fig. 2
Fig. 2. Pharmacokinetic assessments of GLP-1–MK-801.
a, The chemical structures of (+)-MK-801 and 2,2-diphenylethan-1-amine (inactive MK-801). b, In vitro stability assay of GLP-1–MK-801 (n = 3) and GLP-1–inactive MK-801 (n = 3) incubated in human plasma at 37 °C and GLP-1–MK-801 (n = 1) incubated in PBS buffer, pH 7.4 at 37 °C. c,d, The interactions with human serum albumin of GLP-1, GLP-1–MK-801, GLP-1–inactive MK-801, semaglutide and warfarin were analysed using surface plasmon resonance (n = 3 per compound). c, Sensorgrams measured at 25 µM. RFU, relative fluorescence units. d, Dissociation constants were derived using a multi-site fit model. e,f, Dose–response curves for in vitro GLP-1 receptor activation of GLP-1, GLP-1–MK-801, GLP-1–inactive MK-801, liraglutide and semaglutide (n = 3 per compound). e, Dose–response curves. f, Dose–response curves in the presence of 20% human plasma. gi, DIO mice were treated once-daily with s.c. injections of MK-801, GLP-1, GLP-1–inactive MK-801 or vehicle for 14 days. n = 8 mice. 100 nmol kg−1 dose. g, Schematic. h, Change in body weight. i, Cumulative food intake. j, The plasma concentration of MK-801, GLP-1, GLP-1–inactive MK-801 and GLP-1–MK-801 in chow-fed male C57BL/6J mice. n = 4 mice per group. 100 nmol kg−1 dose. Data were analysed using two-way repeated-measures ANOVA to assess main effects of treatment (hj). Dissociation constants were determined using a multi-site fit model (d). Data are mean ± s.e.m. *P < 0.05, **P < 0.01, ***P < 0.001, ****P < 0.0001. #denotes comparison between GLP-1–MK-801 and GLP-1–inactive MK-801. $denotes comparison between vehicle and GLP-1–inactive MK-801. Detailed statistics are provided in Supplementary Table 1. The diagram in g was created using BioRender. Source Data
Fig. 3
Fig. 3. Effects of GLP-1–MK-801 on hypothalamic signalling.
ag,j,k, RNA-seq analysis of hypothalami from DIO mice treated once daily with s.c. injections of MK-801, GLP-1, GLP-1–MK-801 or vehicle for 5 days. n = 8 mice per group. 100 nmol kg−1 dose. a, Schematic. b, Change in body weight. c, Cumulative food intake. d, Venn diagram of differentially expressed genes. e, Volcano plot of differentially expressed genes in response to GLP-1–MK-801. FC, fold change. f, The top 20 differentially expressed genes found in the top five functional terms in g. g, The top five functional terms in response to GLP-1–MK-801 in the hypothalamus. h,i, MS-based proteomic analyses of hypothalami from DIO mice treated with once-daily s.c. injections of MK-801, GLP-1, GLP-1–MK-801 or vehicle for 5 days. n = 8 mice per group. 100 nmol kg−1 dose. h, Venn diagram of differentially expressed proteins. i, Volcano plot of proteins regulated in response to GLP-1–MK-801. j, Schematic of BMI GWAS integration. Differentially expressed proteins found in the top five functional terms were integrated with human BMI GWAS data. SNP, single-nucleotide polymorphism. k, Overlap analyses using the MAGMA and S-LDSC tools to compute BMI GWAS integration. lr, Treatment of Mc4r-KO mice with once-daily s.c. administration of MK-801, GLP-1, GLP-1–MK-801 or vehicle for 9 days. n = 6–7 mice. 100 nmol kg−1 dose. One mouse in the MK-801 group had to be euthanized after the intraperitoneal glucose tolerance test. l, Schematic. m, Change in body weight. n, Cumulative food intake. o, Glucose tolerance test on day 9. p, AUC of data in o. q, Plasma cholesterol. r, Plasma triglycerides. Data were analysed using one-way ANOVA with Bonferroni post hoc multiple-comparison test (pr) and two-way repeated-measures ANOVA to assess main effects of treatment (b, c, m and n). Data are mean ± s.e.m. *P < 0.05, **P < 0.01, ***P < 0.001, ****P < 0.0001. #denotes comparison between MK-801 and GLP-1.$denotes comparison between vehicle and GLP-1. +denotes comparison between vehicle and GLP-1–MK-801. Detailed statistics are provided in Supplementary Table 1. The diagrams in a, d, h, j and l were created using BioRender. Source Data
Fig. 4
Fig. 4. GLP-1–MK-801 versus semaglutide in preclinical models of obesity and diabetes.
ac, i.c.v. infusions of 0.22 nmol semaglutide (n = 15 mice), 0.22 nmol GLP-1–MK-801 (n = 15 mice) or vehicle (n = 12 mice) in high-fat high-sucrose (HFHS)-fed mice. a, Schematic. b, Change in body weight. c, Daily food intake. One datapoint was excluded for one vehicle mouse owing to a measurement error. dh, Once-daily s.c. treatment of Sprague-Dawley rats maintained on an HFHS diet for 4 weeks with MK-801 (100 nmol kg−1), semaglutide (10 nmol kg−1), GLP-1–MK-801 (100 nmol kg−1) or vehicle. n = 7–8 rats. d, Schematic. e, Change in body weight. f, Cumulative food intake. g, Plasma triglycerides. One plasma sample was lost in the semaglutide group. h, Plasma cholesterol. ik, CTA analysis of chow-fed Wistar rats after treatment with MK-801 (100 nmol kg−1), GLP-1 (100 nmol kg−1), GLP-1–MK-801 (100 nmol kg−1), semaglutide (10 nmol kg−1) or vehicle. n = 12 rats per group. i, Schematic. j, Change in body weight 24 h after dosing. k, Saccharin preference. Saccharin intake data for one mouse in the GLP-1 group was not collected due to a sensor malfunction. lp, Treatment of db/db mice with once-daily s.c. injections of MK-801 (100 nmol kg−1), semaglutide (10 nmol kg−1), GLP-1–MK-801 (100 nmol kg−1) or vehicle for 18 days. n = 8–10 mice per group. l, Schematic. m, Compound tolerance test on day 0. n, Area under the curve of data in m. o, Basal blood glucose. p, Area under the curve of data in o. qu, DIO mice were treated once-daily with s.c. injections of semaglutide (n = 20 mice, 10 nmol kg−1) or vehicle (n = 8 mice). After 14 days of treatment, semaglutide-treated mice were randomized to receive semaglutide and GLP-1 (100 nmol kg−1) as co-administration or semaglutide and GLP-1–MK-801 (100 nmol kg−1) as co-administration. q, Schematic. r, Change in body weight. s, Change in body weight after 21 days. t, Cumulative food intake. u, Total food intake at day 21. Data were analysed using one-way ANOVA with Bonferroni post hoc multiple-comparison test (g, h, j, k, n, p, s and u), two-way repeated-measures ANOVA to assess the main effects of treatment (e and f) and two-way ANOVA with Bonferroni post hoc multiple-comparison test (b and c). Data are mean ± s.e.m. *P < 0.05, **P < 0.01, ***P < 0.001, ****P < 0.0001. #P < 0.05, ##P < 0.01, ###P < 0.001 denotes comparison between GLP-1–MK-801 and semaglutide. Detailed statistics are provided in Supplementary Table 1. The diagrams in a, d, i, l and q were created using BioRender. Source Data
Fig. 5
Fig. 5. The effects of GLP-1–MK-801 on the hypothalamic transcriptome and whole-brain activity.
ae, RNA-seq analysis of hypothalami from DIO mice treated once-daily with s.c. injections of semaglutide (10 nmol kg−1), GLP-1–MK-801 (100 nmol kg−1) or vehicle for 5 days. n = 6 mice. a, Schematic. b, Venn diagram of differentially expressed genes. c, The top 20 most differentially expressed genes found in the top 5 functional terms in d. d, The top 5 functional terms between GLP-1–MK-801 and semaglutide treatments. e, Volcano plot of differentially expressed genes in response to GLP-1–MK-801 relative to semaglutide. fi, Whole-brain 3D mapping and quantification of cFOS responses to a single s.c. injection with semaglutide (10 nmol kg−1), GLP-1–MK-801 (100 nmol kg−1) or vehicle in lean mice. n = 7–8 mice. One mouse in the GLP-1–MK-801 group was excluded due to sample-processing deviation. f, Schematic. g, Mouse brain images showing a heat map of the averaged changes in cFOS expression in response to treatments. h, Heat map of cFOS activity in brain regions associated with appetite regulation. i, Comparison of changes in cFOS expression in the top 20 most significantly regulated brain regions. Data were analysed using an unpaired two-tailed t-test (i). Data are mean ± s.e.m. *P < 0.05, **P < 0.01, ***P < 0.001, ****P < 0.0001. Definitions of brain region abbreviations are provided in the ‘cFOS whole-brain imaging’ section of the Methods. Detailed statistics are provided in Supplementary Table 1. The diagrams in a, b and f were created using BioRender. Source Data
Extended Data Fig. 1
Extended Data Fig. 1. Pharmacological NMDA receptor antagonism dose-dependently lowers body weight but induces hyperthermia.
a-f, Treatment of C57BL/6 J DIO mice with once-daily subcutaneous (s.c.) injections of 900 nmol kg−1 MK-801 (n = 8 mice and n = 4 cages), 1800 nmol kg−1 MK-801 (n = 6 mice and n = 3 cages) or vehicle (isotonic saline, n = 7 mice and n = 3 cages) over 7 days. One mouse and cage were excluded from vehicle group due to the development of constipation. a, Schematic. b, Change in body weight. c, Daily food intake. d, Cumulative food intake. e, Change in fat mass. f, Change in lean mass. g-l, Treatment of C57BL/6 J DIO mice with once-daily s.c. injections of 200 nmol kg−1 MK-801 (n = 8 mice and n = 4 cages), 600 nmol kg−1 MK-801 (n = 7 mice and n = 4 cages) or vehicle (isotonic saline, n = 7 mice and n = 4 cages) for 7 days. g, Schematic. h, Change in body weight. i, Cumulative food intake. j, Change in rectal temperature in response to treatment on day 7. k, Area under curve (AUC) of j. l, Baseline rectal temperature on day 7. m-p, Treatment of C57BL/6 J DIO mice with once-daily s.c. injections of 50 µmol kg−1 memantine (n = 6 mice and n = 3 cages), 125 µmol kg−1 memantine (n = 6 mice and n = 3 cages) or vehicle (isotonic saline, n = 6 mice and n = 3 cages) over 7 days. m, Schematic. n, Change in body weight. o, Daily food intake. p, Cumulative food intake. Data analysed by one-way ANOVA, multiple comparison, Bonferroni post hoc test (e, f, k and l) and two-way repeated measures ANOVA to assess main effects of treatment (b, d, h-j, n and p). Data represents mean ± SEM; *P < 0.05, **P < 0.01, ***P < 0.001, ****P < 0.0001. Detailed statistics are in Supplementary Table 1. The diagrams in a, g and m were created using BioRender. Source Data
Extended Data Fig. 2
Extended Data Fig. 2. Pharmacological characterization of GLP-1–MK-801.
a, Chemical synthesis of GLP-1–MK-801 conjugates with different cysteine homologues. b, In vitro stability assay in human plasma. The assay was performed as biological replicates of GLP-1–MK-801 (Cys-linked) (n = 3), GLP-1–MK-801 (hCys-linked) (n = 2), GLP-1–MK-801 (Pen-linked) (n = 3). c, Change in body weight of DIO mice treated with once-daily s.c. injections of 100 nmol kg−1 MK-801 (n = 8 mice), 100 nmol kg−1 GLP-1 (n = 8 mice), 100 nmol kg−1 GLP-1–MK-801 (Cys-linked) (n = 8 mice) or vehicle (isotonic saline, n = 8 mice) for 5 days. d, Change in body weight of DIO mice treated with once-daily s.c. injections of 100 nmol kg−1 GLP-1 (n = 6 mice), 100 nmol kg−1 GLP-1–MK-801 (Pen-linked) (n = 6 mice) or vehicle (isotonic saline, n = 6 mice) for 7 days. e, Degradation assay. GLP-1–MK-801 was incubated in PBS with 200 mM glutathione at pH 7.0. The assay was performed as triplicates (n = 3). f, Murine GLP-1 receptor activation of GLP-1, GLP-1–MK-801, liraglutide and semaglutide in transiently transfected HEK293 cells. The data represents dose-response at 2 min and is normalized to the maximal GLP-1 response (100%). The assay was performed as duplicates (n = 2). g, h, Electrophysiological recordings of GLP-1 receptor-positive neurons, which were identified using a tdtomato reporter, being stimulated with NMDA after 30 min of bath application of GLP-1 or GLP-1–MK-801. g, Current responses at a holding potential of −70 mV elicited by NMDA bath application in GLP-1 receptor-positive neurons of the arcuate nucleus (ARC) with bath application of 50 µM GLP-1–MK-801, 50 µM GLP-1, 50 µM MK-801 or artificial cerebrospinal fluid (aCSF). h, Bar graph summarizing the effect of NMDA-induced inward current after control (aCSF, n = 5 neurons), GLP-1 (50 μM, n = 5 neurons), MK-801 (50 μM, n = 5 neurons) or GLP-1–MK-801 (50 μM, n = 5 neurons). Bath application normalized to the first bath application of NMDA (100 μM). i-m, Electrophysiological recordings of POMC neurons stimulated with GLP-1–MK-801. i, Representative trace showing that 50 μM GLP-1–MK-801 acute bath application induces a depolarization of POMC neurons in ARC (n = 6 of 17 neurons). Bar graphs summarizing the acute effect of 50 μM GLP-1–MK-801 on POMC neurons. j, Resting membrane potential, k, Action potential frequency n. l, Excitatory postsynaptic current (EPSC) frequency. m, EPSC amplitude of POMC neurons that were depolarized in response to GLP-1–MK-801 bath application. n-r, Calcium imaging of ARC brain slices. n, Representative image of Fura-2AM loaded cells in an ARC brain slice. Scalebar is 20 µm. o, Application of GLP-1 and GLP-1–MK-801 induced changes in fluorescence indicative of rises in intracellular calcium (%ΔF/F0) as shown by these representative fluorescent responses of two different Fura 2-AM loaded cells to application of GLP-1 (1 µM) or GLP-1–MK-801 (1 µM). p, The amplitude of the change in fluorescence (%ΔF/F0) elicited by GLP-1 (1 µM, n = 20 neurons) or GLP-1–MK-801 (1 µM, n = 38 neurons). q, Representative traces of intracellular calcium levels in response to application of NMDA (50 µM) following bath application of GLP-1 (1 µM) or GLP-1–MK-801 (1 µM). r, Quantification of NMDA-induced (50 µM) intracellular calcium rises (%ΔF/F0) following bath application of GLP-1 (1 µM, n = 20 neurons) or GLP-1–MK-801 (1 µM, n = 38 neurons). s, t, Treatment of DIO mice with once-daily s.c. injections of 50 nmol kg−1 GLP-1–MK-801 (n = 6 mice and n = 3 cages), 100 nmol kg−1 GLP-1–MK-801 (n = 6 mice and n = 3 cages) or vehicle (isotonic saline, n = 6 mice and n = 3 cages) for 6 days. s, Change in body weight. t, Cumulative food intake. u, v, Treatment of C57BL/6 J DIO mice with once-daily s.c. injections of 100 nmol kg−1 GLP-1–MK-801 (n = 8 mice and n = 4 cages), 300 nmol kg−1 GLP-1–MK-801 (n = 8 mice and n = 4 cages) or vehicle (isotonic saline, n = 8 mice and n = 4 cages) for 14 days. u, Change in body weight. v, Cumulative food intake. Data analysed by paired two-tailed Student’s t-test (j-m), unpaired two-tailed Student’s t-test (p and r), one-way ANOVA, multiple comparison, Bonferroni post hoc test (h) and two-way repeated measures ANOVA to assess main effects of treatment (c, d and s-v). Data represents mean ± SEM; *P < 0.05, **P < 0.01, ***P < 0.001, ****P < 0.0001. Detailed statistics are in Supplementary Table 1. Source Data
Extended Data Fig. 3
Extended Data Fig. 3. Supplementary metabolic phenotyping of GLP-1–MK-801.
a-c, Treatment of DIO mice with once-daily s.c. injections of 100 nmol kg−1 MK-801 (n = 7 mice and n = 4 cages), 100 nmol kg−1 GLP-1 (n = 6 mice and n = 3 cages), 100 nmol kg−1, GLP-1–MK-801 (n = 6 mice and n = 3 cages), co-administration of 100 nmol kg−1 GLP-1 and 100 nmol kg−1 MK-801 (n = 6 mice and n = 3 cages) or vehicle (isotonic saline, n = 7 mice and n = 4 cages) for 14 days. a, Schematic. b, Change in body weight. c, Cumulative food intake. d-g and o-s, Treatment of DIO mice in metabolic cages with once-daily s.c. injections of 100 nmol kg−1 MK-801 (n = 7-8 mice), 100 nmol kg−1 GLP-1 (n = 8 mice), 100 nmol kg−1 GLP-1–MK-801 (n = 8 mice) or vehicle (isotonic saline, n = 8 mice) for 14 days. d, Schematic. e, Change in body weight. f, Change in fat mass. For MRI, two values were not registered from MK-801 group, two values were not registered from GLP-1 group and two values were not registered from GLP-1–MK-801 group due to MRI instrumental error. g, Change in lean mass. h-m, GLP-1–MK-801 corrects body weight and fat mass relative to age-matched chow-fed control mice. Treatment of DIO mice with once-daily s.c. injections of 100 nmol kg−1 GLP-1–MK-801 (n = 8 mice and n = 4 cages), 300 nmol kg−1 GLP-1–MK-801 (n = 8 mice and n = 4 cages) or vehicle (isotonic saline, n = 7 mice and n = 4 cages) in comparison with vehicle-treated age-matched chow-fed C57BL/6 J mice (n = 16 mice and n = 8-11 cages) for 14 days. Three double-housed cages with age-matched control animals were split on day 7 of the experiment due to fighting. One mouse was found dead in vehicle group. h, Schematic. i, Change in body weight. j, Body weight on day 14. k, Cumulative food intake. l, Fat mass on day 14. m, Lean mass on day 14. n, Total locomotor activity of mice from indirect calorimetry study in Fig. 1i–p. o, Energy expenditure. One mouse in MK-801 group excluded due to sensor related deviation. p, Regression-based analysis of energy expenditure relative to body weight on day 14. q, Respiratory exchange ratio (RER). r, Average respiratory exchange ratio. s, Total locomotor activity. Data analysed by one-way ANOVA, multiple comparison, Bonferroni post hoc test (f, g, j, l-n, r and s), two-way repeated measures ANOVA to assess main effects of treatment (b, c, e and k), and ANCOVA computed with calR using body weight as a covariate (p). Data represents mean ± SEM; *P < 0.05, **P < 0.01, ***P < 0.001, ****P < 0.0001. Detailed statistics are in Supplementary Table 1. The diagrams in a, d and h were created using BioRender. Source Data
Extended Data Fig. 4
Extended Data Fig. 4. Evaluation of glucometabolic effects of GLP-1–MK-801.
a-g, Compound tolerance test in response to a single s.c. injection of 100 nmol kg−1 MK-801 (n = 8 mice), 100 nmol kg−1 GLP-1 (n = 8 mice), 100 nmol kg−1, GLP-1–MK-801 (n = 8 mice), or vehicle (isotonic saline, n = 8 mice) in DIO mice. a, Schematic. b, Compound tolerance test on day 0. c, AUC of b. d, Plasma insulin levels during compound tolerance test. One mouse and one datapoint in vehicle group was omitted from analysis as they had insulin levels outside the assay range. e, AUC of d. f, Plasma glucagon levels during compound tolerance test. One mouse in vehicle group had supraphysiological glucagon levels outside the assay range and was omitted from analysis. g, AUC of f. h-p, Glucose-stimulated insulin secretion. Treatment of DIO mice with once-daily s.c. injections of 100 nmol kg−1 MK-801 (n = 8 mice and n = 4 cages), 100 nmol kg−1 GLP-1 (n = 8 mice and n = 4 cages), 100 nmol kg−1 GLP-1–MK-801 (n = 8 mice and n = 4 cages), calorie restriction (Cal. Res.) to match the weight loss of GLP-1–MK-801 (n = 8 mice and n = 5 cages) or vehicle (isotonic saline, n = 8 mice and n = 5 cages) for 4 days. On day 4, an intraperitoneal glucose tolerance test was conducted with collection of tail blood at timepoints 0, 15 and 60 min. h, Schematic. i, Change in body weight. j, Cumulative food intake. k, Glucose tolerance test on day 4. l, AUC of k. m, Glucose-stimulated insulin secretion. One datapoint in vehicle group, one datapoint in MK-801 group and one mouse and one datapoint in GLP-1–MK-801 group were outside assay range and omitted from analysis. n, AUC of m. o, Percentage to baseline of m. p, AUC of o. q, Percentage to baseline of insulin tolerance test in Fig. 1v. r-z, Insulin and glucose tolerance compared to mice undergoing calorie restriction to match the weight loss trajectory of GLP-1–MK-801. Treatment of DIO mice with once daily s.c. injections of 100 nmol kg−1 MK-801 (n = 8 mice and n = 4 cages), 100 nmol kg−1 GLP-1 (n = 8 mice and n = 4 cages), 100 nmol kg−1 GLP-1–MK-801 (n = 8 mice and n = 4 cages), calorie restriction (Cal. Res.) to match the weight loss of GLP-1–MK-801 (n = 8 mice and n = 4 cages) or vehicle (isotonic saline, n = 8 mice and n = 3-4 cages) for 14 days. On day 8, an intraperitoneal insulin tolerance test was conducted and on day 14 an intraperitoneal glucose tolerance test was conducted. r, Schematic. s, Change in body weight. t, Cumulative food intake. Four datapoints were excluded for one cage in vehicle group due to food spillage on day 11-14. u, Insulin tolerance test on day 8. v, AUC of u. w, Percentage to baseline of u. x, AUC of w. y, Glucose tolerance test on day 14. z, AUC of y. Data analysed by one-way ANOVA, multiple comparison, Bonferroni post hoc test (c, e, g, l, n, p, v, x and z) and two-way repeated measures ANOVA to assess main effects of treatment (i, jq, s and t). Data represents mean ± SEM; *P < 0.05, **P < 0.01, ***P < 0.001, ****P < 0.0001. Detailed statistics are in Supplementary Table 1. The diagrams in a, h and r were created using BioRender. Source Data
Extended Data Fig. 5
Extended Data Fig. 5. GLP-1–MK-801 is devoid of hallmark MK-801-induced adverse effects.
a, b, Supporting data to study in Fig. 1a–h (vehicle (isotonic saline), n = 10 mice, 100 nmol kg−1 MK-801 n = 10 mice, 100 nmol kg−1 GLP-1 n = 10 mice, 100 nmol kg−1 GLP-1–MK-801 n = 10 mice). a, Plasma alanine transaminase (ALT) activity. b, Plasma aspartate aminotransferase (AST) activity. Two samples were removed from vehicle group, i.e., one sample was non-detectable and for another sample the activity was a significant outlier (Grubbs test). c, Heart weights of mice in Extended Data Figs. 3d–g and 3o–s (vehicle n = 8 mice, 100 nmol kg−1 MK-801 n = 8 mice, 100 nmol kg−1 GLP-1 n = 8 mice, 100 nmol kg−1 GLP-1–MK-801 n = 8 mice). d-j, Assessment of cardiovascular safety following chronic treatment of chow-fed lean C57BL/6 J mice with once-daily s.c. injections of 100 nmol kg−1 MK-801 (n = 9 mice and 4 cages), 100 nmol kg−1 GLP-1 (n = 10 mice and 4 cages), 100 nmol kg−1 GLP-1–MK-801 (n = 10 mice and 4 cages), or vehicle (isotonic saline, n = 10 mice and 4 cages) for 14 days. On day 14, mice were anesthetized, and blood pressure and echocardiograms were recorded. One mouse was euthanized on day 12 in MK-801 group due to sickness. d, Schematic. e, Change in body weight. f, Cumulative food intake. g, Heart rate in beats per minute (bpm). h, Mean arterial pressure. i, Systolic blood pressure. j, Diastolic blood pressure. k, Rectal temperature on day 14 of mice from study in Fig. 1a–h. Data analysed by one-way ANOVA, multiple comparison, Bonferroni post hoc test (a-c and g-k) and two-way repeated measures ANOVA to assess main effects of treatment (e and f). Data represents mean ± SEM; *P < 0.05, **P < 0.01, ****P < 0.0001. Detailed statistics are in Supplementary Table 1. The diagram in d was created using BioRender. Source Data
Extended Data Fig. 6
Extended Data Fig. 6. Assessment of MK-801 as a half-life extender of gut peptide hormones.
a-c, Treatment of DIO mice with once-daily s.c. injections of 100 nmol kg−1 GIP analogue (n = 8 mice and n = 4 cages), 100 nmol kg−1 GIP–MK-801 (n = 8 mice and n = 4 cages) or vehicle (isotonic saline, n = 8 mice and n = 4 cages) for 7 days. a, Schematic. b, Change in body weight. c, Cumulative food intake. d, In vitro stability assay of GIP–MK-801 (n = 2) incubated in human plasma or PBS, pH = 7.4 (n = 1). e-g, Treatment of DIO mice with once daily s.c. injections of 100 nmol kg−1 PYY analogue (n = 7 mice and n = 6 cages), 100 nmol kg−1 PYY–MK-801 (n = 7 mice and n = 4 cages), 100 nmol kg−1 GLP-1–MK-801 (n = 7 mice and n = 5 cages) or vehicle (isotonic saline, n = 7 mice and n = 4 cages) for 6 days. The dose of PYY-based compounds was escalated at day 4 from 100 nmol kg−1 to 500 nmol kg−1. e, Schematic. f, Change in body weight. g, Cumulative food intake. h-j, Treatment of DIO mice with once daily s.c. injections of 50 nmol kg−1 GIP/GLP-1 (n = 6 mice and n = 3 cages), 50 nmol kg−1 GIP/GLP-1–MK-801 (n = 6 mice and n = 3 cages) or vehicle (isotonic saline, n = 6 mice and n = 3 cages) for 5 days. h, Schematic. i, Change in body weight. j, Cumulative food intake. k, In vitro stability assay of GIP/GLP-1–MK-801 (n = 3) incubated in human plasma. Data analysed by two-way repeated measures ANOVA to assess main effects of treatment (b, c, f, g, i and j). Data represents mean ± SEM; *P < 0.05, ****P < 0.0001. Detailed statistics are in Supplementary Table 1 and chemical structures are in Supplementary Fig. 1. The diagrams in a, e and h were created using BioRender. Source Data
Extended Data Fig. 7
Extended Data Fig. 7. Bulk hypothalamic RNA sequencing data.
a-g, Supplementary analyses of RNA sequencing data shown in Fig. 3a–g, j, k. a, Top 5 most enriched functional terms for the 1417 differentially expressed genes that were downregulated following GLP-1–MK-801 treatment. b, Top 5 enriched functional terms for the 1501 differentially expressed genes that were upregulated following GLP-1–MK-801 treatment. c, Top four cellular component and top nine biological process functional terms identified using gene set enrichment (GSEA) analysis. d, Venn diagram showing the overlap between the SynGO database and the 2918 uniquely differentially expressed genes in response to treatment with GLP-1–MK-801. e, Sunburst plot of differentially expressed genes belonging to cellular component functional terms computed with SynGO. Enrichment is colour coded by Q value for the functional terms. All level terms identified have been labelled. f, Sunburst plot of differentially expressed genes belonging to biological process functional terms computed with SynGO. Enrichment is colour coded by Q value for the functional terms. All level terms identified have been labelled. g, Top seven enriched functional terms for cellular component and top 7 functional terms enriched for biological process identified by SynGO. Benjamini-Hochberg adjusted P values were used for all analyses (ag). The diagram in d was created using BioRender. Source Data
Extended Data Fig. 8
Extended Data Fig. 8. Mass spectrometry-based proteomics analyses of hypothalamic nuclei in response to GLP-1–MK-801.
a-g, Proteomics data from study in Fig. 3h, i of mice treated with 100 nmol kg−1 MK-801 (n = 8 mice and n = 4 cages), 100 nmol kg−1 GLP-1 (n = 8 mice and n = 4 cages), 100 nmol kg−1 GLP-1–MK-801 (n = 8 mice and n = 4 cages) or vehicle (isotonic saline, n = 8 mice and n = 4 cages) for 5 days. a, Change in body weight. b, Cumulative food intake. c, Top twelve cellular component and top nine biological process ontologies identified using gene set enrichment (GSEA) analysis. d, Venn diagram showing the overlap between the SynGO database and the 506 uniquely differentially expressed proteins in response to GLP-1–MK-801. e, Sunburst plot of differentially expressed proteins belonging to cellular component functional terms computed with SynGO. Enrichment is colour coded by Q value for the functional terms. All level terms identified have been labelled. f, Sunburst plot of differentially expressed proteins belonging to biological process functional terms computed with SynGO. Enrichment is colour coded by Q value for the functional terms. All level terms identified have been labelled. g, Top ten SynGO enriched functional terms for cellular component and biological process. Data analysed by two-way repeated measures ANOVA to assess main effects of treatment (a and b). Benjamini-Hochberg corrected P (c-g) Data represents mean ± SEM; ****P < 0.0001. Detailed statistics are in Supplementary Table 1. The diagram in d was created using BioRender. Source Data
Extended Data Fig. 9
Extended Data Fig. 9. Assessment of aversion in rodents.
a-d, Chow-fed Wistar rats were dosed once-daily with s.c. injections of 100 nmol kg−1 MK-801 (n = 12 rats), 100 nmol kg−1 GLP-1 (n = 12 rats), 100 nmol kg−1 GLP-1–MK-801 (n = 12 rats) or vehicle (isotonic saline, n = 13 rats) for three consecutive days while being offered the voluntary choice between chow and kaolin (a non-food product). a, Schematic. b, Change in body weight. c, Cumulative food intake. One food monitor did not work for one mouse in vehicle group. d, Time-resolved kaolin intake. One datapoint in GLP-1–MK-801 was omitted due to extensive food spillage. e-h, Chow-fed Sprague-Dawley rats were dosed once-daily with s.c. injections of 100 nmol kg−1 MK-801 (n = 8 rats), 100 nmol kg−1 GLP-1 (n = 8 rats), 100 nmol kg−1 GLP-1–MK-801 (n = 8 rats) or vehicle (isotonic saline, n = 8 rats) for three consecutive days while being offered the choice between chow and kaolin. e, Schematic. f, Change in body weight. g, Cumulative food intake. h, Cumulative kaolin intake. Two data points were omitted from analysis in vehicle group due to extensive food spillage. i-m, Wheel running study investigating aversive behaviour in response to treatment. Lean chow-fed male C57BL/6 J mice were single-housed in cages equipped with a running wheel and allowed 3 days of habituation before being treated with once-daily s.c. injections of 100 nmol kg−1 GLP-1–MK-801 (n = 8 mice), 10 nmol kg−1 semaglutide (n = 8 mice) or vehicle (isotonic saline, n = 7 mice) for 5 days with daily measurements of running distance at the time of injection. One mouse in vehicle group was excluded from analysis due to sickness. i, Schematic. j, Change in body weight. k, Cumulative food intake. l, Daily running wheel distance during habituation and treatment period. One datapoint in vehicle group was excluded due to the running wheel got stuck between day -1 to day 0. m, Cumulative running wheel distance during treatment period. Data analysed by two-way repeated measures ANOVA to assess main effect effects of treatment (b, c, f, g, j, k and m) and two-way ANOVA, multiple comparison, Bonferroni post hoc test (h). Data represents mean ± SEM; *P < 0.05, **P < 0.01, ***P < 0.001, ****P < 0.0001. Detailed statistics are in Supplementary Table 1. The diagrams in a, e and i were created using BioRender. Source Data
Extended Data Fig. 10
Extended Data Fig. 10. Bulk RNA-sequencing of hypothalamic nuclei comparing GLP-1–MK-801 and semaglutide treatments.
a-i, Supporting data for study in Fig. 5a–e. Treatment of DIO mice with once-daily s.c. injections of 10 nmol kg−1 semaglutide (n = 6 mice and n = 3 cages), 100 nmol kg−1 GLP-1–MK-801 (n = 6 mice and n = 3 cages) or vehicle (isotonic saline, n = 6 mice and n = 3 cages) for 5 days. a, Schematic. b, Change in body weight. c, Cumulative food intake. d, Top five most enriched functional terms of the 2176 differentially expressed genes that were downregulated following GLP-1–MK-801 treatment relative to semaglutide. e, Top five most enriched functional terms for the 1866 differentially expressed genes that were upregulated following GLP-1–MK-801 treatment relative to semaglutide. f, Venn diagram showing the overlap between the SynGO database and the 4042 differentially expressed genes in response to GLP-1–MK-801 relative to semaglutide. g, Sunburst plot of differentially expressed genes belonging to cellular component functional terms computed with SynGO. Enrichment is colour coded by Q value for the functional terms. All level terms identified have been labelled. h, Sunburst plot of differentially expressed genes belonging to biological process functional terms computed with SynGO. Enrichment is colour coded by Q value for the functional terms. All level terms identified have been labelled. i, Top seven SynGO enriched functional terms for cellular component and biological process. Data analysed by two-way repeated measures ANOVA to assess main effects of treatment (b and c). Benjamini-Hochberg adjusted P (d-i). Data represents mean ± SEM; ***P < 0.001, ****P < 0.0001. Detailed statistics are in Supplementary Table 1. The diagrams in a and f were created using BioRender. Source Data
Extended Data Fig. 11
Extended Data Fig. 11. Whole brain cFos expression in response to semaglutide, MK-801, GLP-1 and GLP-1–MK-801.
a-j, Whole-brain 3D mapping and quantification of cFOS responses to treatment single s.c. injection with 100 nmol kg−1 MK-801 (n = 7 mice), 100 nmol kg−1 GLP-1 (n = 8 mice), 100 nmol kg−1 GLP-1–MK-801 (n = 7 mice) or vehicle (isotonic saline, n = 8 mice) in lean mice. One mouse in MK-801 group, GLP-1–MK-801 group and vehicle group were excluded from analysis due to sample processing related deviation. a, Schematic. b, Mouse brain images showing heatmap of averaged changes in cFOS expression in response to treatments relative to vehicle. Red areas indicate increased cFOS activity and blue areas indicate decreased cFOS activity. c, Heatmap of cFOS activity in brain regions involved in body weight regulation. Values exceeding the colour scale are presented with the numeric values. d, Volcano plot of brain regions regulated in response to MK-801 relative to vehicle. Selected regions are labelled. e, Volcano plot of brain regions regulated in response to GLP-1 relative to vehicle. Selected regions are labelled. f, Volcano plot of brain regions regulated in response to GLP-1–MK-801 relative to vehicle. Selected regions are labelled. g, Quantification of cFOS+ cells in dorsal motor nucleus X (DMX). h, Quantification of cFOS+ cells in nucleus of the solitary tract (NTS). i, Quantification of cFOS+ cells in rostral linear nucleus raphe (RR). j, Quantification of cFOS+ cells in Edinger-Westphal nucleus (EW). k-o, cFOS+ whole-brain imaging data came from mice in Fig. 5f–i. One mouse in GLP-1–MK-801 group excluded due to sample processing related deviation. k, cFOS+ cells in nucleus accumbens (NAc). l, cFOS+ cells in ventral tegmental area (VTA). m, cFOS+ cells in basolateral amygdala nucleus (BLA). n, cFOS+ cells in central amygdala (CEA). o, cFOS+ cells in agranular insular area (AI). Data analysed by one-way ANOVA, multiple comparison, Bonferroni post hoc test (g-o). Data analysed by one-way ANOVA, multiple comparison, Bonferroni post hoc test (g-o). Benjamini-Hochberg adjusted P (d-f). Data represents mean ± SEM; **P < 0.01, ***P < 0.001, ****P < 0.0001. For brain region abbreviations please refer to ‘cFos whole-brain imaging’ in the methods section. Detailed statistics are in Supplementary Table 1. The diagram in a was created using BioRender. Source Data
Extended Data Fig. 12
Extended Data Fig. 12. Bulk RNA sequencing of brainstem and nucleus accumbens after treatment with GLP-1–MK-801.
a-n, Brain nuclei for bulk RNA sequencing of the brainstem came from mice in Fig. 3h, i and Extended Data Fig. 8 treated with 100 nmol kg−1 MK-801 (n = 8 mice), 100 nmol kg−1 GLP-1 (n = 8 mice), 100 nmol kg−1 GLP-1–MK-801 (n = 8 mice) or vehicle (isotonic saline, n = 8 mice) for 5 days. a, Schematic. b, Schematic highlighting the brainstem. c, Venn diagram of differentially expressed genes in response to treatments. d, Volcano plot for differentially expressed genes in response to GLP-1–MK-801. e, Top five most enriched functional terms for the 3594 differentially expressed genes between GLP-1–MK-801 and vehicle. f, Top five most enriched functional terms for the 2076 differentially expressed genes that were upregulated in response to GLP-1–MK-801 treatment relative to vehicle. g, Top five most enriched functional terms for the 1518 differentially expressed genes that were downregulated following GLP-1–MK-801 treatment relative to vehicle. h, Top eleven cellular component and top three biological process functional terms identified using gene set enrichment (GSEA) analysis. i, Venn diagram showing the overlap with the SynGO database and the 3594 differentially expressed genes in response to GLP-1–MK-801. j, Sunburst plot of differentially expressed genes belonging to cellular component functional terms computed with SynGO. Enrichment is colour coded by Q value for the functional terms. All level terms identified have been labelled. k, Sunburst plot of differentially expressed genes belonging to biological process functional terms computed with SynGO. Enrichment is colour coded by Q value for the functional terms. All level terms identified have been labelled. l, Schematic highlighting the nucleus accumbens. m, Venn diagram of differentially expressed genes in response to treatments. n, Volcano plot for differentially expressed genes of GLP-1–MK-801. Benjamini-Hochberg adjusted P (c-n). Detailed statistics are in Supplementary Table 1. The diagrams in a-c, i, l and m were created using BioRender. Source Data

Comment in

Similar articles

Cited by

References

    1. Locke AE, et al. Genetic studies of body mass index yield new insights for obesity biology. Nature. 2015;518:197–206. doi: 10.1038/nature14177. - DOI - PMC - PubMed
    1. Kim J, Farchione T, Potter A, Chen Q, Temple R. Esketamine for treatment-resistant depression—first FDA-approved antidepressant in a new class. N. Engl. J. Med. 2019;381:1–4. doi: 10.1056/NEJMp1903305. - DOI - PubMed
    1. Robinson DM, Keating GM. Memantine: a review of its use in Alzheimer’s disease. Drugs. 2006;66:1515–1534. doi: 10.2165/00003495-200666110-00015. - DOI - PubMed
    1. Zanos P, Gould TD. Mechanisms of ketamine action as an antidepressant. Mol. Psychiatry. 2018;23:801–811. doi: 10.1038/mp.2017.255. - DOI - PMC - PubMed
    1. Turcot V, et al. Protein-altering variants associated with body mass index implicate pathways that control energy intake and expenditure in obesity. Nat. Genet. 2018;50:26–41. doi: 10.1038/s41588-017-0011-x. - DOI - PMC - PubMed

MeSH terms

Substances