. 2024 Oct;56(7):7561-7573.
doi: 10.3758/s13428-024-02436-x. Epub 2024 May 15.

Measuring temporal bias in sequential numerosity comparison

Affiliations

Measuring temporal bias in sequential numerosity comparison

Serena Dolfi et al. Behav Res Methods. 2024 Oct.

Abstract

While several methods have been proposed to assess the influence of continuous visual cues in parallel numerosity estimation, the impact of temporal magnitudes on sequential numerosity judgments has been largely ignored. To overcome this issue, we extend a recently proposed framework that makes it possible to separate the contribution of numerical and non-numerical information in numerosity comparison by introducing a novel stimulus space designed for sequential tasks. Our method systematically varies the temporal magnitudes embedded into event sequences through the orthogonal manipulation of numerosity and two latent factors, which we designate as "duration" and "temporal spacing". This allows us to measure the contribution of finer-grained temporal features on numerosity judgments in several sensory modalities. We validate the proposed method on two different experiments in both visual and auditory modalities: results show that adult participants discriminated sequences primarily by relying on numerosity, with similar acuity in the visual and auditory modality. However, participants were similarly influenced by non-numerical cues, such as the total duration of the stimuli, suggesting that temporal cues can significantly bias numerical processing. Our findings highlight the need to carefully consider the continuous properties of numerical stimuli in a sequential mode of presentation as well, with particular relevance in multimodal and cross-modal investigations. We provide the complete code for creating sequential stimuli and analyzing participants' responses.

Keywords: Audition; Continuous magnitudes; Duration; Numerical cognition; Temporal numerosity; Vision.


Conflict of interest statement

The authors have no competing interests to declare that are relevant to the content of this article.

Figures

Fig. 1
Fig. 1
Temporal magnitudes in sequential non-numerical stimuli. Schematic representation of an example of an auditory sequence of events. Black sections of the sequence timeline highlight on separate rows the temporal features considered by the illustrated method.
Fig. 2
Fig. 2
Relationship between extrinsic and intrinsic temporal features. A Depiction of the relationship between numerosity and the considered intrinsic and extrinsic temporal magnitudes. Duration is the axis orthogonal to numerosity representing a change in total event duration (TED) and mean event duration (MED). Similarly, temporal spacing is the axis representing a change in both total stimulus duration (TSD) and mean event period (MEP). B Schematic representation of the three-dimensional parameter space defined by taking numerosity, duration, and temporal spacing as cardinal axes.
Fig. 3
Fig. 3
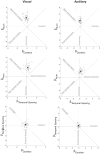
Results from GLM analysis of visual and auditory comparison tasks. Individual coefficient estimates are plotted in the three orthogonal planes defined by the cardinal axes, with visual modality in the left column and auditory modality in the right column. Gray dots indicate individual participants, while the black dots indicate the group means. Gray lines represent the temporal features.
Fig. 4
Fig. 4
Group results of visual and auditory comparison tasks. A Distributions of individual coefficient estimates for numerosity, duration, and temporal spacing in the visual (left) and auditory modality (right). B Psychometric curves derived from the coefficients estimated at the group level. Black lines represent the predicted probability of choosing the first sequence as a function of the logarithm of the first to second numerosity ratios when the ratios of duration and temporal spacing are equal to 1. Red lines represent the same probability in trials with large ratios of duration and temporal spacing ratio equal to 1, while green lines are the predicted curves for trials with large temporal spacing ratios and duration ratio equal to 1. In both cases, full lines represent trials where the first sequence has a larger duration or temporal spacing than the second, and dashed lines indicate the opposite.
Fig. 5
Fig. 5
Results from projection analysis in visual and auditory tasks. Distribution of differences between the numerosity coefficient and the projection of the individual discrimination vector onto each temporal feature line for the visual (left column) and auditory modality (right column). Positive values indicate discrimination vectors closer to the numerosity dimension compared to the considered feature, while negative values indicate closer proximity to the specific feature.
Fig. 6
Fig. 6
Comparison of vector line angle between modalities. Distribution of the angles (in degrees) between the individual discrimination vectors and the numerosity dimension in the two modalities (visual: black; auditory: gray)

References

    1. Abalo-Rodríguez, I., De Marco, D., & Cutini, S. (2022). An undeniable interplay: Both numerosity and visual features affect estimation of non-symbolic stimuli. Cognition,222, 104944. 10.1016/j.cognition.2021.104944 10.1016/j.cognition.2021.104944 - DOI - PubMed
    1. Agrillo, C., Dadda, M., Serena, G., & Bisazza, A. (2008). Do fish count? Spontaneous discrimination of quantity in female mosquitofish. Animal Cognition,11(3), 495–503. 10.1007/s10071-008-0140-9 10.1007/s10071-008-0140-9 - DOI - PubMed
    1. Agrillo, C., Ranpura, A., & Butterworth, B. (2010). Time and numerosity estimation are independent: Behavioral evidence for two different systems using a conflict paradigm. Cognitive Neuroscience,1(2), 96–101. 10.1080/17588921003632537 10.1080/17588921003632537 - DOI - PubMed
    1. Anobile, G., Arrighi, R., Castaldi, E., Grassi, E., Pedonese, L., Moscoso, P. A. M., & Burr, D. C. (2018). Spatial but not temporal numerosity thresholds correlate with formal math skills in children. Developmental Psychology,54(3), 458–473. 10.1037/dev0000448 10.1037/dev0000448 - DOI - PubMed
    1. Anobile, G., Cicchini, G. M., & Burr, D. C. (2016). Number As a Primary Perceptual Attribute: A Review. Perception (Vol. 45, Issues 1–2). 10.1177/0301006615602599 - PMC - PubMed

Publication types

LinkOut - more resources