. 2024 May 15;26(1):13.
doi: 10.1186/s12575-024-00239-0.

Breaking the Mucin Barrier: A New Affinity Chromatography-Mass Spectrometry Approach to Unveil Potential Cell Markers and Pathways Altered in Pseudomyxoma Peritonei

Affiliations

Breaking the Mucin Barrier: A New Affinity Chromatography-Mass Spectrometry Approach to Unveil Potential Cell Markers and Pathways Altered in Pseudomyxoma Peritonei

Antonio Romero-Ruiz et al. Biol Proced Online. .

Abstract

Background: Pseudomyxoma peritonei (PMP) is a rare peritoneal mucinous carcinomatosis with largely unknown underlying molecular mechanisms. Cytoreductive surgery combined with hyperthermic intraperitoneal chemotherapy is the only therapeutic option; however, despite its use, recurrence with a fatal outcome is common. The lack of molecular characterisation of PMP and other mucinous tumours is mainly due to the physicochemical properties of mucin.

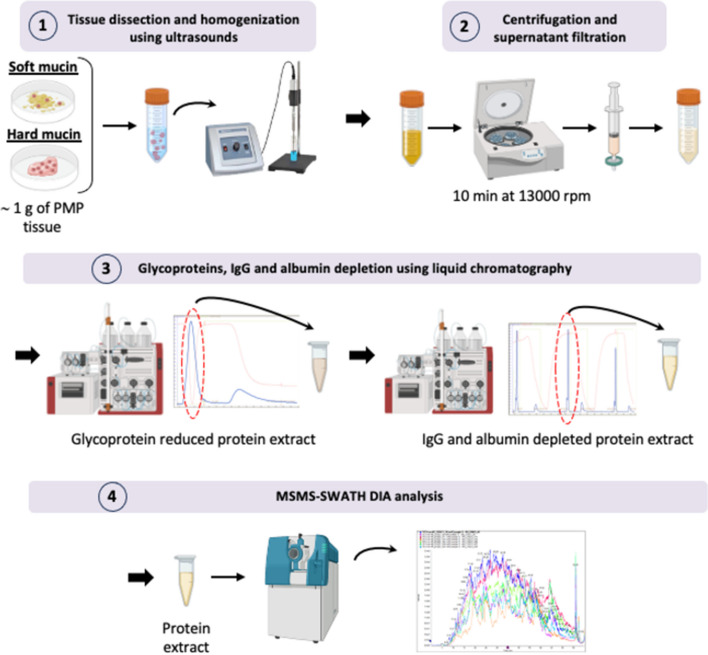
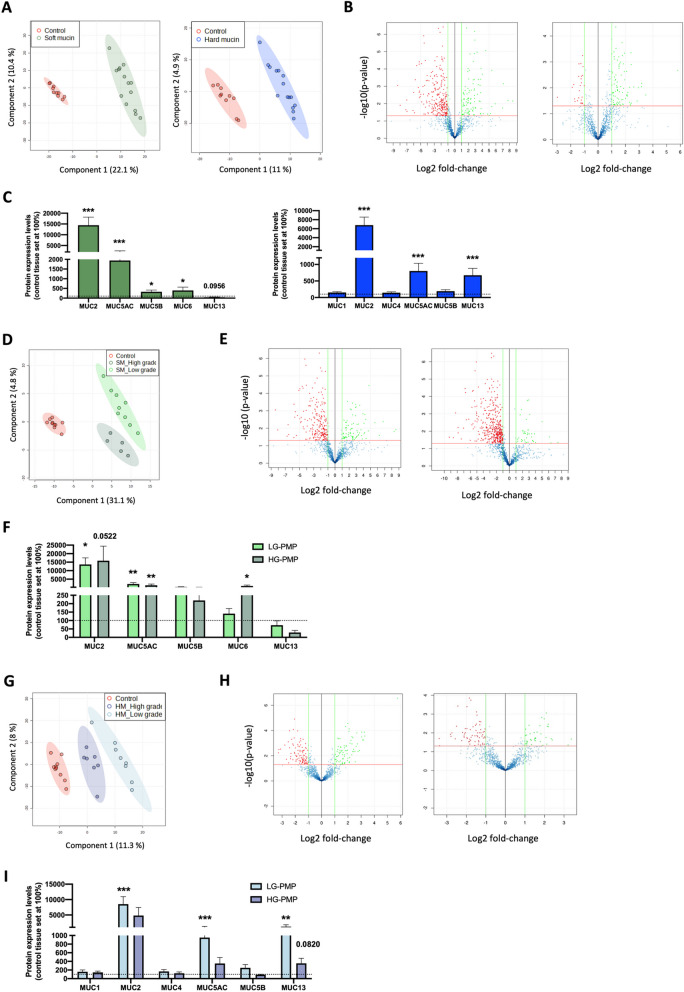
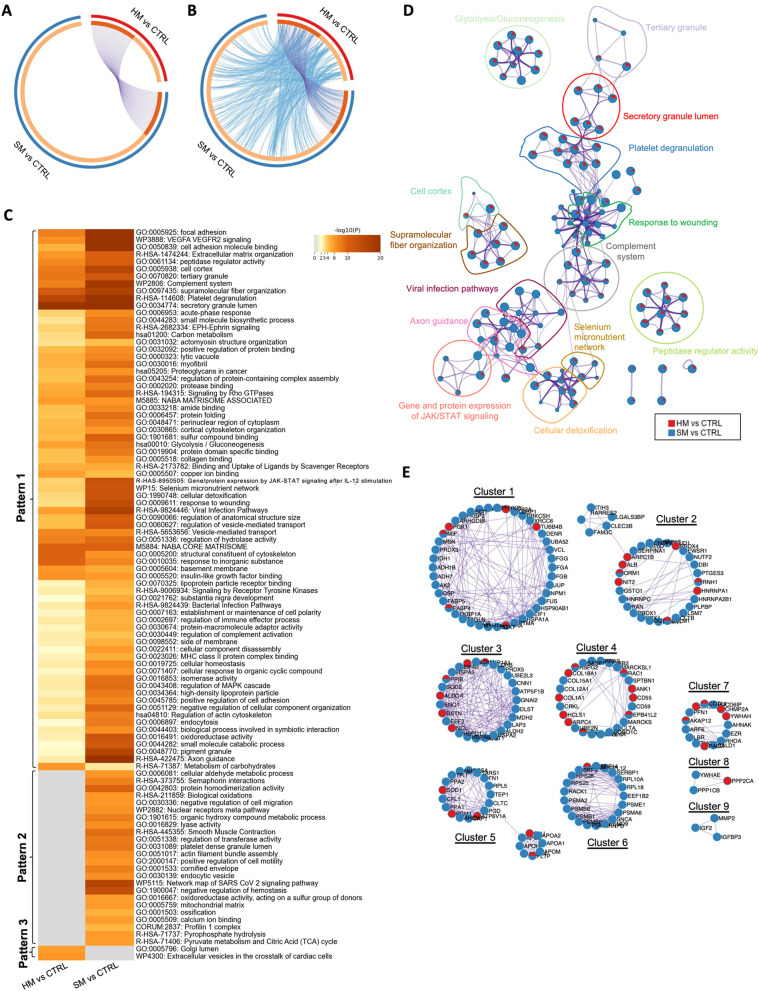
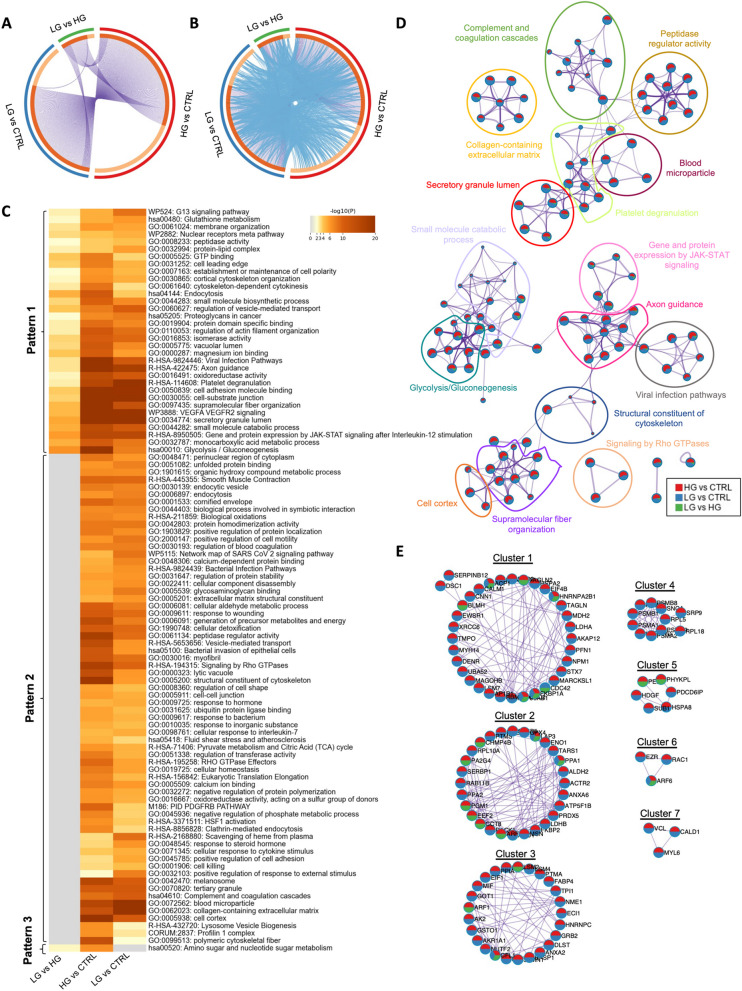
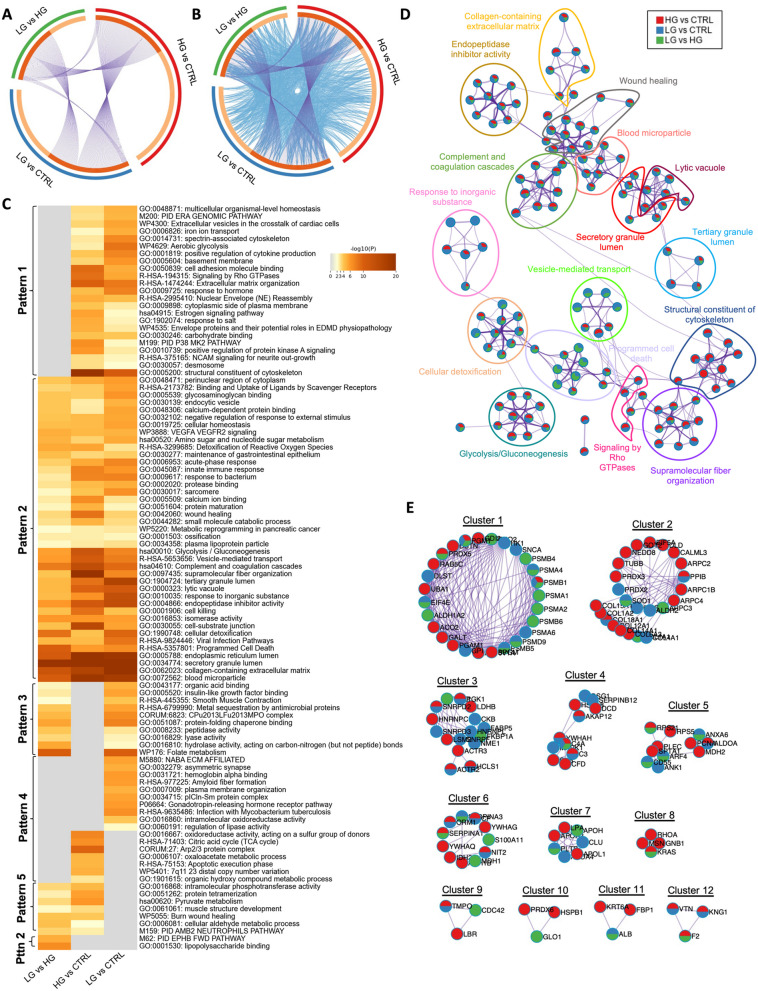
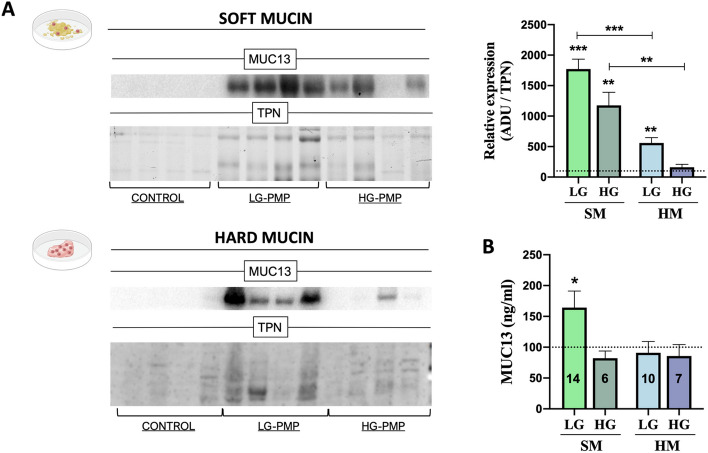
Results: This manuscript describes the first protocol capable of breaking the mucin barrier and isolating proteins from mucinous tumours. Briefly, mucinous tumour samples were homogenised and subjected to liquid chromatography using two specific columns to reduce mainly glycoproteins, albumins and immunoglobulin G. The protein fractions were then subjected to mass spectrometry analysis and the proteomic profile obtained was analysed using various bioinformatic tools. Thus, we present here the first proteome analysed in PMP and identified a distinct mucin isoform profile in soft compared to hard mucin tumour tissues as well as key biological processes/pathways altered in mucinous tumours. Importantly, this protocol also allowed us to identify MUC13 as a potential tumour cell marker in PMP.

Conclusions: In sum, our results demonstrate that this protein isolation protocol from mucin will have a high impact, allowing the oncology research community to more rapidly advance in the knowledge of PMP and other mucinous neoplasms, as well as develop new and effective therapeutic strategies.

Keywords: Cancer; MUC13; Mucin; Protein; Pseudomyxoma peritonei.


Conflict of interest statement

The authors declare no competing interests.

Figures

Fig. 1
Fig. 1
Schematic of the adapted method to isolate proteins from mucin. Adapted method to isolate proteins from mucin (AMIPROM): samples of soft and hard mucin obtained from LG-PMP and HG-PMP are cut into small pieces and homogenised using ultrasound. The homogenate is then centrifuged and the supernatant is collected and filtered. The homogenate is then subjected to liquid chromatography (LC) using two different columns to reduce the most abundant glycoproteins, IgGs, and albumin from the sample. The LC-derived protein extract is subjected to mass spectrometry analysis using an unbiased targeted proteomic approach with SWATH-MS
Fig. 2
Fig. 2
Proteomic analysis of soft and hard mucin obtained from LG-PMP and HG-PMP samples compared to control samples. A Partial least squares discriminant analysis (PLS-DA) of the proteome profile between soft (left; n = 14) and hard (right; n = 15) mucin samples and control tissues (n = 10). B Volcano plots showing Log2 Fold Change expression vs –log10 (p-value) of differentially expressed proteins with a p-value < 0.05 and an absolute Log2 Fold Change > 1 in the same sample set. Green colour indicates up-regulated proteins and red colour indicates down-regulated proteins. C Protein expression levels of mucin isoforms identified in soft mucin (green bars) and hard mucin (blue bars) mucin samples from PMP compared to control tissue (set to 100%; dashed line). D, G PLS-DA analysis of the proteome profile of low and high-grade soft mucin (SM) (D) and hard mucin (HM) (G) samples compared to control tissues. E, H Volcano plots showing Log2 Fold Change expression vs –log10 (p-value) of differentially expressed proteins with a p-value < 0.05 and an absolute Log2 Fold Change > 1 in low (left panel) and high-grade (right panel) soft mucin (E) and hard mucin (H) samples compared to control tissues. F, I Protein expression levels of identified mucin isoforms in low (light bars) and high-grade (dark bars) soft mucin (F) and hard mucin (I) samples compared to control tissue (set to 100%; dashed line). * p < 0.05 and, ** p < 0.01, *** p < 0.001
Fig. 3
Fig. 3
Visualisation of the functional enrichment meta-analysis based on two protein lists [soft mucin (SM) vs. control (CTRL) and hard mucin (HM) vs. control (CTRL)]. A Circos plot visualisation of the overlap between the protein lists (SM vs. CTRL and HM vs. CTRL). Each candidate protein is assigned to a point on the arc of the corresponding protein list(s). Proteins common to both lists are connected by purple curves. B Circos plot visualisation with blue curves connecting those candidate proteins that have different identities but share an enriched pathway/process, i.e. they represent the functional overlap between the protein lists. C Heatmap showing the top 100 enrichment clusters, one row per cluster, using a discrete colour scale to represent statistical significance. Grey colour indicates the lack of enrichment for that term in the corresponding gene list, light yellow colour indicates the boundary between significance and insignificance, deep yellow colour indicates a high degree of significance. D Enrichment network visualisation for results from the two protein lists, where nodes are represented by pie charts indicating their associations with each input list. Cluster labels have been added manually. The colour code represents the identities of the protein lists, where blue indicates SM vs. CTRL and red indicates HM vs. CTRL. E Visualisation of the PPI network and MCODE components identified from the combined protein list, where each node represents a protein with a pie chart encoding its origin. Colour codes for pie sectors represent a protein list
Fig. 4
Fig. 4
Visualisation of the functional enrichment meta-analysis based on three protein lists [LG vs. control (CTRL), HG vs. control (CTRL) and LG vs. HG)] in soft mucin samples compared to control tissues. A Circos plot visualising the overlap between the protein lists. Each candidate protein is assigned to a point on the arc of the corresponding protein list(s). Proteins common to both lists are connected by purple curves. B Circos plot visualisation with blue curves connecting those candidate proteins that have different identities but share an enriched pathway/process, i.e. they represent the functional overlap between protein lists. C Heatmap showing the top 100 enrichment clusters, one row per cluster, using a discrete colour scale to represent statistical significance. Grey colour indicates the lack of enrichment for that term in the corresponding gene list, light yellow colour indicates the boundary between significance and insignificance, deep yellow colour indicates a high degree of significance. D Enrichment network visualisation for results from the three protein lists, where nodes are represented by pie charts indicating their associations with each input list. Cluster labels have been added manually. Colour code represents the identities of protein lists, where blue indicates LG vs. CTRL, red indicates HG vs. CTRL and green indicates LG vs. HG. E Visualisation of the PPI network and MCODE components identified from the combined protein list, where each node represents a protein with a pie chart encoding its origin. Colour codes for pie sectors represent a protein list
Fig. 5
Fig. 5
Visualisation of the functional enrichment meta-analysis based on three protein lists [LG vs. control (CTRL), HG vs. control (CTRL) and LG vs. HG] in hard mucin samples compared to control tissues. A Circos plot visualising the overlap between protein lists. Each candidate protein is assigned to a point on the arc of the corresponding protein list(s). Proteins common to both lists are connected by purple curves. B Circos plot visualisation with blue curves connecting those candidate proteins that have different identities but share an enriched pathway/process, i.e. they represent the functional overlap between protein lists. C Heatmap showing the top 100 enrichment clusters, one row per cluster, using a discrete colour scale to represent statistical significance. Grey colour indicates the lack of enrichment for that term in the corresponding gene list, light yellow colour indicates the boundary between significance and insignificance, deep yellow colour indicates a high degree of significance. D Enrichment network visualisation for results from the three protein lists, where nodes are represented by pie charts indicating their associations with each input list. Cluster labels have been added manually. Colour code represents the identities of protein lists, where blue indicates LG vs. CTRL, red indicates HG vs. CTRL and green indicates LG vs. HG. E Visualization of the PPI network and MCODE components identified from the combined protein list, where each node represents a protein with a pie chart encoding its origin. Colour codes for pie sectors represent a protein list
Fig. 6
Fig. 6
Validation of MUC13 expression levels in PMP. A Protein expression levels of MUC13 in soft mucin (SM – green bars) and hard mucin (HM – blue bars) [low (LG-PMP; n = 4) and high-grade (HG-PMP; n = 4)] compared to control tissues (n = 4; no tumoral appendix) evaluated by Western Blot. The arbitrary densitometric unit (ADU) for each protein was normalised by the Total Protein Normalisation (TPN) value. B Cohort validation of MUC13 by ELISA quantification SM and HM samples [low (LG-PMP) and high-grade (HG-PMP)] compared to control tissues (n = 16) (number of PMP samples analysed is indicated in the bars of the graph). One-way ANOVA analysis was performed for multiple comparisons (LG and HG-PMP vs Control). * p < 0.05 and *** p < 0.001

References

    1. Sommariva A, Tonello M, Rigotto G, Lazzari N, Pilati P, Calabrò ML. Novel Perspectives in Pseudomyxoma Peritonei Treatment. Cancers (Basel) 2021;13:5965. doi: 10.3390/cancers13235965. - DOI - PMC - PubMed
    1. Arjona-Sánchez Á, Muñoz-Casares FC, Rufián-Peña S, Díaz-Nieto R, Casado-Adam Á, Rubio-Pérez MJ, et al. Pseudomyxoma peritonei treated by cytoreductive surgery and hyperthermic intraperitoneal chemotherapy: results from a single centre. Clin Transl Oncol. 2011;13:261–7. doi: 10.1007/s12094-011-0651-8. - DOI - PubMed
    1. Delhorme J-B, Severac F, Averous G, Glehen O, Passot G, Bakrin N, et al. Cytoreductive surgery and hyperthermic intraperitoneal chemotherapy for pseudomyxoma peritonei of appendicular and extra-appendicular origin. Br J Surg. 2018;105:668–76. doi: 10.1002/bjs.10716. - DOI - PubMed
    1. Arjona-Sánchez Á, Muñoz-Casares FC, Casado-Adam Á, Sánchez-Hidalgo JM, Teran MDA, Orti-Rodriguez R, et al. Outcome of Patients with Aggressive Pseudomyxoma Peritonei Treated by Cytoreductive Surgery and Intraperitoneal Chemotherapy. World J Surg. 2013;37:1263–70. doi: 10.1007/s00268-013-2000-2. - DOI - PubMed
    1. Baratti D, Kusamura S, Milione M, Bruno F, Guaglio M, Deraco M. Validation of the Recent PSOGI Pathological Classification of Pseudomyxoma Peritonei in a Single-Center Series of 265 Patients Treated by Cytoreductive Surgery and Hyperthermic Intraperitoneal Chemotherapy. Ann Surg Oncol. 2017;25:1–10. - PubMed