. 2024 May 15;22(1):460.
doi: 10.1186/s12967-024-05284-7.

CCT6A facilitates lung adenocarcinoma progression and glycolysis via STAT1/HK2 axis

Affiliations

CCT6A facilitates lung adenocarcinoma progression and glycolysis via STAT1/HK2 axis

Shao-Kun Yu et al. J Transl Med. .

Abstract

Background: Chaperonin Containing TCP1 Subunit 6 A (CCT6A) is a prominent protein involved in the folding and stabilization of newly synthesized proteins. However, its roles and underlying mechanisms in lung adenocarcinoma (LUAD), one of the most aggressive cancers, remain elusive.

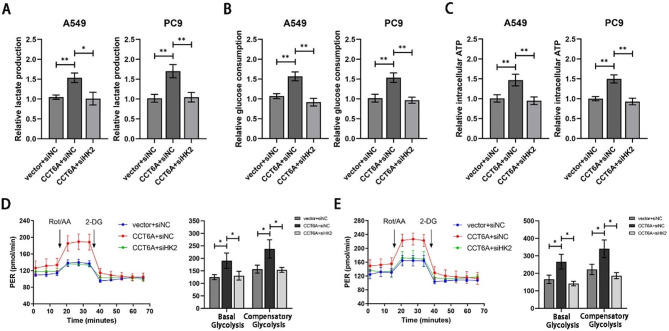
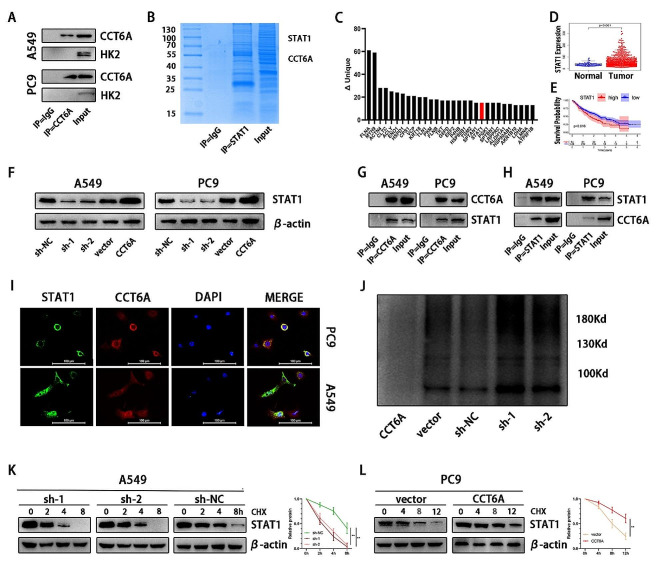
Methods: Our study utilized in vitro cell phenotype experiments to assess CCT6A's impact on the proliferation and invasion capabilities of LUAD cell lines. To delve into CCT6A's intrinsic mechanisms affecting glycolysis and proliferation in lung adenocarcinoma, we employed transcriptomic sequencing and liquid chromatography-mass spectrometry analysis. Co-immunoprecipitation (Co-IP) and chromatin immunoprecipitation (CHIP) assays were also conducted to substantiate the mechanism.

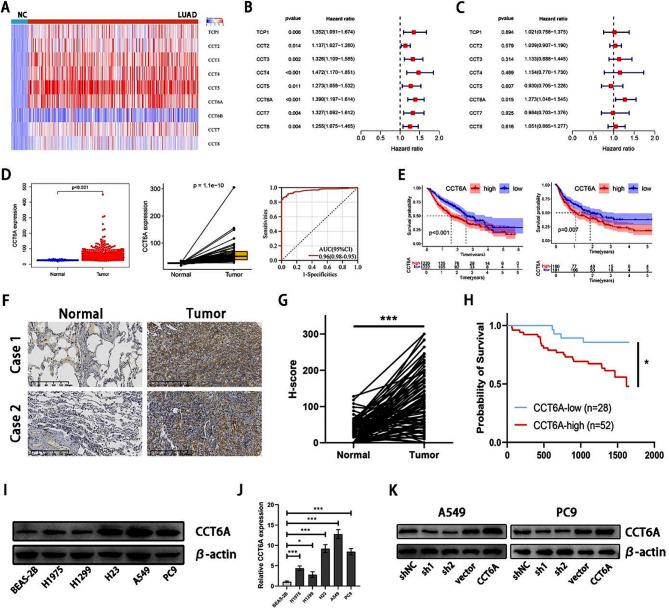
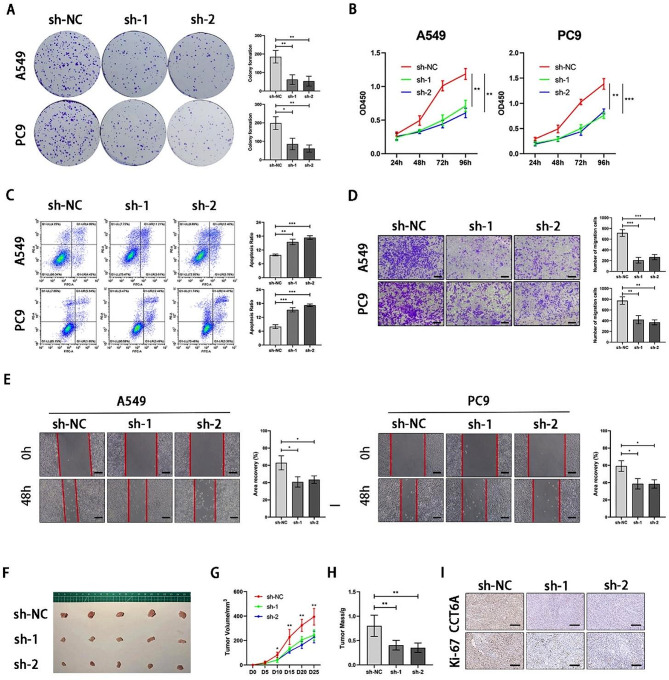
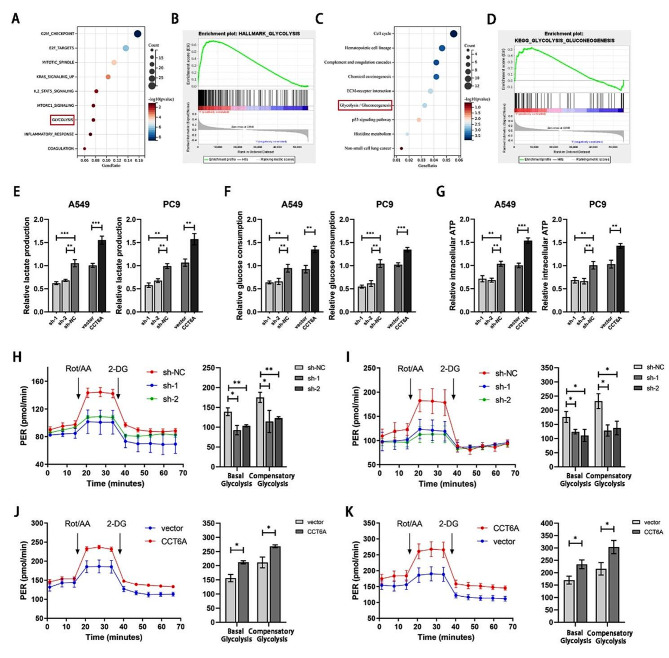
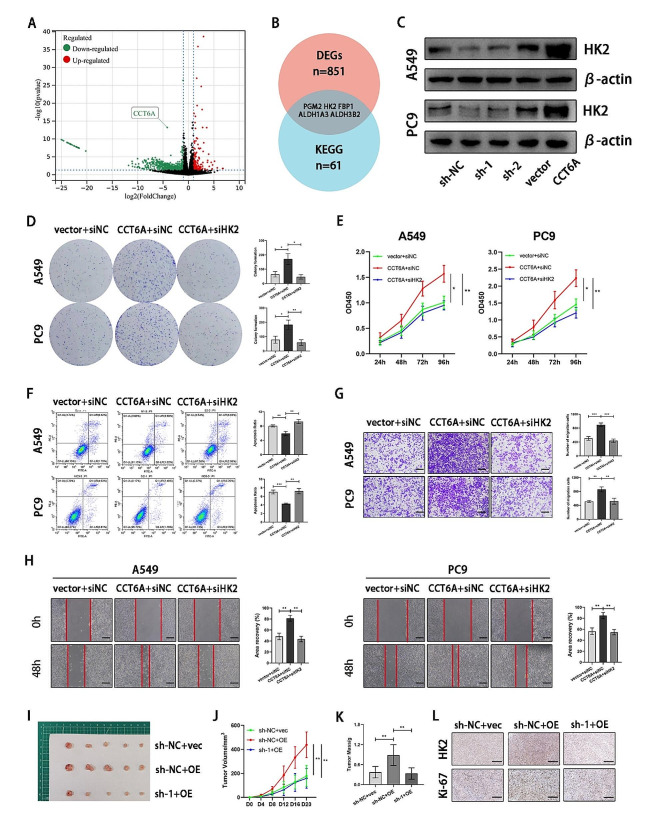
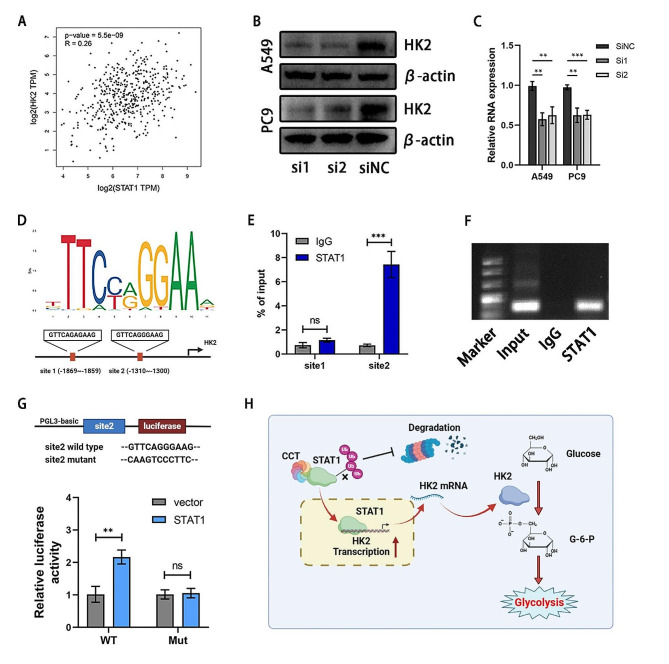
Results: CCT6A was found to be significantly overexpressed in LUAD and associated with a poorer prognosis. The silencing of CCT6A inhibited the proliferation and migration of LUAD cells and elevated apoptosis rates. Mechanistically, CCT6A interacted with STAT1 protein, forming a complex that enhances the stability of STAT1 by protecting it from ubiquitin-mediated degradation. This, in turn, facilitated the transcription of hexokinase 2 (HK2), a critical enzyme in aerobic glycolysis, thereby stimulating LUAD's aerobic glycolysis and progression.

Conclusion: Our findings reveal that the CCT6A/STAT1/HK2 axis orchestrated a reprogramming of glucose metabolism and thus promoted LUAD progression. These insights position CCT6A as a promising candidate for therapeutic intervention in LUAD treatment.

Keywords: Aerobic glycolysis; CCT6A; HK2; Lung adenocarcinoma; STAT1.


Conflict of interest statement

The authors have declared that no competing interest exists.

Figures

Fig. 1
Fig. 1
CCT6A was highly expressed in LUAD and negatively correlated with the prognosis. (A) Heatmap of the CCT family gene expression in LUAD based on TCGA. (B) Univariate Cox analysis of the prognosis-related CCT family genes based on TCGA. (C) Multivariate Cox analysis of the prognosis-related CCT family genes based on TCGA. (D) Unpaired (left) and paired (middle) t tests of CCT6A expression between LUAD and normal tissues and ROC curve showing the sensitivity and specificity to predict the occurrence of LUAD (right) based on TCGA. (E) Kaplan Meier plots showing the significant difference of OS (left) and PFS (right) in LUAD patients between the CCT6A-high and CCT6A-low samples based on GSE68465. (F) Representative IHC plots of tumor and paired normal tissues (20×magnification). Scale bars = 200 μm. (G) Paired t tests of the H-score between tumor and normal tissues. (H) Kaplan Meier plots showing the significant difference of OS in LUAD patients with CCT6A-high and CCT6A-low tissues. (I) CCT6A protein expression in normal lung epithelial cell line and different LUAD cell lines. (J) CCT6A mRNA expression in normal lung epithelial cell line and different LUAD cell lines. (K) The transfection efficiency of shRNAs and plasmid in A549 and PC9 cell lines
Fig. 2
Fig. 2
Loss of CCT6A inhibits the proliferation of LUAD in vitro and in vivo (A-B) Colony formation assays and growth curves (days 1–4) represented the proliferation of A549/PC9 cells infected with sh-NC or sh-CCT6A. Representative images of the crystal violet staining of cells in a 6-well plate and statistics were shown. (C) CCT6A knockdown resulted in increased apoptosis in LUAD cells. Representative FACS images and statistics based on three independent experiments were shown. (D) Transwell assays were performed to assess the migration of A549/PC9 cells infected with sh-NC or CCT6A-sh-1/2. Cells crossing the membrane were dyed with crystal violet (10×magnification). Scale bars = 100 μm. (E) Migration of A549/PC9 cells with CCT6A knockdown was assessed using wound healing assays. Area coverages were observed at 48 h (10× magnification). Scale bars = 100 μm. (F) Representative images of subcutaneous tumors on the left flank of mice injected with sh-NC or sh-CCT6A A549 cell (n = 5, each group). (G) Tumor growth curves were plotted every 5 days to 25days. (H) The weight of tumors was measured. (I) Representative images of IHC staining for CCT6A and Ki67 proteins (20×magnification). Scale bars = 100 μm. * P < 0.05; ** P < 0.01; *** P < 0.001. Variables are presented as mean ± SD
Fig. 3
Fig. 3
CCT6A promoted glycolysis of LUAD. (A) Bubble plot of enriched hallmark pathways based on differential genes between CCT6A-high and CCT6A-low samples. (B) GSEA plot of hallmark-glycolysis pathway based on CCT6A expression. (C) Bubble plot of enriched KEGG pathways based on differential genes between CCT6A-high and CCT6A-low samples. (D) GSEA plot of KEGG-glycolysis-gluconeogenesis pathway based on CCT6A expression. (E-G) The impact of CCT6A knockdown and overexpression on lactate production, glucose consumption, and intracellular ATP in A549/PC9 cells after 24 h was evaluated. (H-K) Proton efflux rate (PER) in CCT6A knockdown and overexpression A549/PC9 cells. Basal glycolysis and compensatory glycolysis were quantified and shown as histograms. * P < 0.05; ** P < 0.01; *** P < 0.001. Variables are presented as mean ± SD
Fig. 4
Fig. 4
Oncogenic role of CCT6A depended on HK2. (A) Volcano plot of genes significantly downregulated or upregulated upon CCT6A knockdown. (B) Venn diagram of differential genes (|log2FC|>1, P < 0.05) upon CCT6A knockdown and associated with the glycolysis metabolism. (C) HK2 expression in cells infected with sh-NC, sh-CCT6A, vector, and CCT6A-OE plasmid were shown by WB. (D-E) Colony formation assays and growth curves (days 1–4) represented the proliferation of A549/PC9 cells treated with vector or CCT6A-OE plasmid plus siNC/siHK2, Representative images of the crystal violet staining of cells in a 6-well plate and statistics were shown. (F) HK2 knockdown reversed the deceased apoptosis induced by CCT6A overexpression. Representative FACS images and statistics based on three independent experiments were shown. (G) Transwell assays showed migration of vector/CCT6A-overexpression infected A549/PC9 cells with siNC/siHK2 (10×magnification). Scale bars = 100 μm. (H) Scratch wound healing represented the migration of A549/PC9 cells treated with vector or CCT6A-OE plasmid plus siNC/siHK2 (10× magnification). Scale bars = 100 μm. (I) Representative images of subcutaneous tumors on the left flank of mice injected with A549/PC9 cells treated with sh-NC or sh-1 plus vector/HK2-OE plasmid (n = 5, each group). (J) Tumor growth curves were plotted every 4 days to 20days. (K) The weight of tumors was measured. (L) Representative images of IHC staining for HK2 and Ki67 proteins (20×magnification). Scale bars = 100 μm. * P < 0.05; ** P < 0.01; *** P < 0.001. Variables are presented as mean ± SD
Fig. 5
Fig. 5
CCT6A promoted glycolysis in a HK2-dependent way. (A-C) Lactate production, glucose consumption, and intracellular ATP in A549/PC9 cells treated with vector or CCT6A-OE plasmid plus siNC/siHK2 was evaluated. (D-E) Proton efflux rate (PER) in A549/PC9 cells treated with vector or CCT6A-OE plasmid plus siNC/siHK2. Basal glycolysis and compensatory glycolysis were quantified and shown as histograms. * P < 0.05; ** P < 0.01; *** P < 0.001. Variables are presented as mean ± SD
Fig. 6
Fig. 6
CCT6A bound and stabilized STAT1 protein. (A) Immunoprecipitation of cell lysates from A549/PC9 cells using anti-CCT6A or IgG antibodies, and immunoprecipitants were blotted with anti-CCT6A or anti-HK2 antibodies. (B) Coomassie blue staining of proteins immunoprecipitated by anti-CCT6A or IgG antibodies and input. (C) Bar plot showing proteins specifically binding with CCT6A. (D) Unpaired t tests of STAT1 expression between LUAD and normal tissues based on TCGA. (E) Kaplan Meier plots showing the significant difference of OS in LUAD patients between the STAT1-high and STAT1-low samples based on TCGA. (F) STAT1 expression in A549/PC9 cells infected with sh-NC/sh-CCT6A or vector/CCT6A-OE plasmid shown by WB. (G-H) Immunoprecipitation of cell lysates from A549/PC9 cells using anti-CCT6A, anti-STAT1 or IgG antibodies, and immunoprecipitants were blotted with anti-STAT1 or anti-CCT6A antibodies. (I) Immunofluorescence images showing the distribution of CCT6A (red) and STAT1 (green) in A549/PC9 cells (40×magnification). Scale bars = 100 μm. (J) After 48 h transfection, A549 cells overexpressed CCT6A were treated with MG132 for 8 h and followed by IP and western blot. (K) A549 cells infected with CCT6A knockdown were treated with CHX for indicated time and immunoblotting analysis was performed. (L) PC9 cells infected with CCT6A overexpression were treated with CHX for indicated time and immunoblotting analysis was performed. * P < 0.05; ** P < 0.01; *** P < 0.001. Variables are presented as mean ± SD
Fig. 7
Fig. 7
STAT1 facilitates the transcription of HK2. (A) STAT1 was positively correlated with the HK2 expression in LUAD cohort. (B-C) Western blot and PCR results suggested the HK2 expression decreased as STAT1 knockdown. (D) Bioinformation analysis of the promoter binding sites of STAT1. (E) ChIP assay results shown by qPCR indicated the binding of STAT1 on the site2 of HK2 promoter. (F) Agarose gel electrophoresis suggested STAT1 could bind HK2 promoter on site2. (G) Mut and WT sequences of the HK2 promoter site2 were respectively constructed. A luciferase reporter assay was performed to detect the luciferase activity. (H)) Schematic diagram of CCT6A/STAT1/ HK2 axis promoting the glycolysis in LUAD cells. * P < 0.05; ** P < 0.01; *** P < 0.001. Variables are presented as mean ± SD

Similar articles

Cited by

References

    1. Sung H, Ferlay J, Siegel RL, Laversanne M, Soerjomataram I, Jemal A, et al. Global Cancer statistics 2020: GLOBOCAN estimates of incidence and Mortality Worldwide for 36 cancers in 185 countries. CA Cancer J Clin. 2021;71:209–49. doi: 10.3322/caac.21660. - DOI - PubMed
    1. Nicholson AG, Tsao MS, Beasley MB, Borczuk AC, Brambilla E, Cooper WA, et al. The 2021 WHO classification of lung tumors: impact of advances since 2015. J Thorac Oncol. 2022;17:362–87. doi: 10.1016/j.jtho.2021.11.003. - DOI - PubMed
    1. Tan AC, Tan DSW. Targeted therapies for Lung Cancer patients with oncogenic driver molecular alterations. J Clin Oncol. 2022;40:611–25. doi: 10.1200/JCO.21.01626. - DOI - PubMed
    1. Huang C, Azizi P, Vazirzadeh M, Aghaei-Zarch SM, Aghaei-Zarch F, Ghanavi J, et al. Non-coding RNAs/DNMT3B axis in human cancers: from pathogenesis to clinical significance. J Transl Med. 2023;21:621. doi: 10.1186/s12967-023-04510-y. - DOI - PMC - PubMed
    1. Fattahi M, Rezaee D, Fakhari F, Najafi S, Aghaei-Zarch SM, Beyranvand P, et al. microRNA-184 in the landscape of human malignancies: a review to roles and clinical significance. Cell Death Discov. 2023;9:423. doi: 10.1038/s41420-023-01718-1. - DOI - PMC - PubMed

Publication types

MeSH terms