. 2024 May 15;21(1):130.
doi: 10.1186/s12974-024-03117-4.

Overexpression of pathogenic tau in astrocytes causes a reduction in AQP4 and GLT1, an immunosuppressed phenotype and unique transcriptional responses to repetitive mild TBI without appreciable changes in tauopathy

Affiliations

Overexpression of pathogenic tau in astrocytes causes a reduction in AQP4 and GLT1, an immunosuppressed phenotype and unique transcriptional responses to repetitive mild TBI without appreciable changes in tauopathy

Camila Ortiz et al. J Neuroinflammation. .

Abstract

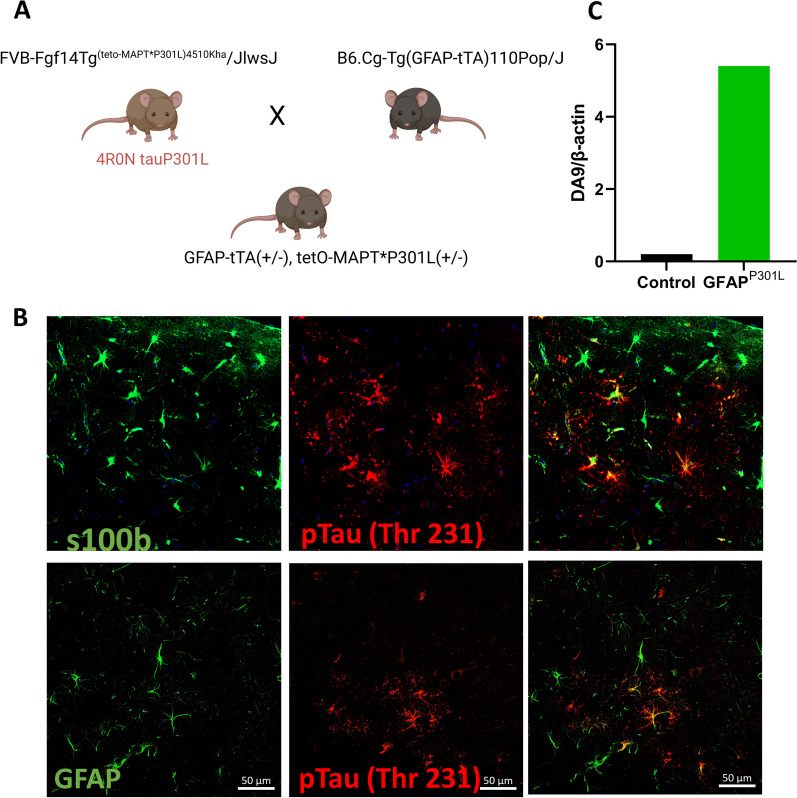
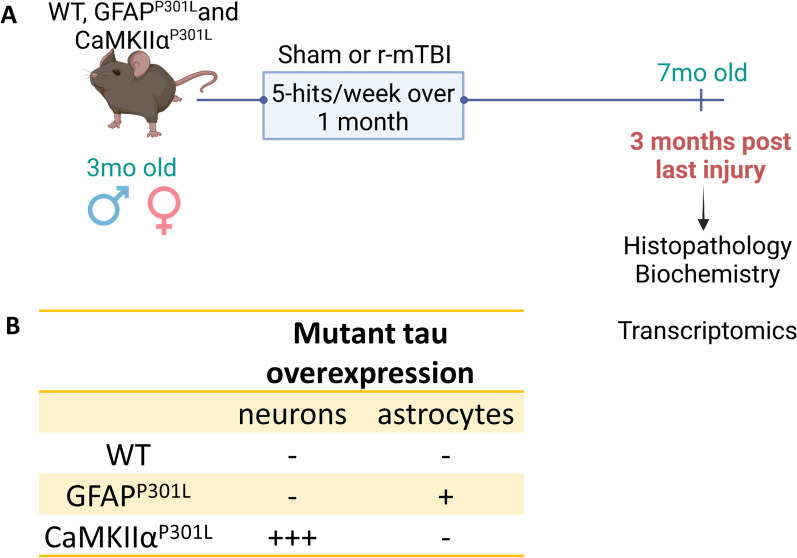
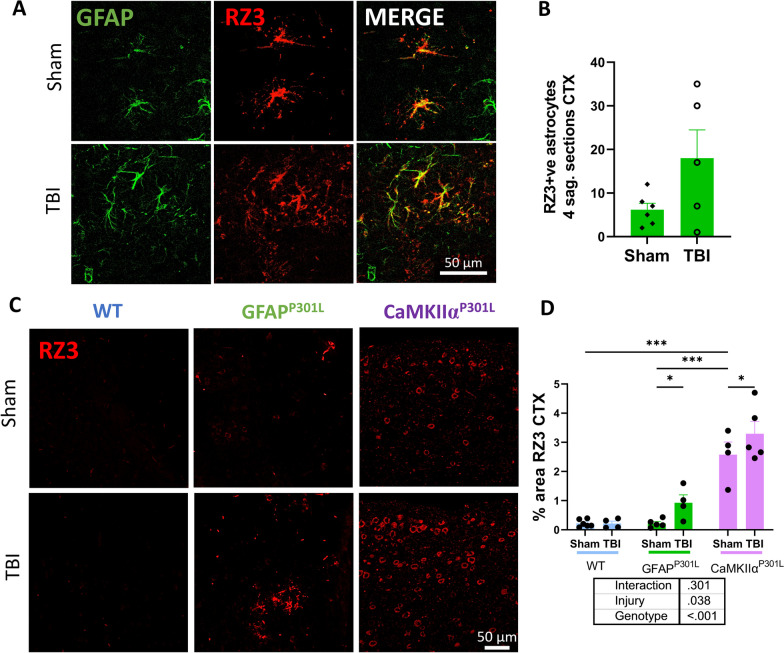
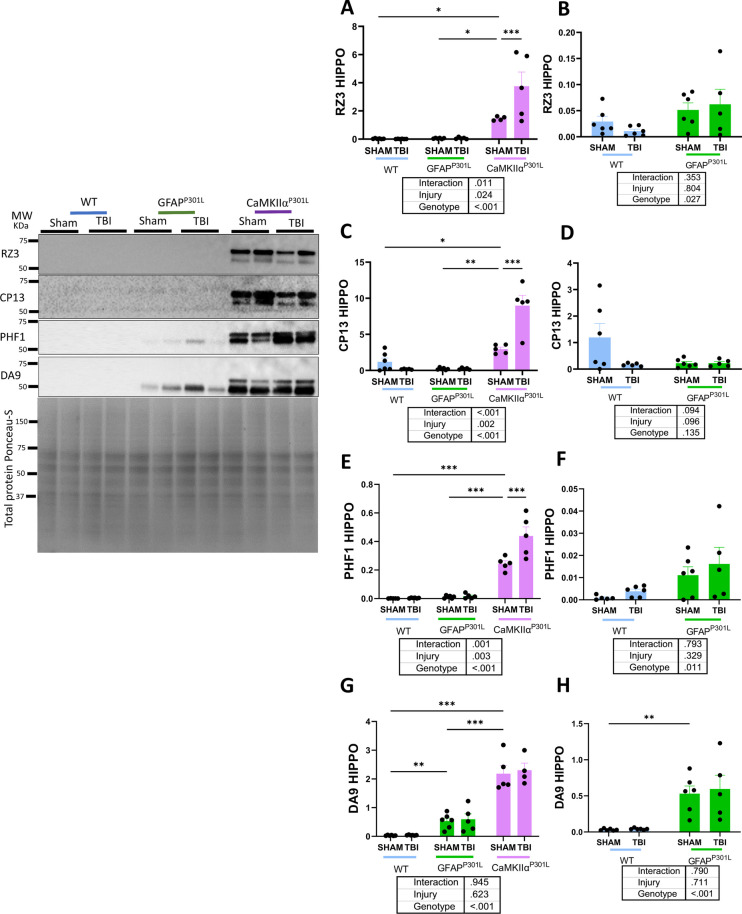
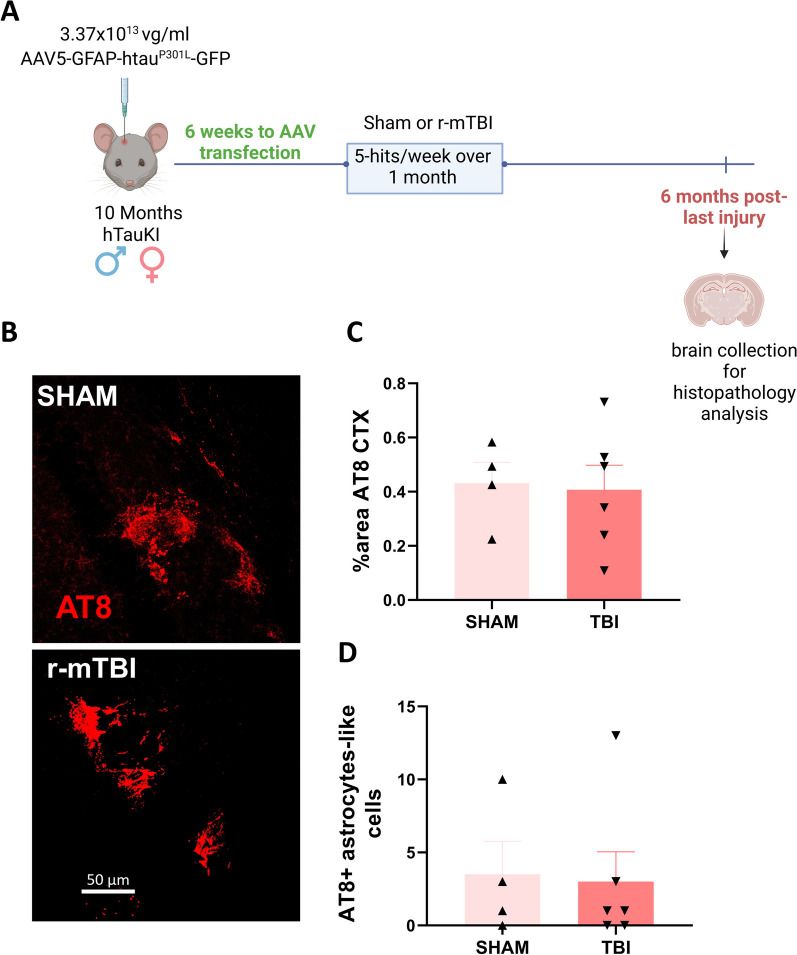
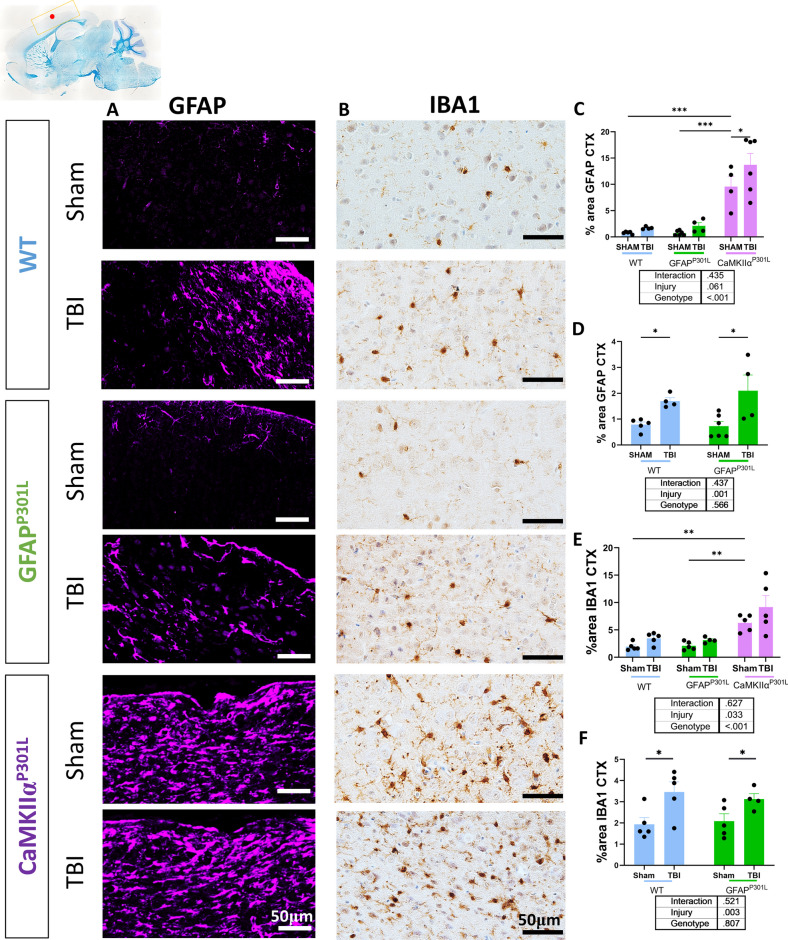
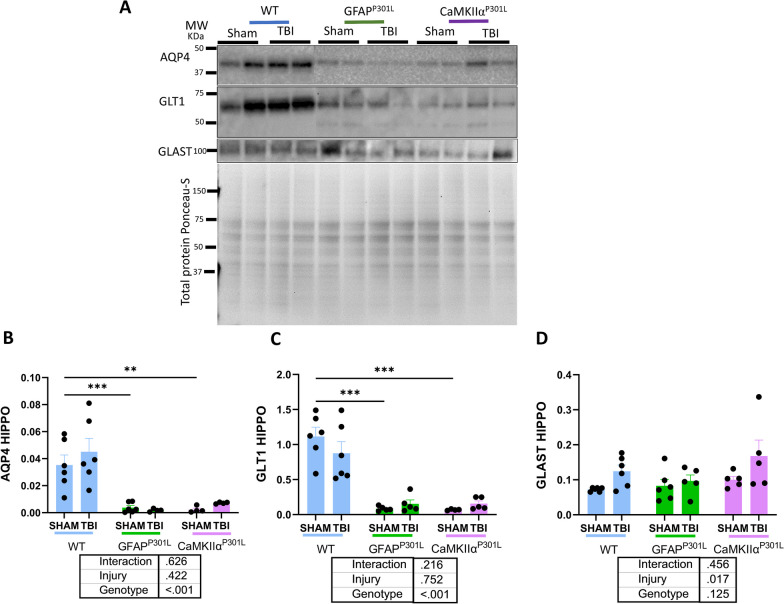
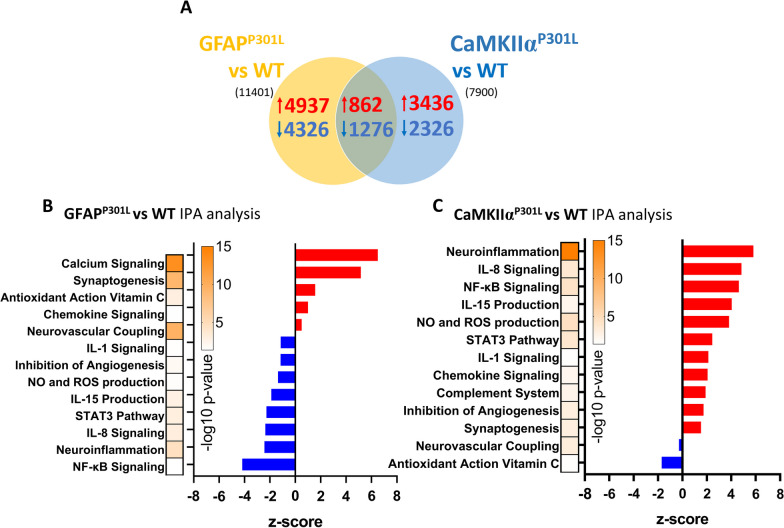
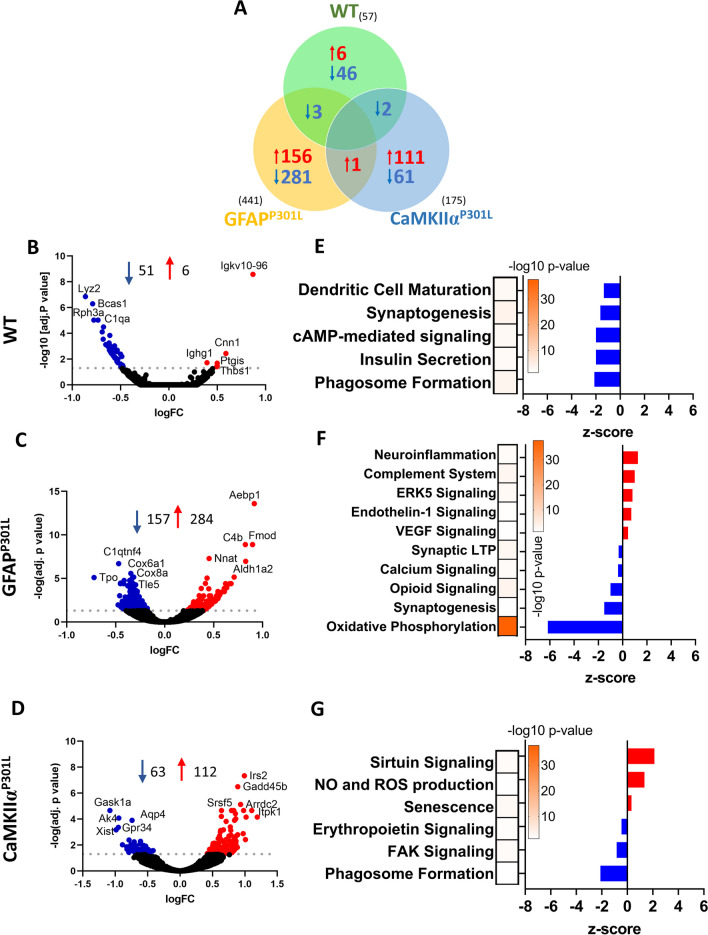
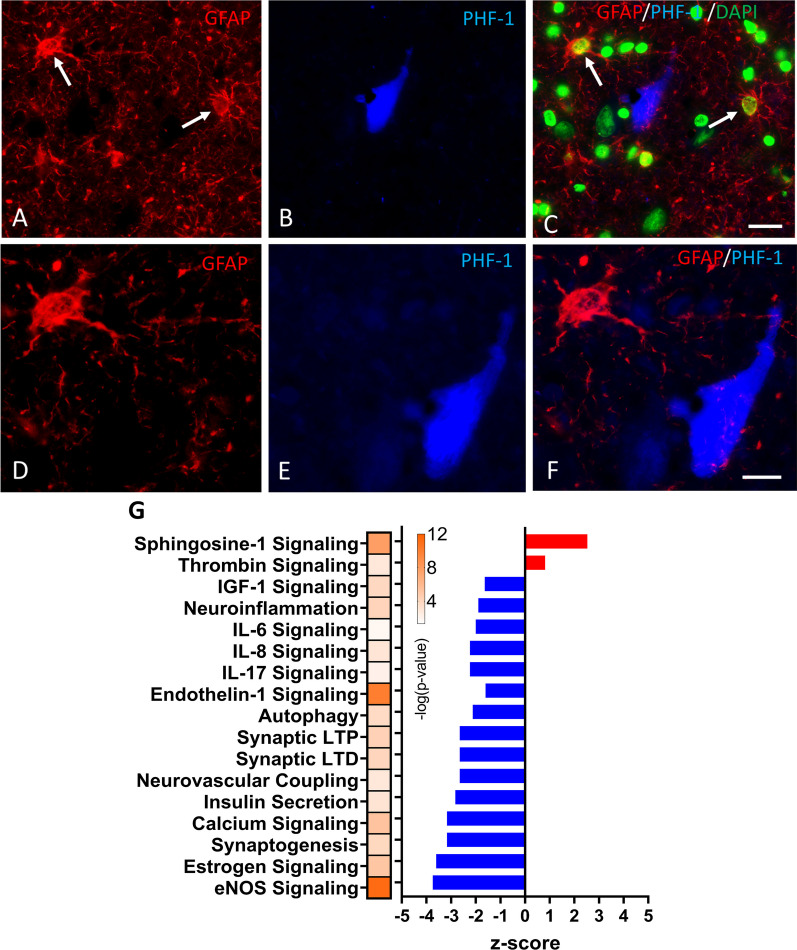
Epidemiological studies have unveiled a robust link between exposure to repetitive mild traumatic brain injury (r-mTBI) and elevated susceptibility to develop neurodegenerative disorders, notably chronic traumatic encephalopathy (CTE). The pathogenic lesion in CTE cases is characterized by the accumulation of hyperphosphorylated tau in neurons around small cerebral blood vessels which can be accompanied by astrocytes that contain phosphorylated tau, the latter termed tau astrogliopathy. However, the contribution of tau astrogliopathy to the pathobiology and functional consequences of r-mTBI/CTE or whether it is merely a consequence of aging remains unclear. We addressed these pivotal questions by utilizing a mouse model harboring tau-bearing astrocytes, GFAPP301L mice, subjected to our r-mTBI paradigm. Despite the fact that r-mTBI did not exacerbate tau astrogliopathy or general tauopathy, it increased phosphorylated tau in the area underneath the impact site. Additionally, gene ontology analysis of tau-bearing astrocytes following r-mTBI revealed profound alterations in key biological processes including immunological and mitochondrial bioenergetics. Moreover, gene array analysis of microdissected astrocytes accrued from stage IV CTE human brains revealed an immunosuppressed astroglial phenotype similar to tau-bearing astrocytes in the GFAPP301L model. Additionally, hippocampal reduction of proteins involved in water transport (AQP4) and glutamate homeostasis (GLT1) was found in the mouse model of tau astrogliopathy. Collectively, these findings reveal the importance of understanding tau astrogliopathy and its role in astroglial pathobiology under normal circumstances and following r-mTBI. The identified mechanisms using this GFAPP301L model may suggest targets for therapeutic interventions in r-mTBI pathogenesis in the context of CTE.

Keywords: Astrocytes; Chronic traumatic encephalopathy; Neuroinflammation; Tau astrogliopathy; Traumatic brain injury.


Conflict of interest statement

The authors declare they have no competing interests.

Figures

Fig. 1
Fig. 1
Development of an inducible/reversible conditional mouse model of tau astrogliopathy. A Schematic drawing depicting the generation of GFAP-tTA(±)/tet0-MAPT*P301L(±) mice (referred to as GFAPP301L mice) by crossing tetO-MAPT*P301L transgenic mice (i.e., FVB-Fgf14Tg(tet0-MAPT*P301L)4510kha/JlwsJ) with B6.Cg-Tg(GFAP-tTA)/110Pop/J mice that express a tetracycline-controlled transactivator protein (tTA) driven by the human glial fibrillary acidic protein (GFAP) promoter. This bitransgenic mouse allows Tet-Off/Tet-On expression of a P301L mutant variant of human four-repeat microtubule-associated protein tau (4R0N tauP301L) under control of GFAP promoter, specifically in astrocytes. B Qualitative micrographs of astrocyte colocalization with phosphorylated tau using S100 β/pTau T231 immunofluorescence (upper panel) and GFAP/pTau T231 (lower panel). C Quantitative immunoblot of total tau protein (DA9) levels in astrocytes of GFAP-P301L vs non-carrier (control) mice. DA9 was normalized to house-keeper—β actin
Fig. 2
Fig. 2
Timeline of experiments and features of mouse models. A Three-month-old wild-type (WT), GFAPP301L, and CamkIIαP301L were subjected to mild TBI every weekday for 5 days a week for four weeks resulting in 20 hits in a month. Three months post-last injury brain mouse tissue was collected for histopathological, biochemical and transcriptional analyses. B mutant tau expression in the three mouse models utilized for this study. − none; + some; +  +  + abundant
Fig. 3
Fig. 3
RZ3 immunoreactivity in the cortex of WT, GFAPP301L and CaMKIIαP301L mice at 3 months post-last injury. Qualitative images (A) and quantification of RZ3/GFAP + cells in the cortex of GFAPP301L mice from 4 serial sagittal sections per mouse (n = 5–6 per group) 3 months post-last injury (B). Qualitative images of phosphorylated tau (RZ3, red) in the cortex underneath the impact site of WT, GFAPP301L, and CaMKIIαP301L (C). RZ3 immunoreactive percent area in the cortex underneath the impact site 3 months post-last injury (n = 4–6 per group per genotype) (D). Data were analyzed by Two-Way ANOVA followed by the Benjamini, Krieger, and Yekuteli test. Table under the graph details injury and genotype effects and their interaction after Two-way ANOVA. Asterisks denote: *p < 0.05; **p < 0.01 and ***p < 0.001 for post-hoc analyses
Fig. 4
Fig. 4
Changes in Tau species (phosphorylated and total tau) in the hippocampus of WT, GFAPP301L and CaMKIIαP301L mice at 3 months post-last injury. Levels of RZ3 (A, B), CP13 (C, D), PHF1 (E, F) and DA9 (G, H) in the hippocampus (HIPPO) at 3 months post-last injury (n = 5–6 per group per genotype). Data were analyzed by Two-Way ANOVA followed by the Benjamini, Krieger, and Yekuteli test. Table under the graph details injury and genotype effects and their interaction after Two-way ANOVA. Asterisks denote: *p < 0.05; **p < 0.01 and ***p < 0.001 for post-hoc analyses. Graphs from B, D, F and H are from WT and GFAP-P301L cohorts alone. Representative immunoblots from the hippocampus are depicted on the left of the graphs
Fig. 5
Fig. 5
Adeno-associated viral (AAV) mediated transfection of astrocytes with mutant P301L tau prior to r-mTBI/sham injuries in human Tau Knock In (TauKI) mice. Schematic representation of AAV study design involving transfection of astrocytes under GFAP promoter with an intracerebral injection of AAV-GFAP-eGFP-P301L-Tau-FlagTau vector, six weeks prior to exposure to r-mTBI/sham injuries in 10-month-old TauKI mice (A). Qualitative micrographs of phosphorylated tau (AT8) marker by immunofluorescence 6 months post-last injury (B). AT8 immunoreactivity in the cortex of injected naïve mice (n = 4–6 per group) (C). AT8 + astrocyte-like cells in the cortex of injected mice (n = 4–6 per group) (D). t-test analysis yielded no significant changes
Fig. 6
Fig. 6
Astrocyte reactivity (GFAP) and microglial reactivity (Iba1) in the cortex (CTX) of WT, GFAPP301L and CaMKIIαP301L mice 3-months after r-mTBI/sham injury. Top right image is the overview of the region of interest (yellow box) where the images were collected from (red dot indicates the impact site). Qualitative images of GFAP and Iba1 in the cortex (A and B, respectively) of WT mice (top-two panels), GFAPP301L mice (middle-two panels) and CaMKIIαP301L mice (bottom-two panels) 3-months after r-mTBI/sham injury. GFAP images were captured at × 20 magnification and IBA1 images at x40 magnification. Percentage area of GFAP (C, D) and Iba1 (E, F) in the cortex tissue (n = 4–6 per group per genotype). Data were analyzed by Two-Way ANOVA followed by the Benjamini, Krieger, and Yekuteli test. Table under the graph details injury and genotype effects and their interaction after Two-way ANOVA. Asterisks denote: *p < 0.05; **p < 0.01 and ***p < 0.001 for post-hoc analyses. Graphs from D and F are from WT and GFAP-P301L cohorts alone
Fig. 7
Fig. 7
Changes in astrocyte homeostatic protein markers in WT, GFAPP301L and CaMKIIαP301L mice at 3 months post-last injury. Qualitative (A) and quantitative immunoblotting levels of aquaporin 4 (AQP4) (B) and glutamate transporters GLT1 and GLAST (C, D) in the hippocampus (HIPPO) (n = 4–6 per group per genotype). Data were analyzed by Two-Way ANOVA followed by the Benjamini, Krieger, and Yekuteli test. Table under the graph details injury and genotype effects and their interaction after Two-way ANOVA. Asterisks denote: *p < 0.05; **p < 0.01 and ***p < 0.001 for post-hoc analyses
Fig. 8
Fig. 8
Astrocyte specific pathways that are dysregulated in GFAPP301L and CaMKIIαP301L mice compared to Wild-type mice at 7-month-old. Venn diagram of differentially expressed genes (DEGs) of primary astrocytes isolated using MACS ACSA2 + beads from our mouse models are shown in A. Histogram in B and C depicts results of IPA pathway analyses after analyzing DEGs between GFAPP301L vs WT and CaMKIIαP301L vs WT, respectively. Upregulated and downregulated pathways in B–C are depicted in red and blue, respectively. Heat-bar in B–C represents –log 10 of the p value (yellow—Topmost significant; purple—least significant). Threshold for obtaining the DEGs: adj. p-value ≥ 0.05 with its respective –log value ≥ 1.3. N = 3 per group per genotype
Fig. 9
Fig. 9
Astrocyte specific pathways that are dysregulated in WT, GFAPP301L and CaMKIIαP301L mice at 3-month post-last injury. Venn diagram of injury dependent differentially expressed genes (DEGs) primary astrocytes isolated using MACS ACSA2 + beads from our mouse models are shown in A (i.e., entire DEGs, overlapping DEGs and unique DEGs). Volcano plot of injury dependent DEGs are shown in B (WT), C (GFAPP301L) and D (CaMKIIαP301L). Top 10 DEGs are highlighted on the volcano plots. Upregulated DEGs are in red, Downregulated DEGs are in blue. Histogram in E (WT), F (GFAPP301L) and G (CaMKIIαP301L) depicts results of IPA pathway analyses after analyzing the entire DEG list between r-mTBI vs sham groups for each of the 3 different genotypes. Upregulated and downregulated pathways in E–G are depicted in red and blue, respectively. Heat-bar in E–G represents -log 10 of the p value (yellow—Topmost significant; purple—least significant). Threshold for obtaining the DEGs: adj. p-value ≥ 0.05 with its respective –log value ≥ 1.3. N = 3 per group per genotype
Fig. 10
Fig. 10
Absence of tau astrogliopathy in CTE-IV hippocampal astrocytes and astrocyte-specific pathways that are dysregulated in human CTE (stage IV) cases versus healthy controls after laser microdissection of GFAP + astrocytes and gene array analyses. Immunofluorescent label demonstrating a lack of colocalization between tau-bearing neurofibrillary tangles and GFAPve astrocytes in the CA1 region of the hippocampus of a male Caucasian American football player that played for 25 years had an age of onset of symptoms at 66 years and died in his 70s. Postmortem neuropathologic diagnosis revealed CTE stage IV. Low power Immunofluorescence images showing single labeled GFAP astrocytes (red) and PHF-1 (tau phosphorylated at S396/404) positive NFTs (blue) and a merged image combined with staining for cell nuclei (green) in the hippocampus of the CTE stage IV case (A, B). High-power images of the GFAP astrocyte (upper left panel A, white arrow) and the NFT (D–F). Scale bar = 25 μm in A-C; scale bar = 10 μm in DF. Histogram depicts the results of IPA pathway analyses after analyzing the entire DEG list between CTE stage IV (n = 11) vs HC (n = 9) (G). Upregulated and downregulated pathways are depicted in red and blue, respectively. Heat-bar represents -log 10 of the P value (yellow—Topmost significant; dark blue—least significant). The threshold for obtaining the DEGs: adj. p-value ≥ 0.05 with its respective –log value ≥ 1.3. Approximately 50–100 astrocytes were micro-dissected and subjected to customized gene array analyses to interrogate > 850 genes with > 20 gene ontology groups

Similar articles

Cited by

References

    1. Bieniek K, Cairns N, Crary J, Dickson D, Folkerth R, Keene C, et al. The second NINDS/NIBIB consensus meeting to define neuropathological criteria for the diagnosis of chronic traumatic encephalopathy. J Neuropathol Exp Neurol. 2021;80:210. doi: 10.1093/jnen/nlab001. - DOI - PMC - PubMed
    1. Ezerskiy L, Schoch K, Sato C, Beltcheva M, Horie K, Rigo F, et al. Astrocytic 4R tau expression drives astrocyte reactivity and dysfunction. JCI Insight. 2022;7(1). - PMC - PubMed
    1. Hallmann AL, Araúzo-Bravo MJ, Mavrommatis L, Ehrlich M, Röpke A, Brockhaus J, et al. Astrocyte pathology in a human neural stem cell model of frontotemporal dementia caused by mutant TAU protein. Sci Rep. 2017;7(1):42991. doi: 10.1038/srep42991. - DOI - PMC - PubMed
    1. Dabir D, Robinson M, Swanson E, Zhang B, Trojanowski J, Lee V, et al. Impaired glutamate transport in a mouse model of tau pathology in astrocytes. J Neurosci. 2006;26(2):644–654. doi: 10.1523/JNEUROSCI.3861-05.2006. - DOI - PMC - PubMed
    1. Forman M, Lal D, Zhang B, Dabir DV, Swanson E, Lee VMY, et al. Transgenic mouse model of tau pathology in astrocytes leading to nervous system degeneration. J Neurosci. 2005;25(14):3539–3550. doi: 10.1523/JNEUROSCI.0081-05.2005. - DOI - PMC - PubMed

MeSH terms

LinkOut - more resources