. 2024 May 15;16(1):109.
doi: 10.1186/s13195-024-01472-1.

Cholecystokinin B receptor agonists alleviates anterograde amnesia in cholecystokinin-deficient and aged Alzheimer's disease mice

Affiliations

Cholecystokinin B receptor agonists alleviates anterograde amnesia in cholecystokinin-deficient and aged Alzheimer's disease mice

Nan Zhang et al. Alzheimers Res Ther. .

Abstract

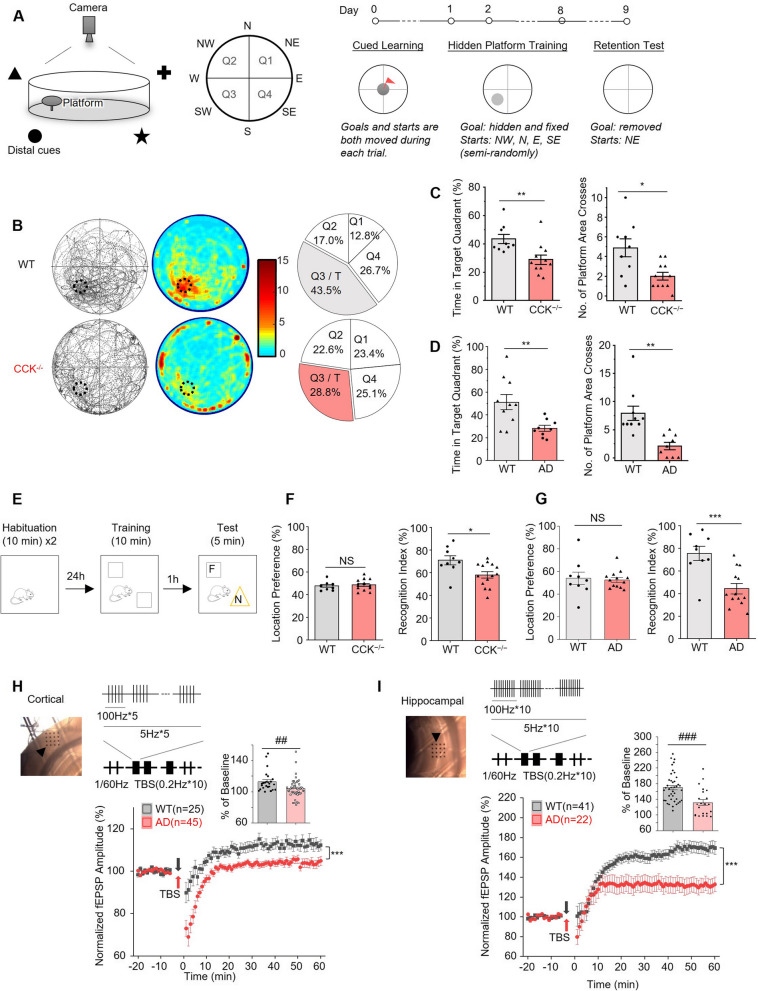
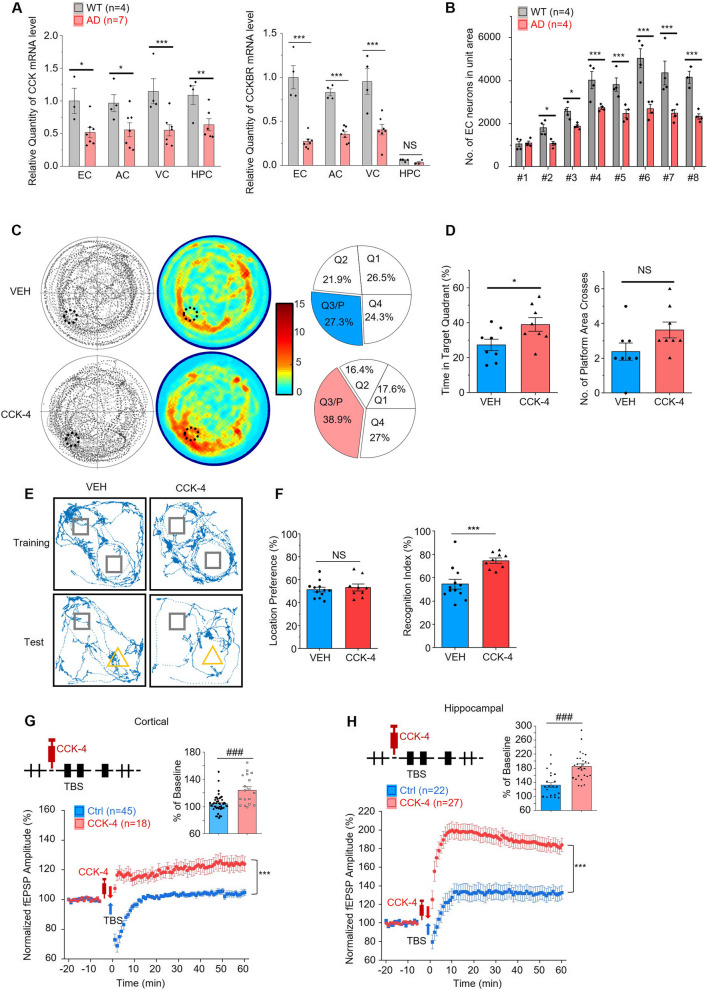
Background: As one major symptom of Alzheimer's disease (AD), anterograde amnesia describes patients with an inability in new memory formation. The crucial role of the entorhinal cortex in forming new memories has been well established, and the neuropeptide cholecystokinin (CCK) is reported to be released from the entorhinal cortex to enable neocortical associated memory and long-term potentiation. Though several studies reveal that the entorhinal cortex and CCK are related to AD, it is less well studied. It is unclear whether CCK is a good biomarker or further a great drug candidate for AD.

Methods: mRNA expressions of CCK and CCK-B receptor (CCKBR) were examined in two mouse models, 3xTg AD and CCK knock-out (CCK-/-) mice. Animals' cognition was investigated with Morris water maze, novel object recognition test and neuroplasticity with in-vitro electrophysiological recording. Drugs were given intraperitoneally to animals to investigate the rescue effects on cognitive deficits, or applied to brain slices directly to explore the influence in inducement of long-term potentiation.

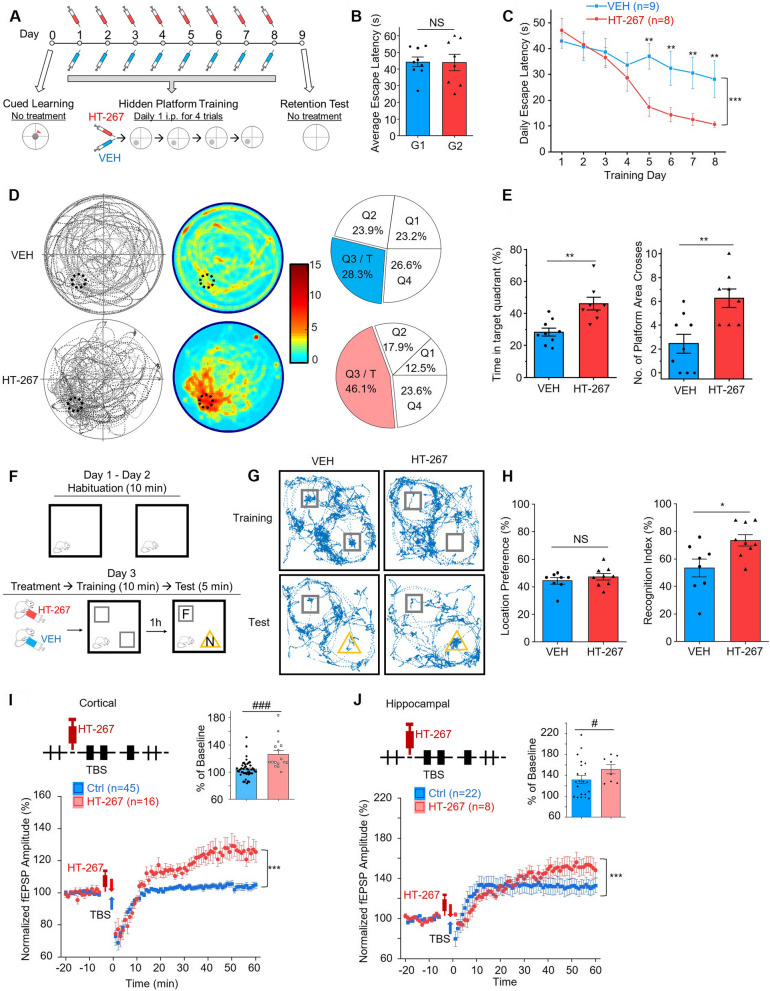
Results: Aged 3xTg AD mice exhibited reduced CCK mRNA expression in the entorhinal cortex but reduced CCKBR expression in the neocortex and hippocampus, and impaired cognition and neuroplasticity comparable with CCK-/- mice. Importantly, the animals displayed improved performance and enhanced long-term potentiation after the treatment of CCKBR agonists.

Conclusions: Here we provide more evidence to support the role of CCK in learning and memory and its potential to treat AD. We elaborated on the rescue effect of a promising novel drug, HT-267, on aged 3xTg AD mice. Although the physiological etiology of CCK in AD still needs to be further investigated, this study sheds light on a potential pharmaceutical candidate for AD and dementia.

Keywords: Alzheimer’s disease; Anterograde amnesia; Cholecystokinin; Cholecystokinin B receptor agonist; HT-267.


Conflict of interest statement

The authors declare no competing interests.

Figures

Fig. 1
Fig. 1
CCK−/− and aged 3xTg AD mice exhibit comparable impaired cognition and neuroplasticity. A Schematic diagram of Morris Water Maze (MWM) and the experiment protocol. B Performance of WT (upper) and CCK−/− mice (lower) in the MWM retention test. Left: Trajectory maps of mice's retrieval performance. The target platform area is indicated by the dotted circle. Middle: Heatmap visualization of spatial occupancy. Heatmaps were set to the same scale to facilitate comparison across groups. The redder colour represents increasing time spent. Right: Pie charts show the percentage of exploring time mice spent in each quadrant. Quadrant 3 (Q3) is the target quadrant (T), where the hidden platform was positioned during the training session. C CCK−/− mice display a decreased percentage of time that mice spent in the target quadrant (left) and less times to cross the platform area (right) in the MWM retention test compared with WT mice. D Aged 3xTg AD mice developed impaired memory retrieval in the MWM retention test compared with aged WT mice. E Diagrammatic drawing and experimental protocol of the novel object recognition (NOR) test. F, familiar object; N, novel object. F CCK−/− mice show no location preference in the NOR training (left) and a smaller recognition index in the NOR test (right) compared with WT mice. Location preference represents the percentage of time mice explored the left object in the training session. Recognition index represents the percentage of time mice explored the novel object in the test session. G Aged 3xTg AD mice show no location preference in the NOR training (left) and a smaller recognition index in the NOR test (right) compared with aged WT mice. H and (I) Scatter plots show the normalized amplitudes of fEPSP before and after TBS (indicated by arrows) on cortical (H) and hippocampal (I) slices of aged WT and aged 3xTg AD mice. A representative cortical slice showing the recording sites (black dots) and the stimulating site (indicate by arrow), and the TBS stimulation paradigm are shown above. The bar charts show the normalized amplitudes of fEPSPs for the last fifteen minutes of recordings. p value, NS > 0.05, * < 0.05, **, ## < 0.01, ***, ### < 0.001 by two-tailed two-sample t-test (C, D, F, G, and bar charts in H and I), or two-way repeated measures ANOVA with post-hoc Fisher test (scatter plots in H and I). Data are presented as the mean ± SEM. See also Figure S1 and S2
Fig. 2
Fig. 2
Administration of CCK-4 alleviated the deficits of CCK−/− mice. A and B The relative quantity of CCK (A) and CCKBR (B) mRNA levels in different brain regions of CCK−/− and WT control mice. Expressions of the mRNA levels was normalized to the average value of samples from the corresponding WT group of each brain region. EC, entorhinal cortex, AC, auditory cortex, VC, visual cortex, HPC, hippocampus. Box charts show 25 and 75 percentiles with boxes, 10 and 90 percentiles with whiskers, and means with dots. C Schematic diagram of Morris Water Maze (MWM) test. In the hidden platform training, CCK-4 or vehicle (VEH) was given intraperitoneally (i.p.) every time before each trial, and four doses were given to each mouse on each training day. D Average escape latency in MWM cued learning of two randomly divided groups (G1 and G2) of CCK−/− mice. G1 and G2 were assigned to receive VEH or HT-267 treatments, respectively, in the following training session. The results were averaged across the five trials for each mouse. E Acquisition performance of CCK-4 or VEH treated CCK−/− mice in the MWM hidden platform training process. The results were averaged across four trials for each mouse and averaged across mice per day. F Trajectory maps (left), heatmaps (middle) and pie charts (right) show mice’s performance in the MWM retention test of CCK-4 (lower) or VEH (upper) treated CCK−/− mice. G The percentage of time mice spent in the target quadrant (left) and the number of platform area crosses (right) of CCK-4 or VEH treated CCK−/− mice in the MWM retention test. H Diagrammatic drawing and experimental protocol of the novel object recognition (NOR) test. F, familiar object; N, novel object. One dose of CCK-4 or VEH was given by i.p. injection to each mouse before training. I Examples of trajectories of the VEH or CCK-4 treated CCK−/− mice in the NOR training and test sessions. Squares indicate the positions of two identical objects in the training and the familiar object in the test. Triangles indicate the positions of the novel object in the test. J Location preference (left) in the NOR training session and recognition index (right) in the test session of the VEH or CCK-4 treated CCK.−/− mice. p value, NS > 0.05, * < 0.05, ** < 0.01, *** < 0.001 by two-tailed two-sample t-test (A, B, D, G and J), or two-way repeated measures ANOVA with post-hoc Fisher test (E). Data are presented as the mean ± SEM. See also Figure S3
Fig. 3
Fig. 3
Application of CCK-4 rescued impaired cognition and neuroplasticity of aged 3xTg AD mice. A The relative quantity of CCK (left) and CCKBR (right) mRNA levels in different brain regions of aged 3xTg AD (AD) and control wildtype (WT) mice. Data were normalized to the average of EC samples of WT mice. EC, entorhinal cortex, AC, auditory cortex, VC, visual cortex, HPC, hippocampus. B The number of EC neurons in the unit area of the eight positions of the brain slices. The eight positions are: #1 -2.18 mm posterior to bregma (Bre -2.18), #2 Bre -2.46, #3 Bre -2.80, #4 Bre -3.08, #5 Bre -3.40, #6 Bre -3.80, #7 Bre -4.16, and #8 Bre -4.48. C Trajectory maps (left), heatmaps (middle) and pie charts (right) show mice’s performance in the MWM retention test of CCK-4 (lower) or VEH (upper) treated 3xTg mice. D The percentage of time mice spent in the target quadrant (left) and the number of platform area crosses (right) of CCK-4 or VEH treated 3xTg mice in the MWM retention test. E Examples of trajectories of the VEH or CCK-4 treated 3xTg mice in the NOR training and test sessions. Squares indicate the positions of two identical objects in the training and the familiar object in the test. Triangles indicate the positions of the novel object in the test. F Location preference (left) in the NOR training session and recognition index (right) in the test session of the VEH or CCK-4 treated 3xTg mice. G and H Scatter plots show the normalized amplitudes of fEPSP before and after TBS on cortical (G) and hippocampal (H) slices with or without CCK-4 application of aged 3xTg mice. The bar charts show the normalized amplitudes of fEPSPs for the last fifteen minutes of recordings. p value, NS > 0.05, * < 0.05, ** < 0.01, ***, ### < 0.001 by two-tailed two-sample t-test (D, and bar charts in G and H), or two-way repeated measures ANOVA with post-hoc Fisher test (A, B, and scatter plots in G and H). Data are presented as the mean ± SEM. See also Figure S4 and S5
Fig. 4
Fig. 4
HT-267, an analogue of CCK-4 with a longer half-life, showed great potency to CCK BR. A EC50 curve of CCK4, CCK8s and HT-267 for the CHO-CCKAR cells. EC50 (CCK4) = 2267.5 ± 492.694 nM, EC50 (CCK8s) = 1.741 ± 1.115 nM, EC50 (HT-267) = 8171.25 ± 2319.157 nM. 100% CCK8s maximal response of CCK4 = 48.058 ± 3.417%, 100% CCK8s maximal response of HT-267 = 27.518 ± 4.176%. B EC50 curve of CCK4, CCK8s and HT-267 for the CHO-CCKBR cells. EC50 (CCK4) = 2.182 ± 0.623 nM, EC50 (CCK8s) = 5.079 ± 2.423 nM, EC50 (HT-267) = 11.552 ± 4.534 nM. 100% CCK8s maximal response of CCK4 = 91.302 ± 6.370%, 100% CCK8s maximal response of HT-267 = 96.750 ± 6.282%. C The response of different concentrations of HT-267 was measured by calcium imaging assay in CHO cells. Relative RFU (Relative RFU = RFUt = 30 s / RFUt = 0: the RFU ratio of the 30 s after (RFUt = 30 s) and before (RFUt = 0) adding HT-267/HHBS). ∆F/F0 ((RFUt = 30 s-RFUt = 0)/RFUt = 0). D Pharmacokinetics (PK) results of the concentration–time curve of HT-267 in plasma and brain of male KM mice following intravenous (i.v.) administration. E The parameters of HT-267 in the PK study. p value, NS > 0.05 by one-way ANOVA with post-hoc Fisher test (C). Data are presented as the mean ± SEM
Fig. 5
Fig. 5
HT-267 rescued the deficiencies of learning, memory, and neuroplasticity of aged AD mice. A Schematic diagram of Morris Water Maze (MWM). One dose of HT-267 or VEH (VEH) was given intraperitoneally (i.p.) to each mouse before training on each training day. B Average escape latency in MWM cued learning of two randomly divided groups (G1 and G2) of 3xTg mice. G1 and G2 were assigned to receive VEH or HT-267 treatments, respectively, in the following training session. C Acquisition performance of HT-267 or VEH treated 3xTg mice in the MWM hidden platform training. D Trajectory maps (left), heatmaps (middle) and pie charts (right) show mice’s performance in the MWM retention test of HT-267 (lower) or VEH (upper) treated 3xTg mice. E The percentage of time mice spent in the target quadrant (left) and the number of platform area crosses (right) of HT-267 or VEH treated 3xTg mice in the MWM retention test. F Diagrammatic drawing and experimental protocol of the novel object recognition (NOR) test. F, familiar object; N, novel object. One dose of HT-267 or VEH was given by i.p. injection to each mouse before training. G Examples of trajectories of the VEH or HT-267 treated 3xTg mice in the NOR training and test sessions. Squares indicate the positions of two identical objects in the training and the familiar object in the test. Triangles indicate the positions of the novel object in the test. H Location preference (left) in the NOR training session and recognition index (right) in the test session of the VEH or HT-267 treated 3xTg mice. I and J Scatter plots show the normalized amplitudes of fEPSP before and after TBS on cortical (I) and hippocampal (J) slices with or without HT-267 application of aged 3xTg mice. The bar charts show the normalized amplitudes of fEPSP for the last fifteen minutes of recordings. p value, NS > 0.05, *, # < 0.05, ** < 0.01, ***, ### < 0.001 by two-tailed two-sample t-test (B, E, H, and bar charts in I and J), or two-way repeated measures ANOVA with post-hoc Fisher test (C, and scatter plots in I and J). Data are presented as the mean ± SEM. See also Figure S6

Similar articles

Cited by

References

    1. Braak H, Braak E. Neuropathological stageing of Alzheimer-related changes. Acta Neuropathol. 1991;82(4):239–259. doi: 10.1007/BF00308809. - DOI - PubMed
    1. Hardy J., Selkoe D. J. The amyloid hypothesis of Alzheimer's disease: progress and problems on the road to therapeutics. Science. 2002;297(5580):353–356. doi: 10.1126/science.1072994. - DOI - PubMed
    1. Mattson MP. Pathways towards and away from Alzheimer's disease. Nature. 2004;430(7000):631–639. doi: 10.1038/nature02621. - DOI - PMC - PubMed
    1. Arnold SE, Hyman BT, Flory J, Damasio AR, Van Hoesen GW. The topographical and neuroanatomical distribution of neurofibrillary tangles and neuritic plaques in the cerebral cortex of patients with Alzheimer's disease. Cereb Cortex. 1991;1(1):103–116. doi: 10.1093/cercor/1.1.103. - DOI - PubMed
    1. Braak H, Braak EVA. Staging of Alzheimer's disease-related neurofibrillary changes. Neurobiol Aging. 1995;16(3):271–278. doi: 10.1016/0197-4580(95)00021-6. - DOI - PubMed

Publication types

MeSH terms

Substances