. 2024 May 16;21(1):79.
doi: 10.1186/s12984-024-01371-4.

Enhancing touch sensibility with sensory electrical stimulation and sensory retraining

Affiliations

Enhancing touch sensibility with sensory electrical stimulation and sensory retraining

Eduardo Villar Ortega et al. J Neuroeng Rehabil. .

Abstract

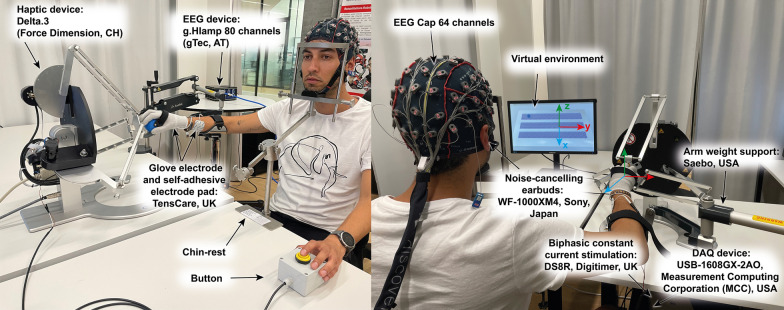
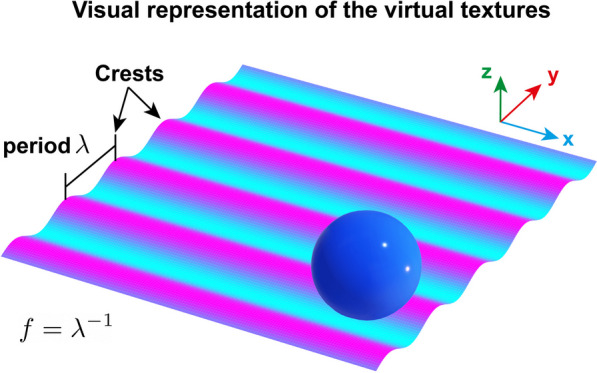
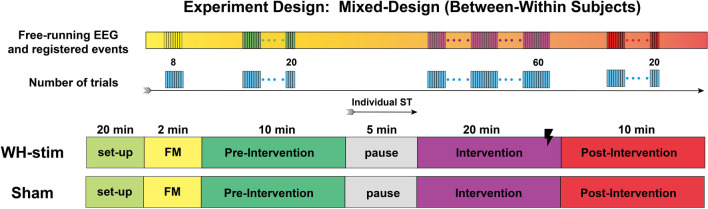
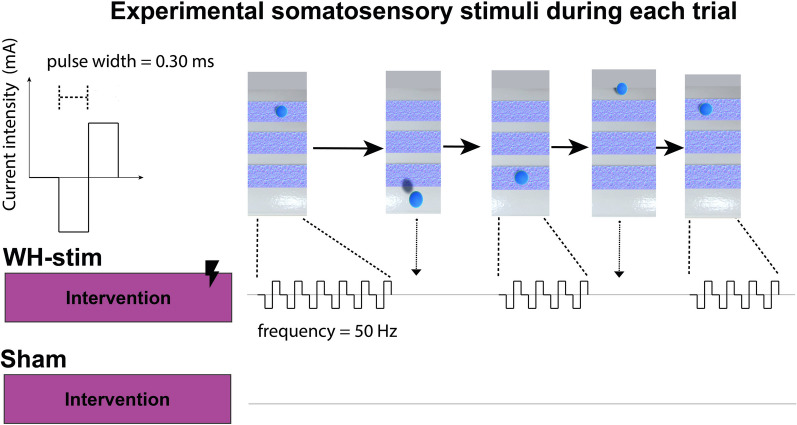
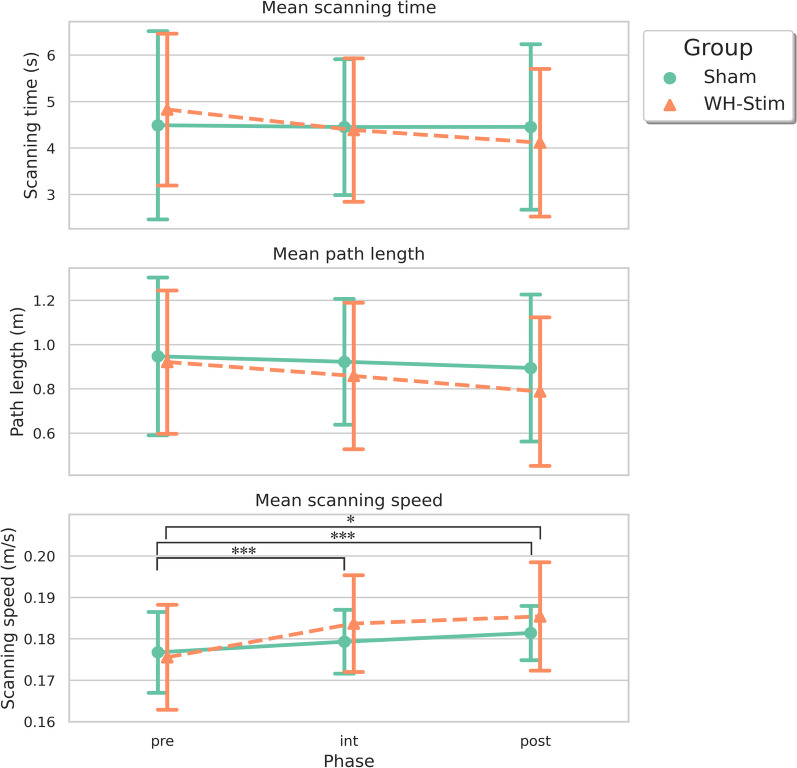
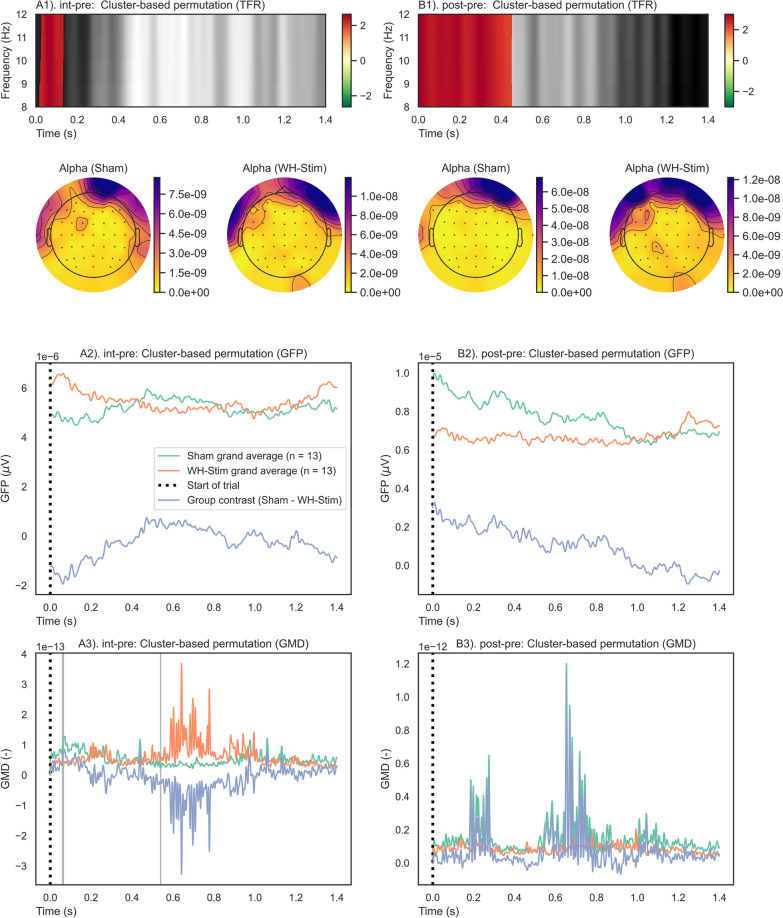
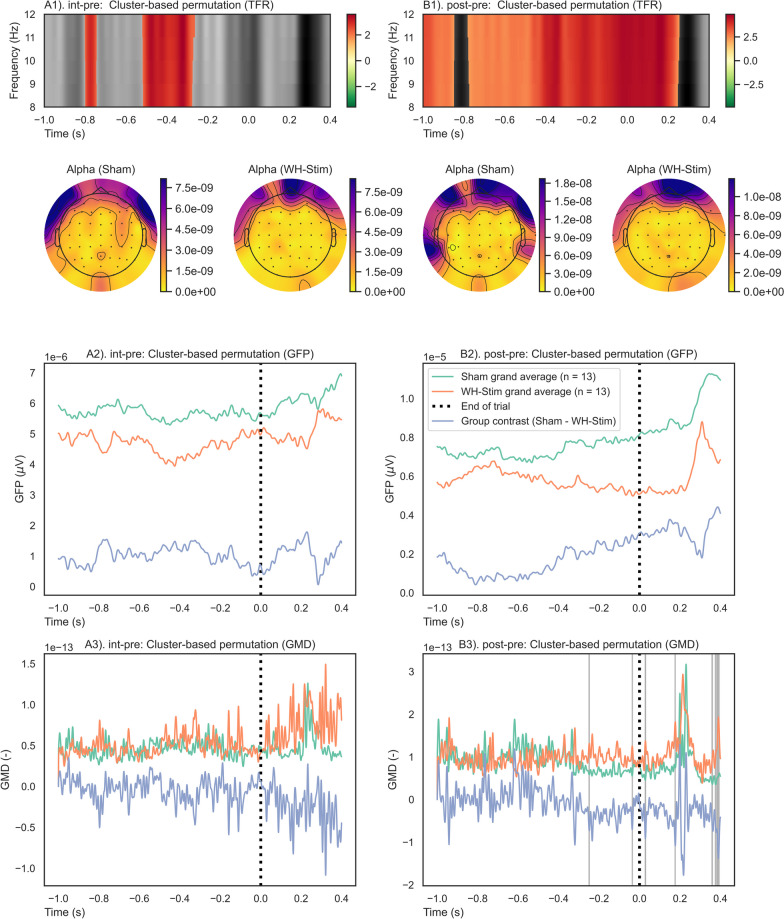
A large proportion of stroke survivors suffer from sensory loss, negatively impacting their independence, quality of life, and neurorehabilitation prognosis. Despite the high prevalence of somatosensory impairments, our understanding of somatosensory interventions such as sensory electrical stimulation (SES) in neurorehabilitation is limited. We aimed to study the effectiveness of SES combined with a sensory discrimination task in a well-controlled virtual environment in healthy participants, setting a foundation for its potential application in stroke rehabilitation. We employed electroencephalography (EEG) to gain a better understanding of the underlying neural mechanisms and dynamics associated with sensory training and SES. We conducted a single-session experiment with 26 healthy participants who explored a set of three visually identical virtual textures-haptically rendered by a robotic device and that differed in their spatial period-while physically guided by the robot to identify the odd texture. The experiment consisted of three phases: pre-intervention, intervention, and post-intervention. Half the participants received subthreshold whole-hand SES during the intervention, while the other half received sham stimulation. We evaluated changes in task performance-assessed by the probability of correct responses-before and after intervention and between groups. We also evaluated differences in the exploration behavior, e.g., scanning speed. EEG was employed to examine the effects of the intervention on brain activity, particularly in the alpha frequency band (8-13 Hz) associated with sensory processing. We found that participants in the SES group improved their task performance after intervention and their scanning speed during and after intervention, while the sham group did not improve their task performance. However, the differences in task performance improvements between groups only approached significance. Furthermore, we found that alpha power was sensitive to the effects of SES; participants in the stimulation group exhibited enhanced brain signals associated with improved touch sensitivity likely due to the effects of SES on the central nervous system, while the increase in alpha power for the sham group was less pronounced. Our findings suggest that SES enhances texture discrimination after training and has a positive effect on sensory-related brain areas. Further research involving brain-injured patients is needed to confirm the potential benefit of our solution in neurorehabilitation.

Keywords: Alpha Power; Electroencephalography; Electrostimulation; Robotic neurorehabilitation; Sensory training; Virtual reality.


Conflict of interest statement

The authors declare that they have no competing interests.

Figures

Fig. 1
Fig. 1
Experimental set-up. The Delta.3 robot was placed on a table to the right of the participant. An arm weight support mechanism was attached to the table and was employed to support the participant’s arm weight during the experiment to reduce fatigue. Participants placed their chin on a chin rest attached to the table in front of them. A LED monitor placed on the table in front of the participant showed the virtual environment. After the first familiarization phase, a curtain was attached from the chin rest to the monitor (not shown here) to hide the robot and the participant’s hand from the participant’s sight. Participants wore noise-canceling headphones to mask potential noises from the robot actuators
Fig. 2
Fig. 2
Tactile stimuli: the haptically rendered textures. The virtual textures were generated following sinusoidal gratings of spatial frequency f. The spatial frequency is defined as the inverse of the distance of two adjacent crests λ. Please note that the size and proportions of the ball (representing the end-effector position of the robot) and texture are for illustration purposes, and they do not match the sizes used in the experiment. For more information, please refer to [51]
Fig. 3
Fig. 3
Experimental design. Participants completed a single-session experiment. The session included familiarization (FM), pre-intervention, intervention, and post-intervention. We used the pause before the intervention to identify the participant’s individual sensory threshold (ST). Half of the participants were randomly allocated to the WH-stim group, receiving somatosensory stimulation during the intervention, whereas the second half received sham stimulation (stimulation with 0 mA)
Fig. 4
Fig. 4
Somatosensory electrical stimulation. Participants from the whole-hand stimulation group (WH-Stim) received somatosensory electrical stimulation during the intervention, whereas the Sham group received 0 mA stimulation. The stimulation was provided only when participants were within any of the textures. The stimulation train frequency was set to 50 Hz. Please note that the 10 μs interphase delays are not visually represented in this figure
Fig. 5
Fig. 5
Task performance (i.e., probability of correct responses) at pre- and post-intervention for individual participants in the whole-hand stimulation (left) and sham group (right)
Fig. 6
Fig. 6
Mean kinematic outcomes—scanning time, path length, and scanning speed—during the different experimental phases for the two experimental groups. The error bars correspond to the standard deviation. ‘p <  0.05, ‘p < 0.001
Fig. 7
Fig. 7
Start-of-trial analysis results of one-sample cluster permutation tests for time–frequency representation (TFR), global field power (GFP), and global map dissimilarity (GMD). Each group and paired contrast was performed separately: A1–3) Sham group paired contrast intervention–pre-intervention; B1–3) Sham group paired contrast post–pre-intervention; C1–3) WH-Stim group paired contrast intervention–pre-intervention; and D1–3) WH-Stim group paired contrast post–pre-intervention. TFR: Positive (red) and negative (green) clusters, p<  0.05. GFP and GMD: Significant clusters (red) p< 0.05, non-significant clusters (grey) p> 0.05
Fig. 8
Fig. 8
End-of-trial analysis results of one-sample cluster permutation tests for time–frequency representation (TFR), global field power (GFP), and global map dissimilarity (GMD). Each group and paired contrast was performed separately: A1–3) Sham group paired contrast intervention–pre-intervention; B1–3) Sham group paired contrast post–pre-intervention; C1–3) WH-Stim group paired contrast intervention–pre-intervention; and D1–3) WH-Stim group paired contrast post–pre-intervention. TFR: Positive (red) and negative (green) clusters, p< 0.05. GFP and GMD: Significant clusters (red) p< 0.05, non-significant clusters (grey) p> 0.05
Fig. 9
Fig. 9
Between group comparisons of time–frequency representations (TFRs), global field powers (GFPs), and global map dissimilarities (GMDs) for the start trial. A permutation cluster test was performed between the groups’ TFRs, GFPs, and GMDs. The time window was from 0.0 s (i.e., the start of the trial) to 1.4 s after it. Each paired contrast was performed separately between the groups: A1–3) Paired contrasts intervention–pre-intervention between Sham vs. WH-Stim; B1–3) Paired contrasts post–pre-intervention between Sham vs. WH-Stim. TFR: Positive (red) and negative (green) clusters, p< 0.05. GFP and GMD: Significant clusters (red) p< 0.05, non-significant clusters (grey) p> 0.05
Fig. 10
Fig. 10
Between group comparisons of time–frequency representations (TFRs), global field powers (GFPs), and global map dissimilarities (GMDs) for the end trial. A permutation cluster test was performed between the groups’ TFRs, GFPs, and GMDs. The time window was from − 1.0 s (i.e., 1 s before the onset of the end trial) to 0.4 s after it. Each paired contrast was performed separately between the groups: A1–3) paired contrasts intervention–pre-intervention between Sham vs. WH-Stim; B1–3) paired contrasts post–pre-intervention between Sham vs. WH-Stim. TFR: Positive (red) and negative (green) clusters, p< 0.05. GFP and GMD: Significant clusters (red) p< 0.05, non-significant clusters (grey) p> 0.05

Similar articles

Cited by

References

    1. Adamson J, Beswick A, Ebrahim S. Is stroke the most common cause of disability? J Stroke Cerebrovasc Dis. 2004;13(4):171–177. doi: 10.1016/j.jstrokecerebrovasdis.2004.06.003. - DOI - PubMed
    1. Yilmazer C, Boccuni L, Thijs L, Verheyden G. Effectiveness of somatosensory interventions on somatosensory, motor and functional outcomes in the upper limb post-stroke: A systematic review and meta-analysis. NeuroRehabilitation. 2019;44(4):459–477. doi: 10.3233/NRE-192687. - DOI - PubMed
    1. Zandvliet SB, Kwakkel G, Nijland RHM, van Wegen EEH, Meskers CGM. Is recovery of somatosensory impairment conditional for upper-limb motor recovery early after stroke? Neurorehabil Neural Repair. 2020;34(5):403–416. doi: 10.1177/1545968320907075. - DOI - PMC - PubMed
    1. Schabrun SM, Hillier S. Evidence for the retraining of sensation after stroke: a systematic review. Clin Rehabil. 2009;23(1):27–39. doi: 10.1177/0269215508098897. - DOI - PubMed
    1. Doyle SD, Bennett S, Dudgeon B. Upper limb post-stroke sensory impairments: the survivor’s experience. Disabil Rehabil. 2014;36(12):993–1000. doi: 10.3109/09638288.2013.825649. - DOI - PubMed

Publication types