

TrG2P: A transfer-learning-based tool integrating multi-trait data for accurate prediction of crop yield
- PMID: 38751121
- PMCID: PMC11287160
- DOI: 10.1016/j.xplc.2024.100975
TrG2P: A transfer-learning-based tool integrating multi-trait data for accurate prediction of crop yield
Abstract
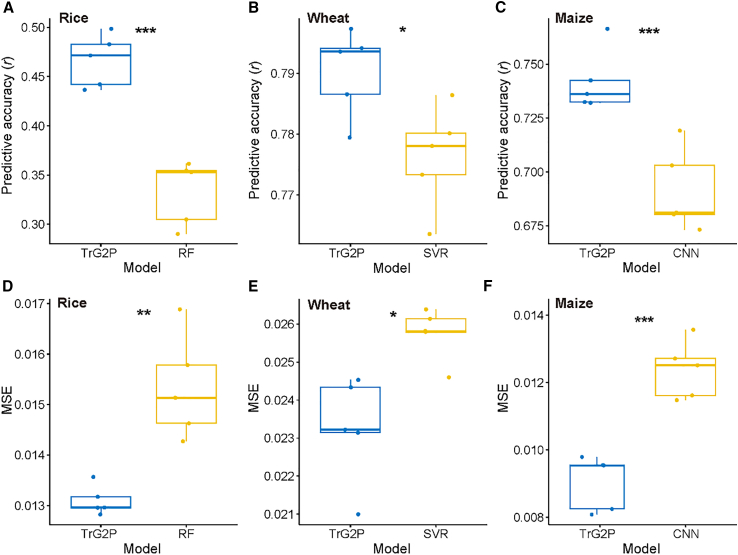
Yield prediction is the primary goal of genomic selection (GS)-assisted crop breeding. Because yield is a complex quantitative trait, making predictions from genotypic data is challenging. Transfer learning can produce an effective model for a target task by leveraging knowledge from a different, but related, source domain and is considered a great potential method for improving yield prediction by integrating multi-trait data. However, it has not previously been applied to genotype-to-phenotype prediction owing to the lack of an efficient implementation framework. We therefore developed TrG2P, a transfer-learning-based framework. TrG2P first employs convolutional neural networks (CNN) to train models using non-yield-trait phenotypic and genotypic data, thus obtaining pre-trained models. Subsequently, the convolutional layer parameters from these pre-trained models are transferred to the yield prediction task, and the fully connected layers are retrained, thus obtaining fine-tuned models. Finally, the convolutional layer and the first fully connected layer of the fine-tuned models are fused, and the last fully connected layer is trained to enhance prediction performance. We applied TrG2P to five sets of genotypic and phenotypic data from maize (Zea mays), rice (Oryza sativa), and wheat (Triticum aestivum) and compared its model precision to that of seven other popular GS tools: ridge regression best linear unbiased prediction (rrBLUP), random forest, support vector regression, light gradient boosting machine (LightGBM), CNN, DeepGS, and deep neural network for genomic prediction (DNNGP). TrG2P improved the accuracy of yield prediction by 39.9%, 6.8%, and 1.8% in rice, maize, and wheat, respectively, compared with predictions generated by the best-performing comparison model. Our work therefore demonstrates that transfer learning is an effective strategy for improving yield prediction by integrating information from non-yield-trait data. We attribute its enhanced prediction accuracy to the valuable information available from traits associated with yield and to training dataset augmentation. The Python implementation of TrG2P is available at https://github.com/lijinlong1991/TrG2P. The web-based tool is available at http://trg2p.ebreed.cn:81.
Keywords: crop; genotype to phenotype; multi-trait; transfer learning; yield prediction.
Copyright © 2024. Published by Elsevier Inc.
Figures


Similar articles
-
GPS: Harnessing data fusion strategies to improve the accuracy of machine learning-based genomic and phenotypic selection.Plant Commun. 2025 Aug 11;6(8):101416. doi: 10.1016/j.xplc.2025.101416. Epub 2025 Jun 11. Plant Commun. 2025. PMID: 40509592 Free PMC article.
-
DNNGP, a deep neural network-based method for genomic prediction using multi-omics data in plants.Mol Plant. 2023 Jan 2;16(1):279-293. doi: 10.1016/j.molp.2022.11.004. Epub 2022 Nov 10. Mol Plant. 2023. PMID: 36366781
-
Cropformer: An interpretable deep learning framework for crop genomic prediction.Plant Commun. 2025 Mar 10;6(3):101223. doi: 10.1016/j.xplc.2024.101223. Epub 2024 Dec 16. Plant Commun. 2025. PMID: 39690739 Free PMC article.
-
Root hairs: an underexplored target for sustainable cereal crop production.J Exp Bot. 2024 Sep 27;75(18):5484-5500. doi: 10.1093/jxb/erae275. J Exp Bot. 2024. PMID: 38894654 Free PMC article. Review.
-
Blurring the boundaries between cereal crops and model plants.New Phytol. 2020 Dec;228(6):1721-1727. doi: 10.1111/nph.16229. Epub 2019 Nov 14. New Phytol. 2020. PMID: 31571228 Review.
Cited by
-
Using the Pearson's correlation coefficient as the sole metric to measure the accuracy of quantitative trait prediction: is it sufficient?Front Plant Sci. 2024 Dec 10;15:1480463. doi: 10.3389/fpls.2024.1480463. eCollection 2024. Front Plant Sci. 2024. PMID: 39719937 Free PMC article.
-
Advances in multi-trait genomic prediction approaches: classification, comparative analysis, and perspectives.Brief Bioinform. 2025 May 1;26(3):bbaf211. doi: 10.1093/bib/bbaf211. Brief Bioinform. 2025. PMID: 40358423 Free PMC article. Review.
-
Fast-forwarding plant breeding with deep learning-based genomic prediction.J Integr Plant Biol. 2025 Jul;67(7):1700-1705. doi: 10.1111/jipb.13914. Epub 2025 Apr 14. J Integr Plant Biol. 2025. PMID: 40226955 Free PMC article. Review.
-
WheatGP, a genomic prediction method based on CNN and LSTM.Brief Bioinform. 2025 Mar 4;26(2):bbaf191. doi: 10.1093/bib/bbaf191. Brief Bioinform. 2025. PMID: 40275535 Free PMC article.
-
PSR-MAPMS: A new approach for the interpretable prediction of myelin autoantigenic peptides in multiple sclerosis using multi-source propensity scores.Protein Sci. 2025 Aug;34(8):e70010. doi: 10.1002/pro.70010. Protein Sci. 2025. PMID: 40673425 Free PMC article.
References
-
- Agrama H.J.P.b. Vol. 115. 1996. pp. 343–346. (Sequential Path Analysis of Grain Yield and its Components in Maize).
-
- Begum H., Spindel J.E., Lalusin A., Borromeo T., Gregorio G., Hernandez J., Virk P., Collard B., McCouch S.R. Genome-wide association mapping for yield and other agronomic traits in an elite breeding population of tropical rice (Oryza sativa) PLoS One. 2015;10 doi: 10.1371/journal.pone.0119873. - DOI - PMC - PubMed
MeSH terms
LinkOut - more resources
Full Text Sources
