. 2024 Jul;11(28):e2401009.
doi: 10.1002/advs.202401009. Epub 2024 May 15.

Gastrointestinal Incomplete Degradation Exacerbates Neurotoxic Effects of PLA Microplastics via Oligomer Nanoplastics Formation

Affiliations

Gastrointestinal Incomplete Degradation Exacerbates Neurotoxic Effects of PLA Microplastics via Oligomer Nanoplastics Formation

Boxuan Liang et al. Adv Sci (Weinh). 2024 Jul.

Abstract

Biodegradable plastics, hailed for their environmental friendliness, may pose unforeseen risks as they undergo gastrointestinal degradation, forming oligomer nanoplastics. Despite this, the influence of gastrointestinal degradation on the potential human toxicity of biodegradable plastics remains poorly understood. To this end, the impact of the murine in vivo digestive system is investigated on the biotransformation, biodistribution, and toxicity of PLA polymer and PLA oligomer MPs. Through a 28-day repeated oral gavage study in mice, it is revealed that PLA polymer and oligomer microplastics undergo incomplete and complete degradation, respectively, in the gastrointestinal tract. Incompletely degraded PLA polymer microplastics transform into oligomer nanoplastics, heightening bioavailability and toxicity, thereby exacerbating overall toxic effects. Conversely, complete degradation of PLA oligomer microplastics reduces bioavailability and mitigates toxicity, offering a potential avenue for toxicity reduction. Additionally, the study illuminates shared targets and toxicity mechanisms in Parkinson's disease-like neurotoxicity induced by both PLA polymer and PLA oligomer microplastics. This involves the upregulation of MICU3 in midbrains, leading to neuronal mitochondrial calcium overload. Notably, neurotoxicity is mitigated by inhibiting mitochondrial calcium influx with MCU-i4 or facilitating mitochondrial calcium efflux with DBcAMP in mice. These findings enhance the understanding of the toxicological implications of biodegradable microplastics on human health.

Keywords: Parkinson's disease; biodistribution; in vivo degradation; mitochondrial calcium uptake family member 3; oligomer nanoplastics.


Conflict of interest statement

The authors declare no conflict of interest.

Figures
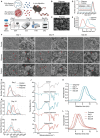
Figure 1
Figure 1
Characterization of PLA particles following in vivo digestion. A) Overview of the experimental design. Representative SEM images depicting B) PLA oligomer MPs and C) PLA polymer MPs before in vivo digestion. D) Z‐potential, PDI, and size distribution of PLA oligomer and polymer MPs prior to in vivo digestion. E) GPC analysis of PLA oligomer and polymer MPs before in vivo digestion. F) Representative SEM images of PLA oligomer and polymer MPs after in vivo digestion for 1, 14, and 28 days. Size distribution of PLA oligomer and polymer MPs after in vivo digestion for G) 1, H) 14, and I) 28 days. J) FTIR spectra of PLA oligomer and polymer MPs after in vivo digestion for 28 days. GPC analysis of K) PLA oligomer and L) polymer MPs after in vivo digestion for 1, 14, and 28 days. FTIR, Fourier‐transform infrared spectroscopy; GPC, gel permeation chromatography; MPs, microplastics; PDI, polydispersity index; PLA, polylactic acid; Z‐potential, zeta potential.
Figure 2
Figure 2
Biodistribution of PLA particles following in vivo digestion. A) Dynamic biodistribution following expo sure to PLA oligomer and polymer MPs. B) Total bioavailability of PLA particles in organs and C) total accumulation of PLA particles in the gastrointestinal tract after 28 consecutive days of exposure to PLA oligomer and polymer MPs. Summarized diagrams illustrating D) organ biodistribution and E) gastrointestinal accumulation of PLA particles after 28 consecutive days of exposure to PLA oligomer MPs. Summarized diagrams illustrating F) organ biodistribution and G) gastrointestinal accumulation of PLA particles after 28 consecutive days of exposure to PLA polymer MPs. Quantitative results of H) organ biodistribution and I) gastrointestinal accumulation. Summarized diagrams illustrating the biodistribution of PLA particles in brain regions after 28 consecutive days of exposure to J) PLA oligomer and K) polymer MPs for 28 consecutive days. L) Quantitative results and M) representative images depicting biodistribution in individual brain regions. Statistical analyses are determined by Student's t‐test; * p < 0.05. MPs, microplastics; PLA, polylactic acid.
Figure 3
Figure 3
Neurotoxicity induced by PLA oligomer and polymer MP exposure. A) Representative track images in the open field test. Quantitative analysis of B) total distance, C) activity, and D) time spent in the central zone during the open field test. E) Representative track images in the elevated plus maze test. Quantification of percentage F) open arm entries and G) open arm dwell time in the elevated plus maze test. H) Grip strength in the grip strength test. I) Latency time in the rotarod test. J) Representative images of Nissl staining, TH staining, and TUNEL staining in mouse midbrains. Relative percentages of positively stained cells in the midbrain: K) Nissl staining, L) TH staining, and M) TUNEL staining. Statistical analyses are determined by ANOVA, followed by Tukey's multiple comparison tests; * p < 0.05. ANOVA, analysis of variance; MPs, microplastics; PLA, polylactic acid. TH, tyrosine hydroxylase; TUNEL, TdT‐mediated dUTP nick‐end labeling.
Figure 4
Figure 4
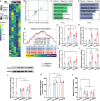
MICU3‐mediated mitochondrial calcium overload in the midbrain of mice is induced by PLA oligomer and polymer MP exposure. A) Transcriptome profiles of midbrains after 28 consecutive days of exposure to PLA oligomer and polymer MPs. B) Scatter diagram depicting DEGs in midbrains after 28 consecutive days of exposure to PLA oligomer and polymer MPs. GO analysis of the DEGs in the order of C) PLA polymer MPs > PLA oligomer MPs > control, and D) PLA polymer MPs < PLA oligomer MPs < control. E) GSEA of transcriptome data. Validation of mRNA expression through qPCR for F) Dnm1l, G) Plp1, H) Oxr1, and I) Micu3 in midbrains. J) Protein expression of MICU3 in midbrains. K) Relative mitochondrial calcium concentration and L) relative ATP content in midbrains after 28 consecutive days of exposure to PLA oligomer and polymer MPs. Statistical analyses are determined by ANOVA, followed by Tukey's multiple comparison tests; * p < 0.05. ANOVA, analysis of variance; ATP, Adenosine triphosphate; DEGs: differentially expressed genes; Dnm1l, dynamin 1 like; GSEA: gene set enrichment analysis; GO: gene ontology; Micu3, mitochondrial calcium uptake family member 3; MPs, microplastics; Oxr1, oxidation resistance 1; NES, normalized enrichment score; PLA, polylactic acid; Plp1, proteolipid protein 1; qPCR, quantitative PCR.
Figure 5
Figure 5
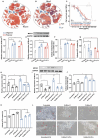
Inhibiting Micu3 expression mitigated PLA MP‐induced neurotoxicity in differentiated SH‐SY5Y cells. t‐SNE plot showing A) the canonical neuron marker gene Lrfn5 and B) the expression of our target gene Micu3 in a single‐cell RNA atlas of the mouse brain from the ALLEN BRAIN MAP.[ 18 ] C) IC50 values for PLA oligomer and polymer MPs in differentiated SH‐SY5Y cells after 24‐hour exposure, were determined using a cell viability assay. D) mRNA and E) protein expression of MICU3 in differentiated SH‐SY5Y cells after 24‐h exposure to PLA oligomer and polymer MPs. F) Relative mitochondrial calcium concentration and G) relative ATP content in differentiated SH‐SY5Y cells after 24‐h exposure to PLA oligomer and polymer MPs. H) mRNA and I) protein expression of MICU3 in differentiated SH‐SY5Y cells after 24‐h exposure to PLA oligomer MPs while inhibiting Micu3 expression. J) Relative mitochondrial calcium concentration, K) relative ATP content, and L) cell viability in differentiated SH‐SY5Y cells after 24‐h exposure to PLA oligomer MPs while inhibiting Micu3 expression. Statistical analyses are determined by ANOVA, followed by Tukey's multiple comparison tests; * p < 0.05. ANOVA, analysis of variance; ATP, adenosine triphosphate; IC50, half maximal inhibitory concentration; Lrfn5, leucine‐rich repeat and fibronectin type III domain containing 5; Micu3, mitochondrial calcium uptake family member 3; MPs, microplastics; PLA, polylactic acid.
Figure 6
Figure 6
Stabilizing mitochondrial calcium levels ameliorates PLA MP‐induced PD‐like neurodegeneration in mice. A) Treatment strategy and experimental design overview. B) Relative mitochondrial calcium concentration and C) relative ATP content in midbrains after consecutive 28 days of exposure to PLA polymer MPs while treated with MCU‐i4 or DBcAMP. D) Activity levels in the open field test. E) Grip strength assessed in the grip strength test. F) Latency time measured in the rotarod test. G) Representative images of Nissl staining, TH staining, and TUNEL staining in mouse midbrains. Relative percentages of positive staining in midbrain cells for H) Nissl staining, I) TH staining, and J) TUNEL staining. Statistical analyses are determined by ANOVA, followed by Tukey's multiple comparison tests; * p < 0.05. ANOVA, analysis of variance; Micu3, mitochondrial calcium uptake family member 3; MPs, microplastics; PLA, polylactic acid. TH, tyrosine hydroxylase; TUNEL, TdT‐mediated dUTP nick‐end labeling.
Scheme 1
Scheme 1
Schematic diagram of the present study. PLA polymer and oligomer MPs undergo incomplete and complete degradation, respectively, in the gastrointestinal tract of mice. The incomplete degradation of PLA polymer MPs heightens their bioavailability by transforming them into oligomer NPs, while the complete degradation of PLA oligomer MPs reduces the bioavailability of PLA particles. Both PLA polymer and oligomer MPs induce PD‐like neurotoxicity in mice by upregulating the expression of MICU3 in the midbrains, subsequently leading to mitochondrial calcium overload in neurons, with PLA oligomer MPs causing a more significant increase in MICU expression. ATP, adenosine triphosphate; BBB, blood–brain barrier; PLA, polylactic acid; Micu3, mitochondrial calcium uptake family member 3; MPs, microplastics; NPs, nanoplastics.

References

    1. Rosenboom J. G., Langer R., Traverso G., Nat. Rev. Mater. 2022, 7, 117. - PMC - PubMed
    1. Kim M. S., Chang H., Zheng L., Yan Q., Pfleger B. F., Klier J., Nelson K., Majumder E. L. W., Huber G. W., Chem. Rev. 2023, 123, 9915. - PubMed
    1. Ncube L. K., Ude A. U., Ogunmuyiwa E. N., Zulkifli R., Beas I. N., Materials 2020, 13. - PMC - PubMed
    1. Goel V., Luthra P., Kapur G. S., Ramakumar S. S. V., J. Polym. Environ. 2021, 29, 3079.
    1. Qin M., Chen C., Song B., Shen M., Cao W., Yang H., Zeng G., Gong J., J Clean Prod 2021, 312, 127816.

LinkOut - more resources