. 2024 May 1;6(3):fcae155.
doi: 10.1093/braincomms/fcae155. eCollection 2024.

Dorsal root ganglion magnetic resonance imaging biomarker correlations with pain in Fabry disease

Affiliations

Dorsal root ganglion magnetic resonance imaging biomarker correlations with pain in Fabry disease

Magnus Schindehütte et al. Brain Commun. .

Abstract

Fabry disease is a rare monogenetic, X-linked lysosomal storage disorder with neuropathic pain as one characteristic symptom. Impairment of the enzyme alpha-galactosidase A leads to an accumulation of globotriaosylceramide in the dorsal root ganglia. Here, we investigate novel dorsal root ganglia MR imaging biomarkers and their association with Fabry genotype and pain phenotype. In this prospective study, 89 Fabry patients were examined using a standardized 3 T MRI protocol of the dorsal root ganglia. Fabry pain was assessed through a validated Fabry pain questionnaire. The genotype was determined by diagnostic sequencing of the alpha-galactosidase A gene. MR imaging end-points were dorsal root ganglia volume by voxel-wise morphometric analysis and dorsal root ganglia T2 signal. Reference groups included 55 healthy subjects and Fabry patients of different genotype categories without Fabry pain. In patients with Fabry pain, T2 signal of the dorsal root ganglia was increased by +39.2% compared to healthy controls (P = 0.001) and by +29.4% compared to painless Fabry disease (P = 0.017). This effect was pronounced in hemizygous males (+40.7% compared to healthy; P = 0.008 and +29.1% compared to painless; P = 0.032) and was consistently observed across the genotype spectrum of nonsense (+38.1% compared to healthy, P < 0.001) and missense mutations (+39.2% compared to healthy; P = 0.009). T2 signal of dorsal root ganglia and globotriaosylsphingosine levels were the only independent predictors of Fabry pain (P = 0.047; P = 0.002). Volume of dorsal root ganglia was enlarged by +46.0% in Fabry males in the nonsense compared to missense genotype category (P = 0.005) and by +34.5% compared to healthy controls (P = 0.034). In painful Fabry disease, MRI T2 signal of dorsal root ganglia is increased across different genotypes. Dorsal root ganglion MRI T2 signal as a novel in vivo imaging biomarker may help to better understand whether Fabry pain is modulated or even caused by dorsal root ganglion pathology.

Keywords: magnetic resonance gangliography; magnetic resonance imaging; magnetic resonance neurography; neuropathic pain; peripheral neuropathy.


Conflict of interest statement

P.N. has received speaker and consulting honoraria from Amicus, Chiesi, Idorsia, Sanofi Genzyme and Takeda. C.W. has received honoraria for steering committee membership, advisory boards and lecturing from Amicus, Chiesi, Idorsia, Sanofi and Takeda. C.S. has served on scientific advisory boards for Akcea, Algiax, Air Liquide, Bayer, Grifols, Ipsen, LFB, Immunic, Merz, Pfizer, Roche and Takeda. She has received speaker honoraria from Akcea, Alnylam Amicus, Grifols, Pfizer and Teva. She serves or has served as a journal editor, associate editor or editorial advisory board member for the European Journal of Neurology, PLoS One and PAIN Reports. M.P. has received speaker honoraria from Merck and Bayer. The other authors report no competing interests.

Figures

Graphical Abstract
Graphical Abstract
Figure 1
Figure 1
Visualization of DRG T2 signal effect in Fabry pain. Visualization of the DRG T2 signal effect in a patient with Fabry pain (C; T2 = 60.2 a.u.) compared to an Fabry disease patient without Fabry pain (B; T2 = 37.8 a.u.) and a healthy control (A; T2 = 33.5 a.u.). The heat maps represent the voxel-wise mapping of the normalized T2 signal of the region of interest (DRG level S1) in these representative subjects. Normalized DRG T2 signal intensity in arbitrary units (a.u.). HC, healthy control; DRG, dorsal root ganglion; FDn, no Fabry disease pain; FDp, Fabry disease pain; S1, sacral level 1.
Figure 2
Figure 2
DRG T2 signal in patients with and without Fabry pain. (A) DRG T2 signal is elevated in patients with Fabry pain compared to patients without Fabry pain and healthy controls (49.7 versus 38.4 versus 35.7 a.u.). One-way ANOVA: F = 6.9; P = 0.001; (B) DRG T2 signal is increased in Fabry disease patients with pain and nonsense mutations of GLA (49.3 versus 39.0 versus 35.7 a.u.). One-way ANOVA: F = 5.6; P = 0.006; (C) DRG T2 signal is increased in Fabry disease patients with pain and missense mutations of GLA (49.7 versus 37.4 versus 35.7 a.u.). One-way ANOVA: F = 4.9; P = 0.010. DRG, dorsal root ganglion; FD, Fabry disease; a.u., arbitrary units.
Figure 3
Figure 3
ROC analysis for predicting Fabry pain phenotype in Fabry disease patients. Analysis of the relationship between Fabry pain and possible predictors, including Fabry disease genotype, BMI, sex, DRG volume, DRG T2 signal intensity and Lyso-Gb3 levels. The regression model was fitted using data transformed to optimize model performance, with transformations such as square root for BMI, DRG volume, DRG T2 signal intensity and logarithmic transformation for Lyso-Gb3 levels. Coefficients of the model were estimated and showed that DRG T2 signal intensity (P = 0.047) and Lyso-Gb3 levels (P = 0.002) were the only significant predictors contributing to the model of Fabry pain. The ROC analysis underlines the performance of the model (AUC = 0.89). The goodness of fit of the model was assessed using the Akaike information criterion (AIC = 81.607) and pseudo-R-squared values (McF R2 = 0.397, ML R2 = 0.423, CU R2 = 0.565). The robustness of the model was confirmed by nonlinear bootstrapping (LLV = −33.80; B = 3.41; SE = 5.20). AIC, Akaike information criterion; McF R², McFadden’s pseudo-R-squared; ML R², Maximum Likelihood pseudo-R-squared; CU R², Cragg and Uhler’s pseudo-R-squared; BMI, body mass index; DRG, dorsal root ganglion; Lyso-Gb3, globotriaosylsphingosine; ROC, receiver operating characteristic.
Figure 4
Figure 4
DRG volume between Fabry disease genotypes. (A) DRG volume is increased in the most severe Fabry disease genotype (nonsense mutation with no residual enzymatic activity) in hemizygous Fabry disease males compared to Fabry disease patients with a missense mutation of GLA and healthy controls (2562 versus 1755 versus 1905 mm3). One-way ANOVA: F = 5.4; P = 0.007; (B) but not in heterozygous Fabry disease females (1896 versus 1656 versus 1683 mm3). One-way ANOVA: F = 1.2; P = n.s. DRG, dorsal root ganglion; FD, Fabry disease.
Figure 5
Figure 5
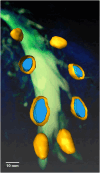
Visualization of DRG enlargement in Fabry disease. 3D surface volume-rendered visualization where the L5 and S1 DRGs are intentionally cut to visualize the pathological DRG volume enlargement: The outer shell represents the ground truth voxel-wise segmentation of a representative Fabry disease male with a nonsense mutation. On average, the DRG volumes of this most severely affected genotype show a mean DRG enlargement of +34.5% (outer shell) compared to the mean DRG volume of healthy controls (nucleus). The scale bar applies to the left DRG S1 (DRG bottom left with nucleus). DRG, dorsal root ganglion; L5, lumbar level 5; S1, sacral level 1.

References

    1. Cairns T, Müntze J, Gernert J, Spingler L, Nordbeck P, Wanner C. Hot topics in Fabry disease. Postgrad Med J. 2018;94(1118):709–713. - PMC - PubMed
    1. Bangari DS, Ashe KM, Desnick RJ, et al. α-Galactosidase A knockout mice: Progressive organ pathology resembles the type 2 later-onset phenotype of Fabry disease. Am J Pathol. 2015;185(3):651–665. - PubMed
    1. Üçeyler N, Ganendiran S, Kramer D, Sommer C. Characterization of pain in Fabry disease. Clin J Pain. 2014;30(10):915–920. - PubMed
    1. van der Veen SJ, Hollak CEM, van Kuilenburg ABP, Langeveld M. Developments in the treatment of Fabry disease. J Inherit Metab Dis. 2020;43(5):908–921. - PMC - PubMed
    1. Hofmann L, Hose D, Grießhammer A, et al. Characterization of small fiber pathology in a mouse model of Fabry disease. Elife. 2018;7:e39300. - PMC - PubMed

LinkOut - more resources