. 2024 May 1:11:1359235.
doi: 10.3389/fmolb.2024.1359235. eCollection 2024.

Comprehensive analysis of juvenile idiopathic arthritis patients' immune characteristics based on bulk and single-cell sequencing data

Affiliations

Comprehensive analysis of juvenile idiopathic arthritis patients' immune characteristics based on bulk and single-cell sequencing data

Mubo Liu et al. Front Mol Biosci. .

Abstract

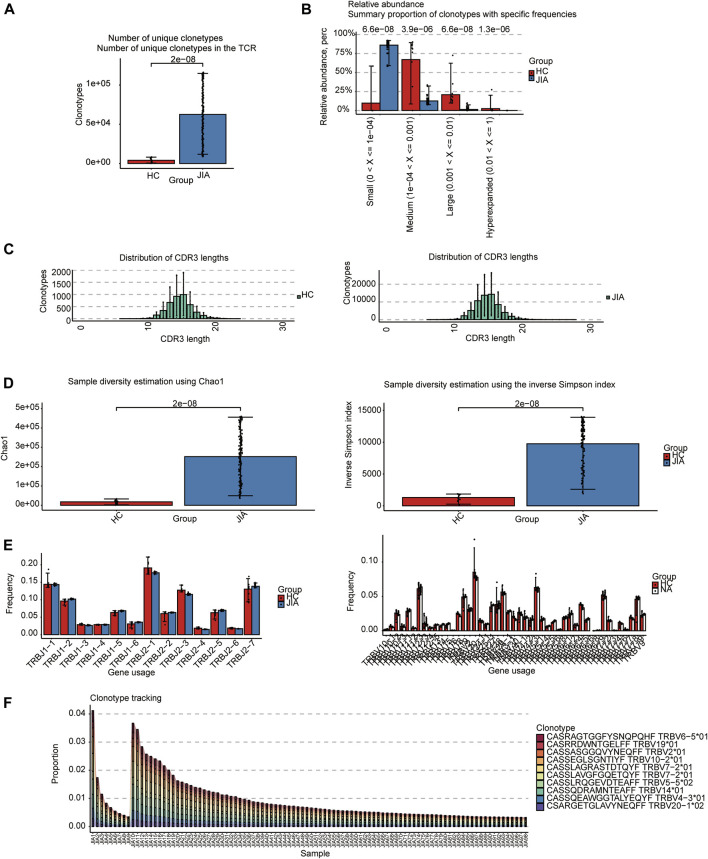
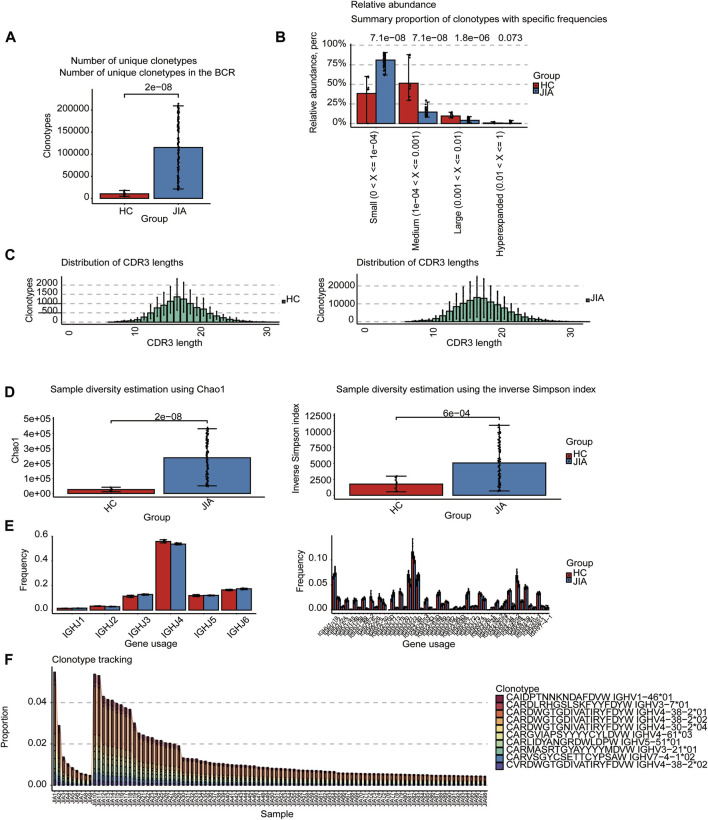
Background: The pathogenesis of juvenile idiopathic arthritis (JIA) is strongly influenced by an impaired immune system. However, the molecular mechanisms underlying its development and progression have not been elucidated. In this study, the computational methods TRUST4 were used to construct a T-cell receptor (TCR) and B-cell receptor (BCR) repertoire from the peripheral blood of JIA patients via bulk RNA-seq data, after which the clonality and diversity of the immune repertoire were analyzed.

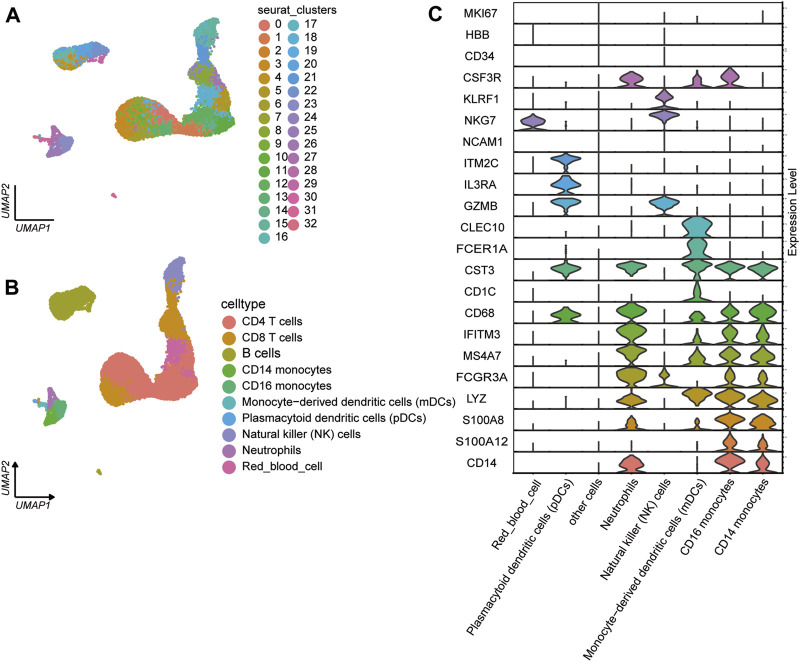
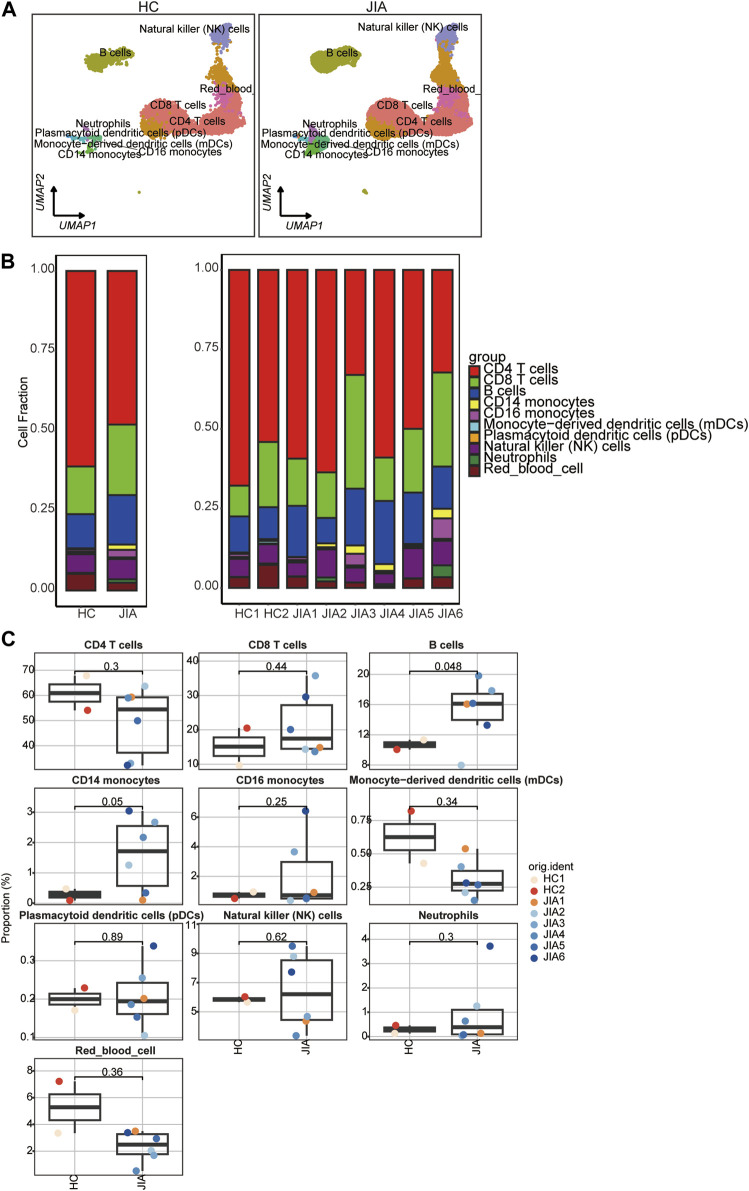
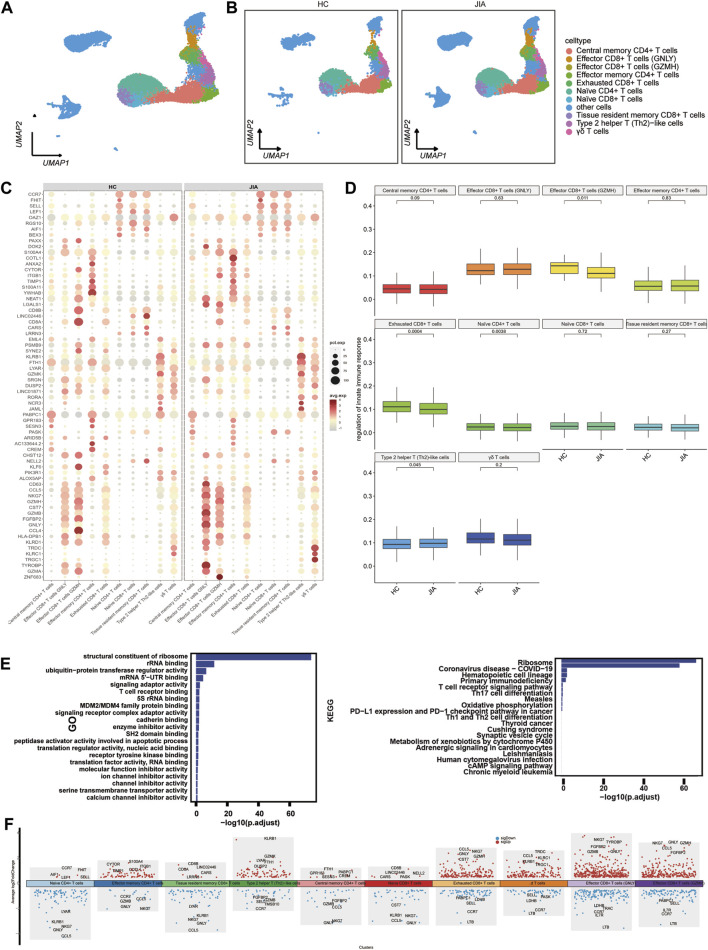
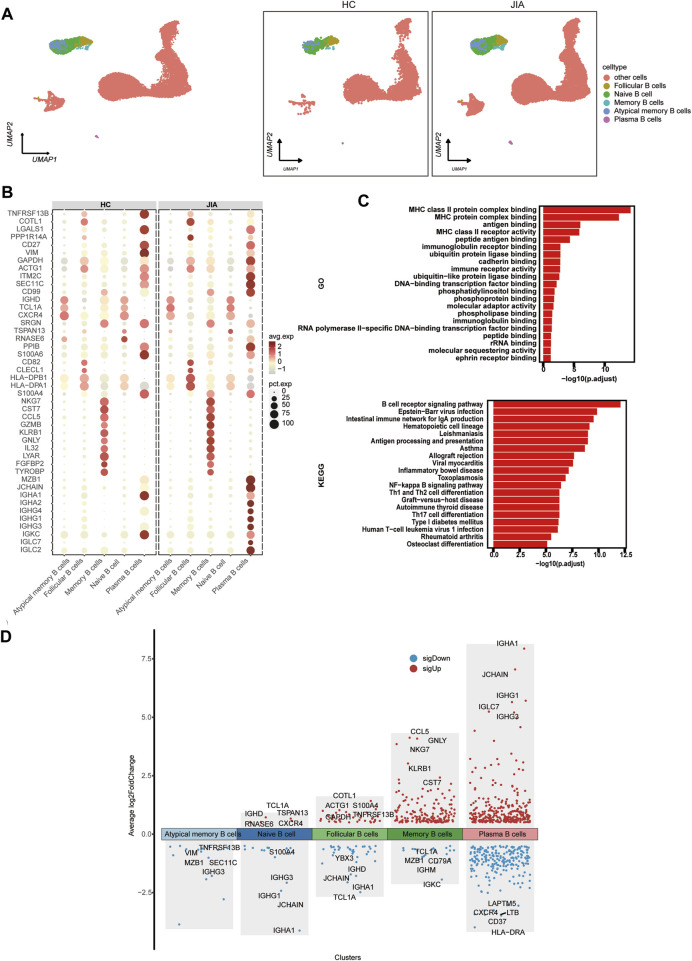
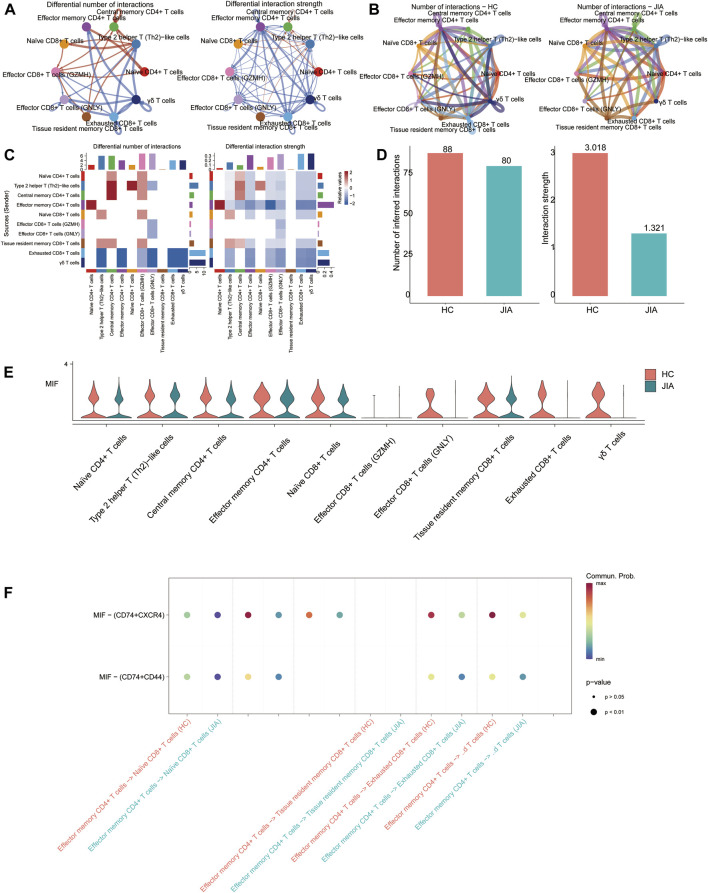
Results: Our findings revealed significant differences in the frequency of clonotypes between the JIA and healthy control groups in terms of the TCR and BCR repertoires. This work identified specific V genes and J genes in TCRs and BCRs that could be used to expand our understanding of JIA. After single-cell RNA analysis, the relative percentages of CD14 monocytes were significantly greater in the JIA group. Cell-cell communication analysis revealed the significant role of the MIF signaling pathway in JIA.

Conclusion: In conclusion, this work describes the immune features of both the TCR and BCR repertoires under JIA conditions and provides novel insight into immunotherapy for JIA.

Keywords: B-cell receptor; T-cell receptor; immune repertoire; juvenile idiopathic arthritis; single-cell RNA sequencing.


Conflict of interest statement

The authors declare that the research was conducted in the absence of any commercial or financial relationships that could be construed as a potential conflict of interest.

Figures

FIGURE 1
FIGURE 1
Characteristics of the JIA and HC immune repertoires (TCR repertoires). (A) Comparison of clonotype numbers for the TCR repertoire. (B) The relative abundance of TCR clonotypes with varying frequencies in the JIA and HC groups. (C) Distributions of TCR CDR3 amino acid sequence length in the JIA and HC groups. (D) Comparison of the differences in the clonotype diversity indicators Chao1 and InvSimpson indices. (E) Comparison of the Gene Usages of TRBV and TRBJ. (F) Clonotype tracking of JIA samples. Bar average, error bar standard error. p values were obtained by the Wilcoxon test.
FIGURE 2
FIGURE 2
Characteristics of the JIA and HC immune repertoires (BCR repertoires). (A) Comparison of clonotype numbers for the BCR repertoire. (B) The relative abundance of BCR clonotypes with varying frequencies in the JIA and HC groups. (C) Distributions of BCR CDR3 amino acid sequence length in the JIA and HC groups. (D) Comparison of the differences in the clonotype diversity indicators Chao1 and InvSimpson indices. (E) Comparison of the Gene Usages of TRBV and TRBJ. (F) Clonotype tracking of JIA samples. Bar average, error bar standard error. p values were obtained by the Wilcoxon test.
FIGURE 3
FIGURE 3
Single-cell transcriptome profiles of PBMCs from the JIA and HC groups. (A) Identification of cell populations. A total of 8 PBMC samples from the HC group (n = 2) and JIA group (n = 6) were sequenced, and a total of 23,104 high-quality single cells were obtained. After quality control, 20,986 cells were obtained, and 33 clusters of cells were identified via UMAP. Each dot corresponds to a single cell and is colored according to the cell type. Each color represents a cluster. (B) UMAP charts of 20,986 single cells colored according to cell type. The 33 cell clusters were further identified as 10 cell types. UMAP was used to identify and visualize these celltypes. Each dot represents an individual cell and is colored according to its corresponding cell type. (C) Canonical cell markers were utilized to assign cell identities to the clusters represented in the UMAP plot.
FIGURE 4
FIGURE 4
Differences in cell composition between the JIA and HC groups. (A) UMAP plots of the HCs and JIA patients. Each dot corresponds to a single cell and is colored according to the cell type. (B) The average proportion of each cell type was derived from the HCs and JIA groups. The left picture depicts the average proportion of each cell type derived from the two groups. The calculation method was as follows: (the number of specific cell clusters in one group) ⁄ (the number of total cells in one group). The dot plot in the upper panel of the right picture shows the sum of the absolute counts of cell subsets in the PBMCs of each sample, and the bottom bar plot shows the cell compositions at the single sample level. The calculation method was as follows: (the number of specific cell clusters in one sample) ⁄ (the number of total cells in one sample). (C) Box charts showing the proportion of each cell type among the total PBMCs in each sample across the three groups (n = 2 in the HC group, n = 6 in the JIA group). p < 0.05 was considered to indicate statistical significance.
FIGURE 5
FIGURE 5
Characterization of T cell subsets between the JIA and HC groups. (A) UMAP visualization of distinct populations of T-cell subsets is depicted. (B) UMAP plots of T-cell subsets acquired from the HCs and the JIA group are shown. (C) A dot plot is presented, illustrating the gene expression and percentage of T cells expressing the top 70 genes that exhibited differential expression. (D) The size of each dot corresponds to the percentage of cells expressed, while the color represents the expression level on a logarithmic scale. Statistical analysis was conducted using the Wilcoxon rank sum test. (E) Enrichment analyses of the differentially expressed genes (DEGs) were performed using the Biological Process (BP) database within the Gene Ontology (GO). The GO terms are annotated with their respective names and IDs and are arranged in descending order based on the logarithm of the reciprocal of the p-value (-log10). The top 20 enriched GO terms are displayed. Enrichment analyses of the Kyoto Encyclopedia of Genes and Genomes (KEGG) were performed. The top 20 enriched GO terms are displayed. (F) Scatter plot showing changes in DEGs, where red represents upregulation and blue represents downregulation.
FIGURE 6
FIGURE 6
Characterization of B cell subsets between the JIA and HC groups. (A) UMAP plots of distinct populations of memory B cells, naïve B cells, activated B cells and plasma B cells are shown. Additional cell clusters are denoted as other unidentified cells. UMAP plots of B-cell subsets acquired from the HCs and from the JIA group are shown. (B) A dot plot is presented, illustrating the gene expression and percentage of B cells expressing the top 50 genes that exhibited differential expression. (C) Enrichment analyses of the DEGs were performed using the BP database within the GO database. The GO terms are annotated with their respective names and IDs and are arranged in descending order based on the logarithm of the reciprocal of the p-value (-log10). The top 20 enriched GO terms are displayed. KEGG enrichment analyses were performed. The top 20 enriched GO terms are displayed. (D) Scatter plot showing changes in DEGs, where red represents upregulation and blue represents downregulation.
FIGURE 7
FIGURE 7
Identification of gene coexpression modules among T cells. (A) Weigned gene coexpression network analysis was performed with T cells. (B) A Weighed gene coexpression network analysis was performed on T cells. (C) Dot plot for enrichment of modules in different cell types and different groups. (D) Dot plot of the GO functional enrichment analysis of the T cells-M3 module. (E) Protein–protein interaction network demonstrating the interactions within Module T cells-M3 (F). The top ten genes of each module calculated according to connectivity.
FIGURE 8
FIGURE 8
Identification of gene coexpression modules among B cells (A) Weigned gene coexpression network analysis was performed with B cells. (B) A weighted gene coexpression network analysis was constructed among the B cells. (C) Dot plot for enrichment of modules in different cell types and different groups. (D) Dot plot of the GO functional enrichment analysis of module B cells-M2. (E) Protein-protein interaction network demonstrating the interactions within Module B cells-M2 (F). The top ten genes of each module calculated according to connectivity.
FIGURE 9
FIGURE 9
CellChat analysis of the interactions between T-cell subsets. (A, B) Circle plots illustrate the number and strength of interactions between T-cell subsets in the HC and JIA groups. (C, D) Identification of signaling pathways in cells via network centraility analysis. (E) The gene targets from the MIF signaling and the expression levels among HC and JIA (F) Discovery of dominant cell communication patterns. The inferred outgoing communication patterns of secreting cells, which show the correspondence between the inferred latent patterns and cell groups, as well as signaling pathways. The thickness of the flow indicates the contribution of the cell group or signaling pathway to each latent pattern.
FIGURE 10
FIGURE 10
Characterization of the landscape of T cells and developmental trajectories of T cells in JIA. (A) Developmental trajectories of the T-cell lineage inferred using monocle2; each cell subtype is marked with a different color. (B) Cell density variation in T-cell subtypes during pseudotime (top). (C) Pseudoscatter plots showing the expression variation and distribution of some specific genes during pseudotime, color coded by cell type.
FIGURE 11
FIGURE 11
Characterization of the landscape of B cells and developmental trajectories of B cells in JIA. (A) Developmental trajectories of the B-cell lineage inferred using monocle2; each cell subtype is marked with a different color. (B) Cell density variation in B-cell subtypes during pseudotime (top). (C) Pseudoscatter plots showing the expression variation and distribution of some specific genes during pseudotime, color-coded by cell type.
FIGURE 12
FIGURE 12
The TF of T-cell subgroups predicted by SCENIC analysis. (A) Dimplot of the main TFs in the T-cell subgroups. (B) Heatmap of the expression levels of selected TFs in T-cell subgroups. (C) RANK plot of T-cell subgroup TFs.
FIGURE 13
FIGURE 13
The TF of B-cell subgroups predicted by SCENIC analysis. (A) Dimplot of B-cell subgroup main TFs. (B) Heatmap of the expression levels of selected TFs in B-cell subgroups. (C) RANK plot of B-cell subgroup TFs.

Similar articles

Cited by

References

    1. Aibar S., González-Blas C. B., Moerman T., Huynh-Thu V. A., Imrichova H., Hulselmans G., et al. (2017). SCENIC: single-cell regulatory network inference and clustering. Nat. Methods 14, 1083–1086. 10.1038/nmeth.4463 - DOI - PMC - PubMed
    1. Ambler W. G., Nanda K., Onel K. B., Shenoi S. (2022). Refractory systemic onset juvenile idiopathic arthritis: current challenges and future perspectives. Ann. Med. 54, 1839–1850. 10.1080/07853890.2022.2095431 - DOI - PMC - PubMed
    1. Attaf M., Huseby E., Sewell A. K. (2015). αβ T cell receptors as predictors of health and disease. Cell Mol. Immunol. 12, 391–399. 10.1038/cmi.2014.134 - DOI - PMC - PubMed
    1. Bilsborrow J. B., Doherty E., Tilstam P. V., Bucala R. (2019). Macrophage migration inhibitory factor (MIF) as a therapeutic target for rheumatoid arthritis and systemic lupus erythematosus. Expert Opin. Ther. Targets 23, 733–744. 10.1080/14728222.2019.1656718 - DOI - PMC - PubMed
    1. Jin S., Guerrero-Juarez C. F., Zhang L., Chang I., Ramos R., Kuan C. H., et al. (2021). Inference and analysis of cell-cell communication using CellChat. Nat. Commun. 12, 1088. 10.1038/s41467-021-21246-9 - DOI - PMC - PubMed