

Construction of an immune-related gene prognostic model with experimental validation and analysis of immune cell infiltration in lung adenocarcinoma
- PMID: 38751753
- PMCID: PMC11094586
- DOI: 10.3892/ol.2024.14430
Construction of an immune-related gene prognostic model with experimental validation and analysis of immune cell infiltration in lung adenocarcinoma
Abstract
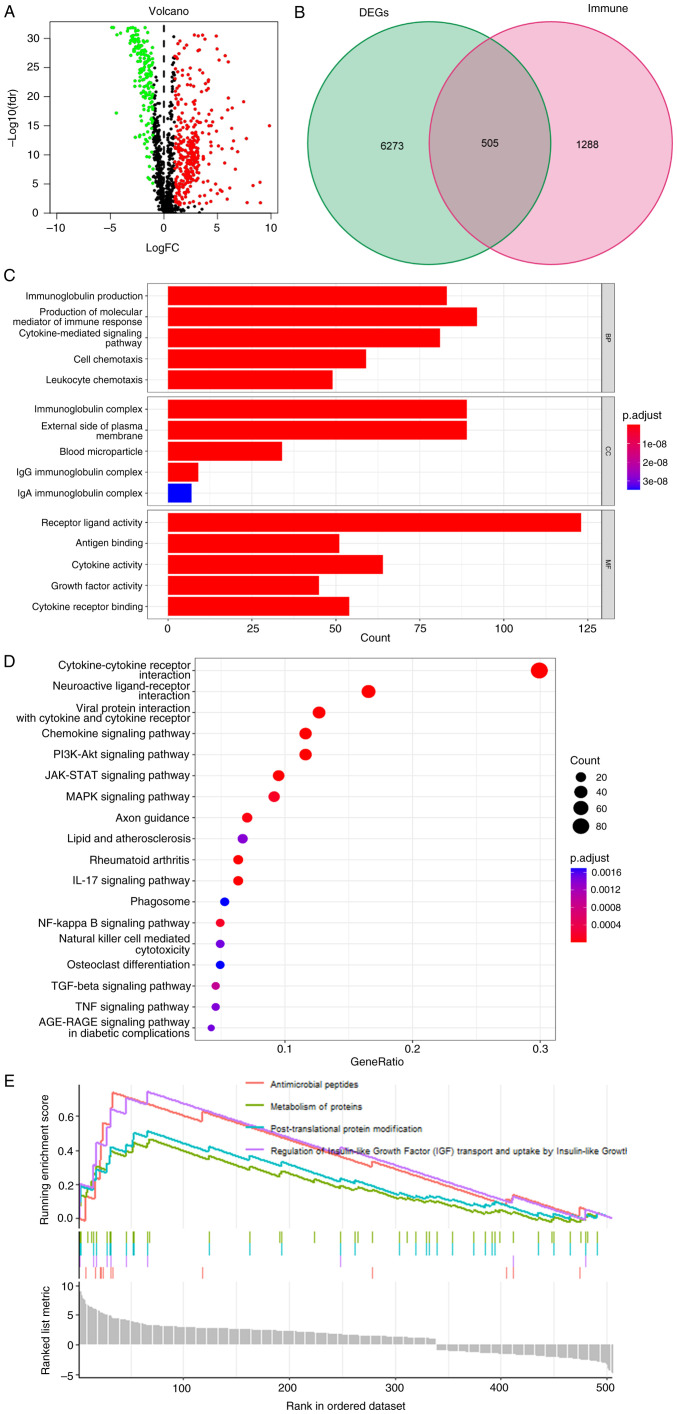
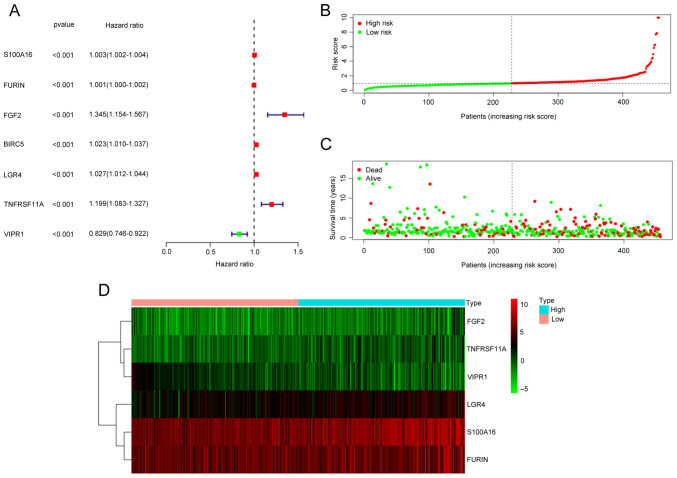
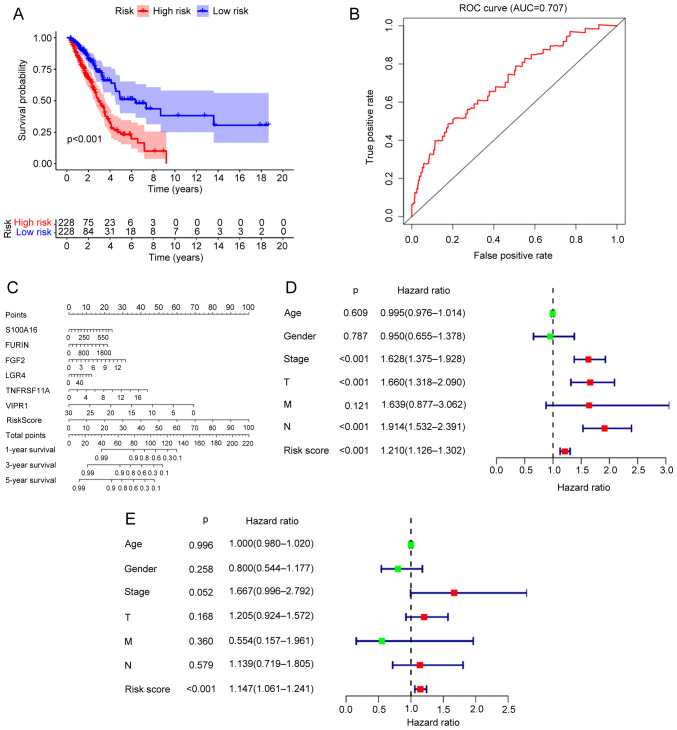
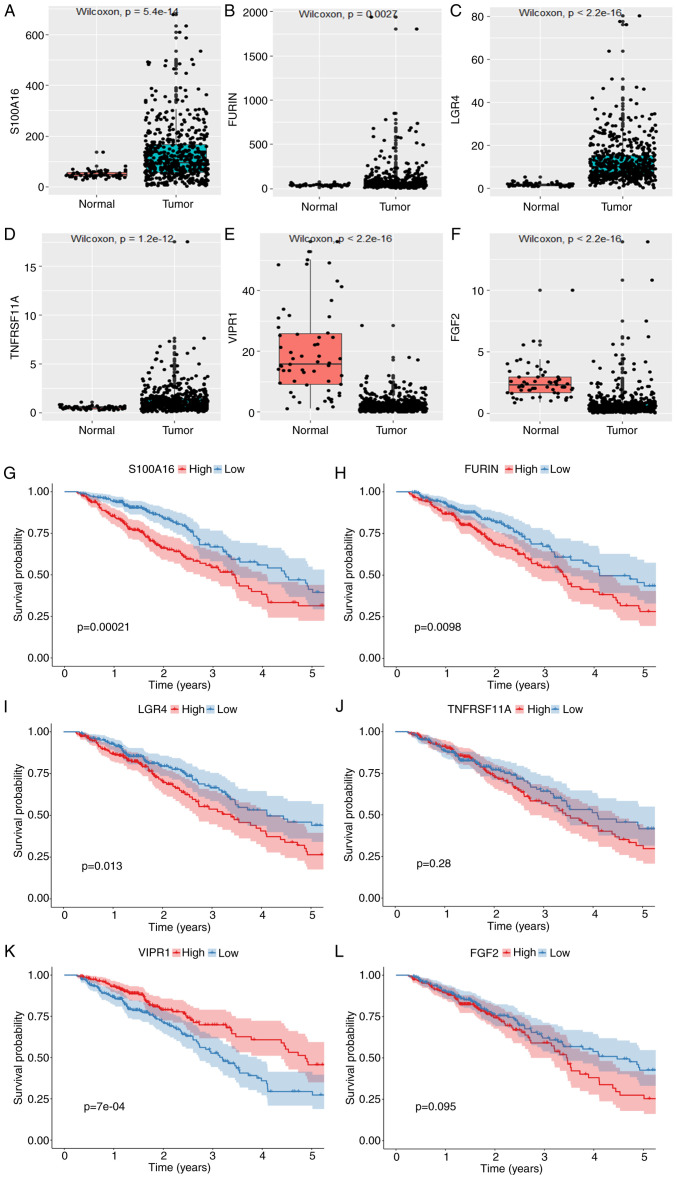
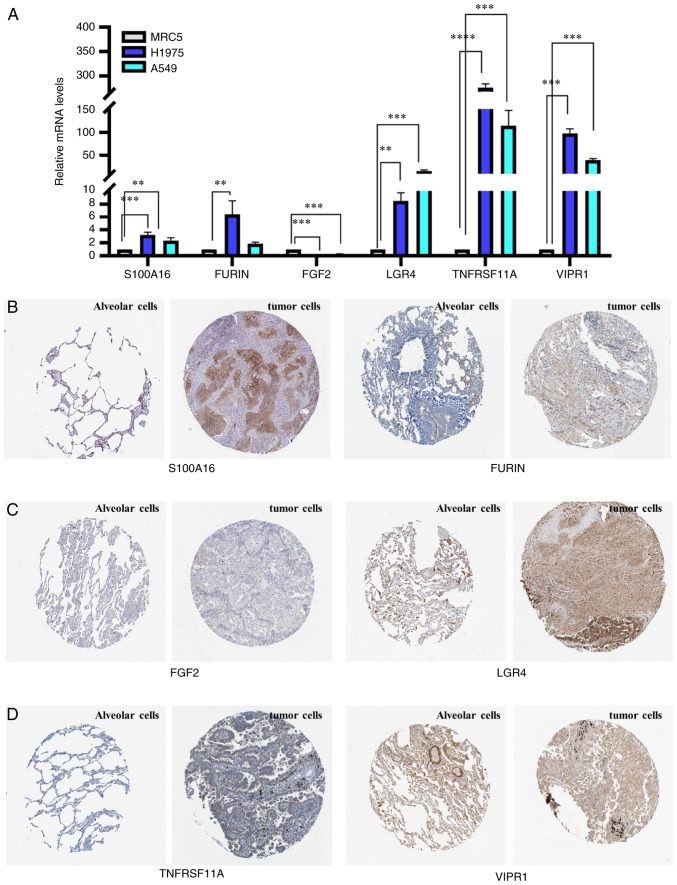
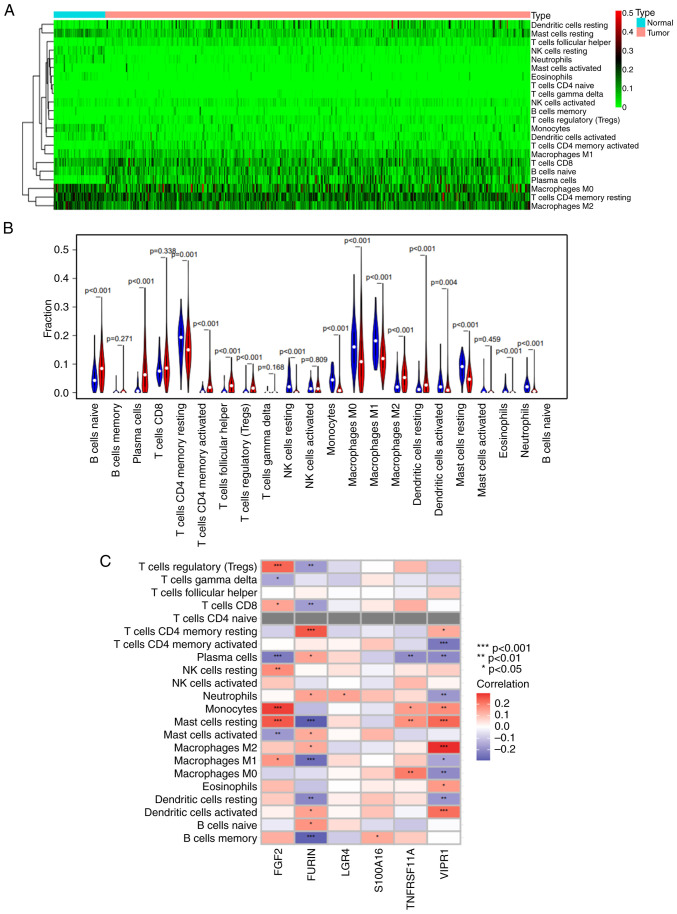
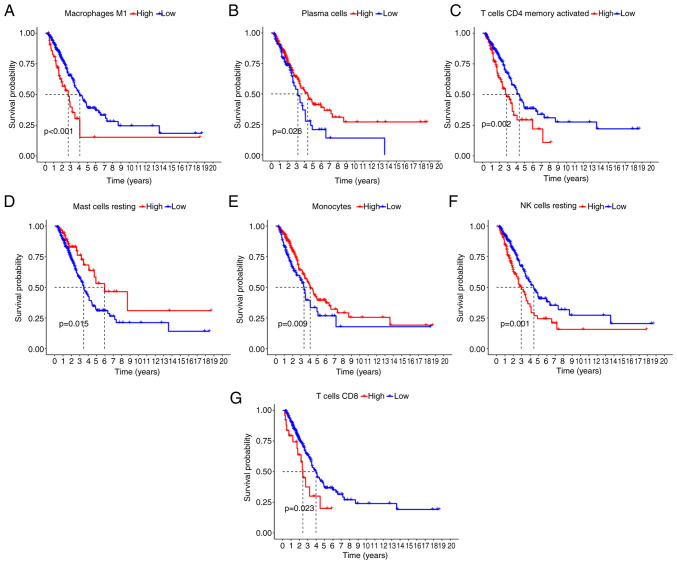
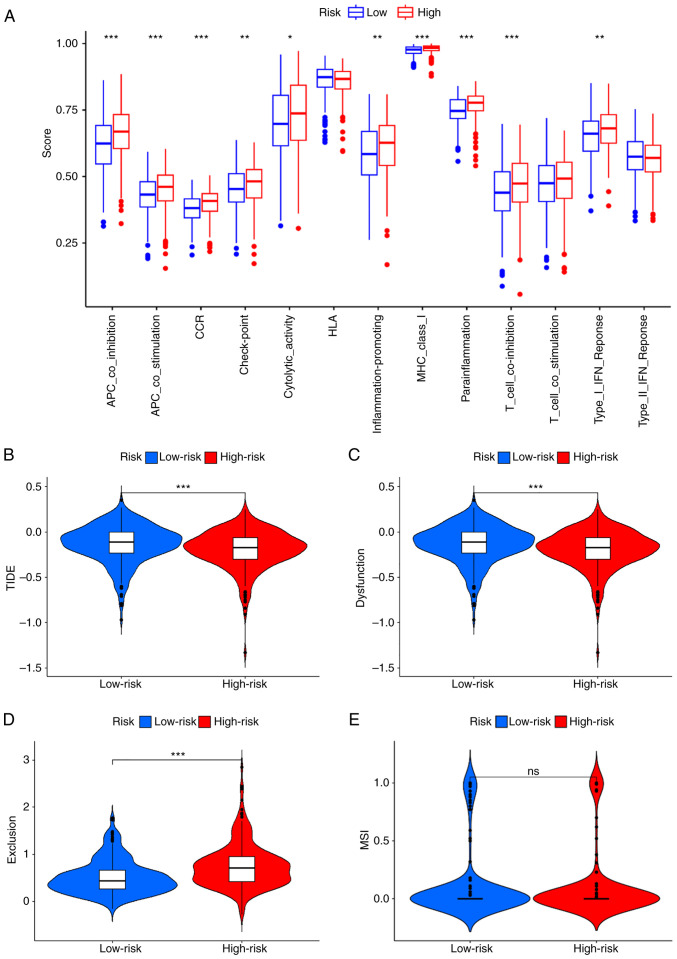
There is a correlation between tumors and immunity with the degree of immune cell infiltration in tumors being closely related to tumor growth and progression. Therefore, the present study identified immune-related prognostic genes and evaluated the immune infiltration level in lung adenocarcinoma (LUAD). This study performed Kyoto Encyclopedia of Genes and Genomes, Gene Ontology, and Gene Set Enrichment Analysis (GSEA) enrichment analyses on differential immune-associated genes. A risk model was created and validated using six immune-related prognostic genes. Reverse transcription-quantitative PCR was used to assess the prognostic gene expression in non-small cell lung cancer cells. Immune cell infiltration in LUAD was analyzed using the CIBERSORT method. Single sample GSEA was used to compare Tumor Immune Dysfunction and Exclusion (TIDE) scores between high and low-risk groups and to assess the activation of thirteen immune-related pathways. Multifactor Cox proportional hazards model analysis identified six prognostic risk genes (S100A16, FURIN, FGF2, LGR4, TNFRSF11A and VIPR1) to construct a risk model. The survival and receiver operating characteristic curves indicated that patients with higher risk scores had lower overall survival rates. The expression levels of prognostic genes S100A16, FURIN, LGR4, TNFRSF11A and VIPR1 were significantly increased in LUAD. B cells naive, plasma cells, T cells CD4 memory activated, T cells follicular helper, T cells regulatory, NK cells activated, macrophages M1, macrophages M2, and Dendritic cells resting cells showed elevated expression in LUAD. The prognostic genes were differentially associated with individual immune cells. Immune-related function scores, such as those for antigen presenting cell (APC) co-stimulation, APC co-inhibition, check-point, Cytolytic-activity, chemokine receptor, parainflammation, major histocompatibility complex-class-I, type-I-IFN-reponse and T-cell-co-inhibition, were higher in the high-risk group compared with the low-risk group. Furthermore, the TIDE score of the high-risk group was significantly lower than the low-risk group. This immune-related gene prognostic model has the potential to predict the prognosis of LUAD patients, supporting the development of a personalized clinical diagnosis and treatment plan.
Keywords: bioinformatics; immune cell infiltration; immune-related genes; lung adenocarcinoma; prognosis.
Copyright: © 2024 Yang et al.
Conflict of interest statement
The authors declare that they have no competing interests.
Figures
Similar articles
-
Construction of a Prognostic Immune-Related LncRNA Risk Model for Lung Adenocarcinoma.Front Cell Dev Biol. 2021 Mar 18;9:648806. doi: 10.3389/fcell.2021.648806. eCollection 2021. Front Cell Dev Biol. 2021. PMID: 33869203 Free PMC article.
-
Prognosis and immunotherapy significances of a cancer-associated fibroblasts-related gene signature in lung adenocarcinoma.Cell Mol Biol (Noisy-le-grand). 2023 Dec 20;69(14):51-61. doi: 10.14715/cmb/2023.69.14.9. Cell Mol Biol (Noisy-le-grand). 2023. PMID: 38279482
-
Comprehensive analysis to identify a novel diagnostic marker of lung adenocarcinoma and its immune infiltration landscape.Front Oncol. 2023 Jun 20;13:1199608. doi: 10.3389/fonc.2023.1199608. eCollection 2023. Front Oncol. 2023. PMID: 37409245 Free PMC article.
-
Development of the prognostic value in lung adenocarcinoma based on anoikis-related genes and initial experimental validation.J Gene Med. 2023 Sep;25(9):e3534. doi: 10.1002/jgm.3534. Epub 2023 May 31. J Gene Med. 2023. PMID: 37259225
-
Analysis of expression differences of immune genes in non-small cell lung cancer based on TCGA and ImmPort data sets and the application of a prognostic model.Ann Transl Med. 2020 Apr;8(8):550. doi: 10.21037/atm.2020.04.38. Ann Transl Med. 2020. PMID: 32411773 Free PMC article.
References
-
- Ortega MA, Pekarek L, Navarro F, Fraile-Martínez O, García-Montero C, Álvarez-Mon MÁ, Diez-Pedrero R, Boyano-Adánez MDC, Guijarro LG, Barrena-Blázquez S, et al. Updated views in targeted therapy in the patient with non-small cell lung cancer. J Pers Med. 2023;13:167. doi: 10.3390/jpm13020167. - DOI - PMC - PubMed
LinkOut - more resources
Full Text Sources
Research Materials